Today (April 18, 2024), the Australian Bureau of Statistics released the latest - Labour Force,…
Labour force data – most signs good
The Australian Bureau of Statistics (ABS) released the Labour Force data for November 2010. As usual the bank economists got it wrong and underestimated the growth in employment. The data shows that the labour market is improving – employment growth positive and biased towards full-time jobs; a rising participation rate; and falling unemployment – the troika we look for. The commentators are almost demanding that the RBA increase interest rates sooner rather than later. But that would be a very stupid thing to do. The growth we have seen in November is required to be sustained for an extended period to ensure that we continue to eat in to the pool of unemployment and underemployment. Deliberately curtailing that growth with contractionary policy initiatives would be an act of vandalism and would deny those workers who remain idle (12.4 per cent of available labour) the chance to enjoy income earning opportunities. The data definitely doesn’t support the claims by the Government and the RBA that there is an inflation threat building. There is still plenty of slack in the Australian labour market and for the first time in several months the degree of slack fell marginally. I am not complaining – just cautious.
The summary ABS Labour Force (seasonally adjusted) estimates for November 2010 are:
- Employment increased 54,600 (+0.5 per cent) with full-time employment increasing by 55,100 and part-time employment decreasing by 400. This reverses the dominance of part-time employment growth in recent months.
- Unemployment decreased 19,500 to 627,800.
- The official unemployment rate fell by 0.2 points to 5.2 per cent.
- The participation rate rose by 0.1 percentage points to 66.1 per cent (a record high) and confirms the trend in recent months – it also shows that workers who had previously given up looking for work are now coming back into the labour force.
- Aggregate monthly hours worked increased 0.7 million hours (0.04 per cent) – that is barely moved.
- The quarterly labour underutilisation estimates for November showed that underemployment fell from 7.3 per cent in the third-quarter to 7.1 per cent as a result of the growth in full-time employment. Total labour underutilisation (computed by the ABS as the sum of underemployment and unemployment) was estimated to be 12.4 per cent down from 12.5 per cent in the August quarter. So very little dent in the rate at which we are wasting our available productive labour.
The ABC news report carried the headline – Rates to rise after jobs surge and the prediction was based on interviews with bank economists.
The report said:
Economists have warned that interest rates are likely to rise early in the new year after the latest labour force numbers came in well above expectations.
And the phrase “well above expectations” should provide ample warning to those who think monthly figures are a guide to anything. The bank economists on average had predicted around 19,000 jobs would be (net) created in November so they were quite a bit out given that 54,600 net jobs emerged.
Further, it is clear that the bank economists are a one-trick pony – any sign of growth automatically leads to predictions of interest rate hikes.
The fact is that the inflationary environment is still benign in Australia and the total labour underutilisation rates remain high.
Employment growth falls and not strong enough to absorb the labour force growth
The November data shows that employment growth was up by 0.5 percentage points compared to labour force growth of 0.3 points, which means that unemployment fell modestly.
The other good sign is that the employment growth was totally driven by full-time work with part-time employment falling slightly.
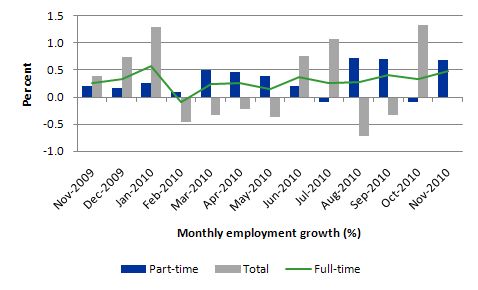
The following graph shows the month by month growth in full-time (blue columns), part-time (grey columns) and total employment (green line) from November 2009 to November 2010 using seasonally adjusted data. The picture has been mixed over the last 12 months with employment growth averaging 0.3 points (full-time 0.3 points ; part-time 0.2 points).
There is no general trend yet and the fluctuations between full-time employment growth and decline not yet sorted out. I am thinking the trend is for an improving labour market as long as the investment intentions of the private sector for 2011 remain and are realised.
However, much more growth is needed if unemployment and underemployment are to fall significantly.
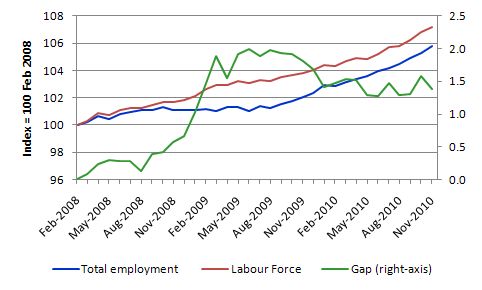
To put the recent data in perspective, the following graph shows the movement in the labour force and total employment since the low-point unemployment rate month in the last cycle (February 2008) to November 2010. The two series are indexed to 100 at that month. The green line (right-axis) is the gap (plotted against the right-axis) between the two aggregates and measures the change in the unemployment rate since the low-point of the last cycle (when it stood at 4 per cent).
The Gap series gives you a good impression of the asymmetry in unemployment rate responses even when the economy experiences a mild downturn (such as the case in Australia). The unemployment rate jumps quickly but declines slowly.
It also highlights the fact that the recovery is still not strong enough to bring the unemployment rate back down to its pre-crisis low. You can see clearly that the unemployment rate fell in late 2009 and no improvement has been made in the course of this year although that is in part because of the rising participation rate.
So while the unemployment rate is hovering around 5.2 per cent give or take, hidden unemployment has been falling which is a good outcome.
Employment growth for teenagers
November saw some employment growth (finally) for 15-19 year olds although it was mostly part-time in nature.
At a time when we keep emphasising the future challenges facing the nation in terms of an ageing population and rising dependency ratios the economy still fails to provide enough work (and on-the-job experience) for our teenagers who are our future workforce.
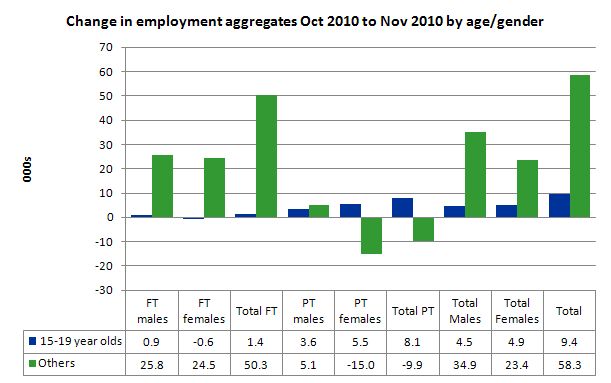
The following graph shows the distribution of net employment creation in the last month by full-time/part-time status and age/gender category (15-19 year olds and the rest).
Teenage employment rose in November by 9.4 thousand with part-time employment growth dominating.
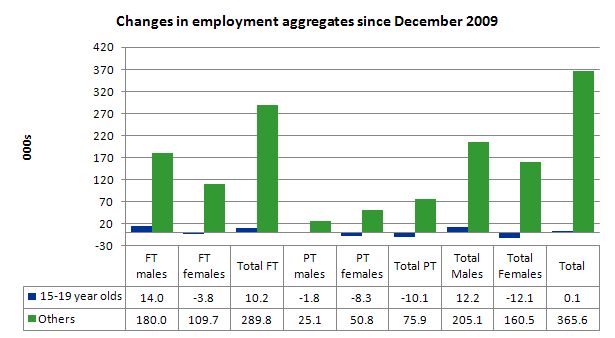
To put this month’s figures in perspective though, the following graph shows the change in aggregates since December 2009. There you see that in the recovery period of the last 12 months, teenagers have barely experienced any employment growth. Up until November 2010, the jobs market had been shrinking for them.
Teenage unemployment rates fell in November from 17.5 per cent in October 2010 to 17.0 per cent with participation also rising by a healthy 0.4 points.
However, the underemployment rate for 15-24 year olds rose in November from 13.1 per cent to 13.7 per cent. Overall labour underutilisation rose from 25 per cent to 25.1 per cent between October and November.
The fact that there is around 25 per cent for under 24 year olds (who are seeking work) idle at present (sum of unemployment and underemployment) then you realise there is still a lot of excess capacity that can be tapped via the creation of appropriate job/training slots.
At present, my summary is that the recovery that is occurring in the Australian economy is not providing enough opportunities for our youngest workers. These workers are our future. We talk of the intergenerational demands on public spending and rising dependency ratios. But then we allow 25 odd percent of our active youth to remain idle and outside the skill development process. This waste ensures our future productivity growth will be lower than it otherwise could be.
Unemployment
The unemployment rate fell by 0.2 points in November after rising sharply from 5.1 per cent to 5.4 per cent in October 2010. While employment growth had been faltering in recent months and failed to outstrip the growth in the labour force the situation improved this month.
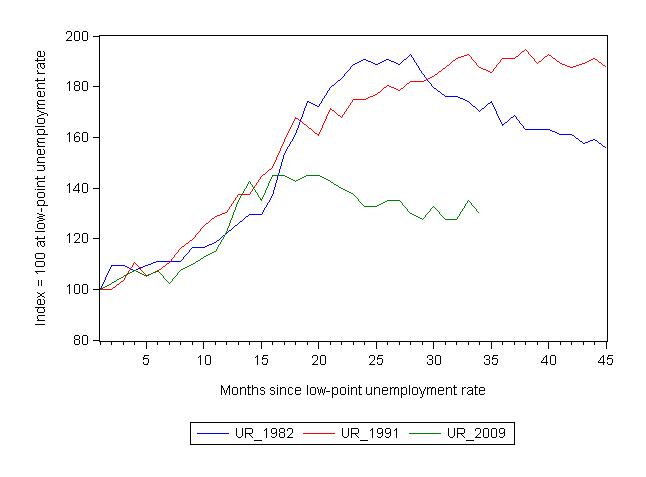
The following graph updates my 3-recessions graph which depicts how quickly the unemployment rose in Australia during each of the three major recessions in recent history: 1982, 1991 and 2009 (the latter to capture the 2008-2010 episode). The unemployment rate was indexed at 100 at its lowest rate before the recession in each case (June 1981; November 1989; February 2008, respectively) and then indexed to that base for each of the months as the recession unfolded.
I have plotted the 3 episodes for 45 months after the low-point unemployment rate was reached. For 1991, the end-point shown is the peak unemployment which was achieved some 38 months after the downturn began although the recovery was painfully slow.
For the other series, I have just charted the evolution for the 34-months in the current cycle (to November 2010 – the length of the period since February 2008). So it gives us a view of the way the 1982 recovery began too. While the 1982 recession was severe the economy and the labour market was recovering by the 26th month. The pace of recovery for the 1982 once it began was faster than the recovery in the current period.
It is significant that the current situation while significantly less severe than the previous recessions is dragging on given the lack of private spending growth.
The graph provides a graphical depiction of the speed at which the recession unfolded (which tells you something about each episode) and the length of time that the labour market deteriorated (expressed in terms of the unemployment rate).
From the start of the downturn to the 34-month point (to November 2010), the official unemployment rate has risen from a base index value of 100 to a value 130 – peaking at 145 after 21 months. At the same stage in 1991 the rise was 187.5 (and increasing) and in 1982 – 170 (and falling in spurts). The 1982 recession which was fairly severe ended at the 26-month point and the economy began a painful recovery after that month.
So while the current downturn has been a very different type of episode relative to our previous experiences the trend in unemployment is far from being downwards.
Note that these are index numbers and only tell us about the speed of decay rather than levels of unemployment. Clearly the 5.2 per cent at this stage of the downturn is lower that the unemployment rate was in the previous recessions at a comparable point in the cycle although we have to consider the broader measures of labour underutilisation (which include underemployment) before we draw any clear conclusions.
At the same period in the recovery (using quarterly data), the broad labour underutilisation rate (unemployment plus underemployment) had an index value of 156 in the 1982 recession (absolute value of 12.5 per cent); an index value of 184 in the 1991 recession (absolute value of 18 per cent); and an index value of 125 in the current period (absolute value of 12.4 per cent).
So while the level of unemployment is much lower now than in the 1982 recession (at a comparable stage), underemployment is now much higher and so the total labour underutilisation rates are similar.
Commentators who think of the 1982 recession as severe, rarely see it in these terms. Joblessness is probably worse than underemployment but both mean that labour is wasted and income earning opportunities are being foregone. For a worker with extensive nominal commitments, the loss of income when hours are rationed may be no less severe than the loss of hours involved in unemployment, if the threshold of solvency is breached.
Aggregate participation rate at record levels
The participation rate rose by 0.1 percentage points in November 2010 which attenuated the fall in unemployment due to the relatively good employment growth.
The labour force is a subset of the working-age population (those above 15 years old). The proportion of the working-age population that constitutes the labour force is called the labour force participation rate. So changes in the labour force can impact on the official unemployment rate and so movements in the latter need to be interpreted carefully. A rising unemployment rate may not indicate a recessing economy.
The labour force can expand as a result of general population growth and/or increases in the labour force participation rates.
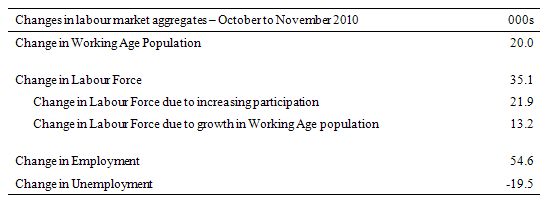
The following Table shows the breakdown in the changes to the main aggregates (Labour Force, Employment and Unemployment) and the impact of the rise in the participation rate.
In November 2010, employment rose by 54.6 thousand while the labour force rose by 35.1 thousand which meant that unemployment fell by 19.1 thousand. The impact of the rise in the participation rate on the rising labour force was equivalent to an extra 21.9 thousand workers looking for work. The remainder of the labour force expansion (13.2 thousand) was the result of growth in the working age population which is steady from month to month.
So this month the employment growth was able to provide enough jobs to absorb the population growth component of the growth in the labour force and the extra workers looking for work (rising the participation rate) and still make inroads into the unemployment pool.
If the participation rate had have remained at the October 2010 value then the unemployment rate would have dropped to 5 per cent.
Hours worked rose in November 2010 – just
In November 2010, hours worked has risen by 0.04 percent – in other words barely moved. This is surprising given the growth in full-time employment. I suggests that some downward adjustments in part-time hours is being made.
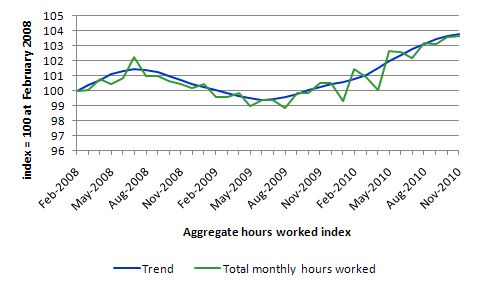
The following graph shows the trend and seasonally adjusted aggregate hours worked indexed to 100 at the peak in February 2008 (which was the low-point unemployment rate in the previous cycle).
The graph shows that the pace of the recovery is slow but positive.
Conclusion
This month’s Labour Force estimates are very good and if maintained will see unemployment and underemployment continue to fall. Sustained growth will provide income-earning opportunities to the most disadvantaged workers in our communities.
The problem is that there is still a lot of slack left to be mopped up and this month is only one month of many that will be required to really make a dent in the pools of idle labour.
The fact that employment growth was positive and biased towards full-time jobs, the participation rate rose and unemployment fell is the signs that we are looking for.
While the business economists have been hyping up the need for interest rate rises sooner rather than later, the economy is not yet close to full capacity and inflation has been moderate and falling in recent months.
The labour market data continues to tell me that real GDP growth will find available labour without significant pressures on costs.
The problem is that the policy-makers (central bank and treasury) who are driven by their erroneous NAIRU-depiction of the labour market will tighten spending (and hike rates) and cruel the growth trajectory and we will once again entrench persistently high labour underutilisation rates.
That is enough for today!
Meh, we’ll be in recession this time next year. Watch as our property bubble and the Chinese property bubble bursts.
Have to confess to being a bit suprised by the numbers. I have been expecting the housing sector to take a bath and the non-mining sector to contract significantly. I’m curious to know where the job growth is. Wonder how many of the jobs are in mining.
If it’s not the mining sector, who the heck is hiring? Can’t be in construction and it must be too early for census workers. Christmas elves, South Pole department?
I too am rather surprised at this result, given all the less than positive data out there at present.
Last quater GDP was barely above negative. Retail sales are very weak and the construction sector as a whole is in contraction. These are two of our biggest employers so as Andrew asked, who is hiring?
The ABS data http://www.abs.gov.au/AUSSTATS/abs@.nsf/allprimarymainfeatures/F756C48F25016833CA25753E00135FD9?opendocument shows though, that there have been three falls in seasonally adjusted unemployment this year, each one soon followed by a renewed rise. The seasonally adjusted figure for November may be down from last month, but the trend unemployment continued rising in November and has now done so for five months.
Bill – I know you are not a blog-on-demand service but I’m sure many here would be appreciative if you would do a follow up blog on this, since it seems to thoroughly confound expectations – an economy that recently recorded extremely weak growth, weak retail sales, slumping construction activity and a high rate of household savings maintained as government spending recedes, has nonetheless produced strong employment growth.
I’m sure I’m not the only person saying “What the……….!!!???”.
Dear Andrew and Lefty
We will have the detailed industry employment breakdowns next Thursday. I will comment in more detail about what I think is going on. Remember also that monthly data is highly variable because of the way the ABS compiles the statistics using population benchmarks.
More next week on this topic.
best wishes
bill
“The commentators are almost demanding that the RBA increase interest rates sooner rather than later. But that would be a very stupid thing to do. ”
I take it from that that there is, or will be, a measurable effect on something from raising interest rates.
The problem is that looking at the graphs there doesn’t appear to be much of a correlation between interest rates and demand for debt. Clearly I’m not understanding the mechanism at all. All I can see is a movement of a small amount of money from borrowers to savers and I don’t see how that helps anything, or changes much at the macro level. Certainly interest rate changes are generally a minuscule issue in business unless you’re leveraged right up to the eyeballs. I certainly can’t see how it would dampen hiring decisions for anything but the most marginal of propositions.
Is there a blog post anywhere that explains what interest rates changes are supposed to do from an MMT point of view and how that is supposed to control inflationary pressures? I can’t seem to find one on the site that addresses it head on. Interest rates appear to have taken on Shamen like properties in the media and are the magic wand of choice to make any economic problem go away.
The ‘mystery of interest rates’ and whether they do anything much appears to me to be one of MMT’s unanswered questions. There doesn’t appear to be a consensus on the mechanism of their effects, or even if there is an causation effect from using them.
Any light shed would be appreciated.
Anecdote: Well the growth in my local regional (as in rural) job market is static and nonexistent – normally this time of year there are heaps of christmas casual jobs available, this year there are none.
The fall in your state was apparently second only to WA Senexx.
Apparently so anyway.
Neil – I don’t think there is an answer, but this is a problem of the mainstream, not just MMT. Mosler generally refers to the oft-neglected income effects of a fall in interest rates but doesn’t try and quantify it; pretty sure that no analysis has been done to my knowledge on this point – and I’m not sure how it would work, frankly.
Separately, please can someone give me a steer on MMT’s view on the 1970s inflation which started before the oil price shock? MMT aims at full employment but at least in the US, postWW2 unemployment never managed to get below 4% before inflation took off.
I’m sure there’s a blog or paper on this.
Cheers
MMTP
Andrew Wilkins, Dec. 9,17:59:
Hey wait a minute there!! What Christmas elves at the South Pole? Santa and his elves live at the North Pole, in Canada! You can even write him there if you want and he’ll answer (it’s true, believe it or not). His address is: Santa Claus, North Pole, Canada HOHOHO.
Bill, you should filter this kind of scandalous nonsense out.
If you are upside down on your house, Santa ends up in the South Pole.
Good piece Prof. After last month I was waiting for a negative spin but I reckon you were pretty fair all round. Some stuff there that the official stats don’t really make obvious.
Arguments about interest rates have been going on a long time. The Radcliffe Report in the U.K. in the 1960s on interest rates, concluded that ‘there can be no reliance on interest rate policy as a major short-term stabiliser of demand’. That’s according to this source:
http://www.bankofengland.co.uk/publications/externalmpcpapers/extmpcpaper0018.pdf
I can put a negative spin on it (apologies Ray): there appears to be some suggestion that while a significant number of workers benefiited by gaining full-time jobs, other workers – probably mainly in the struggling retail sector – had their hours reduced.
So the downside is probably that the poorest workers got poorer.
Bill
I too am a novocastrian (new lambton) mature aged and no economist but I really enjoy reading your blog and the comments so many thanks to all contributors.
MMT Proselyte
Friday, December 10, 2010 at 0:02
“Separately, please can someone give me a steer on MMT’s view on the 1970s inflation which started before the oil price shock?”
I have wondered if inflation during the sixties and seventies had anything to do with the expansion of credit during that period
because until then, many people saved for big purchases and many of the local small businesses had interest free accounts.
My question is. Does interest paid on credit cards etc. increase inflation?
hi Kathy,
To put it simply (my neoclassical indoctrination tells me that) for inflation to occur, you need more money to chase around same amount of goods. So, say if we were to double everyone’s income today by printing lot’s of money, we’d be only leading the way to increases in prices, and hence no real change in wealth.
As for your question, interest paid on a credit card is nothing more than a debt (it is just a different name). In that sense, there is no real money creation.
However, access to cheap credit (or a credit boom as you wrote which might occur if interest rates are low) might have an indirect impact on inflation, but this would work through interest rates. and that’s a bit tricky (and long) to explain. Hope this helps.