Today (April 18, 2024), the Australian Bureau of Statistics released the latest - Labour Force,…
The US labour market is looking grim
With the US politicians are mired in a self-aggrandising dispute about who is best to manage a policy of fiscal austerity. Meanwhile, Rome burns around them. I know Americans like to talk about how free their nation is but while their elected representatives grossly indulge themselves in anti-intellectual disputes largely to console the demands of their corporate slave masters a growing number of US workers are being denied the freedom to earn a basic living. The latest data shows that the labour market has deteriorated again and the economic recovery is being undermined by those same elected representative. The US labour market is now looking very grim.
To warm up, the Australian Government’s current budget strategy was predicated on their claim that the economy was at or near full employment courtesy of the so-called “once-in-a-hundred years” mining boom and it was dangerously close to overheating (inflation was alleged to be about to spike up). As a result the fiscal stimulus that had been the sole reason why the economy did not enter recession as demand in the rest of the world collapsed was withdrawn. I am one of the few economists active in the public debate (media etc) that has been pointing out how far we are from full employment and without the previous fiscal support private spending (mining boom notwithstanding) is not strong enough to maintain an adequate growth rate (adequate = reducing the 12.5 per cent wasted labour – unemployment and underemployment).
What do we see now?
1. The labour market went backwards last month and has been declining for some months (with some erratic positive fluctuations interleaved).
2. Most other indicators – housing finance, retail sales, etc – have been either going backwards or static.
3. Today we had data that shows that the inflation rate is falling. Please see this ABC News Report (September 5, 2011) – Inflation falls as food, electronics get cheaper.
4. The latest measure of on-line Job Ads (a guide to labour demand) went backwards “for a second straight month”. Please see this ABC News Report (September 5, 2011) – Job ad fall ‘does not bode well’.
I note some commentators over the weekend still trying to beat up the full employment-overheating story. I won’t link to them – they are a disgrace. I will comment more about these trends on Wednesday when the June quarter National Accounts are released.
The point is that while Australia escaped the worst of the recession our stupid Government is more obsessed with locking refugees (and their children) up in so-called “off-shore” detention centres (read: in countries that have no human rights agreements in place) that it is in ensuring growth continues and the labour markets in regions where most of us live are robust.
But today I am commenting on the US labour market where things are much worse and the politicians even more distracted by their own incompetence than they here. Relevant US employment data came out last week and
On Thursday (September 1, 2011) – the US Bureau of Labor Statistics released the revised June quarter Productivity and Costs data. This was a precursor to the news that would come next day in the form of the Employment Situation data.
The Productivity and Costs data report said:
Nonfarm business sector labor productivity decreased at a 0.7 percent annual rate during the second quarter of 2011 … with output and hours worked rising 1.3 percent and 2.0 percent, respectively … From the second quarter of 2010 to the second quarter of 2011, output increased 2.4 percent while hours rose 1.6 percent, yielding an increase in productivity of 0.7 percent.
What does that tell us? It means that over the year growth was positive in both output and hours but in the last quarter there has been a rapid slowdown.
Here is a cut-down version of the BLS Table A, which documents the annual percentage changes – measured over the full year to June 2011 (Y to Y) and the annualised change between quarter one and two 2011 (Q to Q). The Q to Q figures tell you where the economy is at now (as closest as you will get with the lags in this type of data).
The data is for non-farm business – so strips out the volatility involved in farm production and focuses on the private sector.
While labour productivity growth was positive over the year to June 2011, the most recent quarter has seen that growth disappear (on an annualised basis).
You can also see that real output growth is slowing dramatically (on an annualised basis) and the decline in Real hourly compensation is accelerating.
You can think of the declining productivity in two ways.
On the one hand, reduced productivity signals a decline in growth in the material standard of living because it provides the “room” for nominal wages growth to occur without putting pressure on the price level (from a unit cost perspective). But then you think that real wages growth has been suppressed for many years in the US and (most nearly) everywhere else as national income has been redistributed to profits.
In this context, the decline in productivity growth will probably squeeze the “gap” between real wages growth and productivity growth and increase the pressure of the top-end-of-town to introduce even more draconian ways of suppressing real wages growth.
It also makes an export-driven growth strategy difficult to maintain without very serious domestic deflation (cutting workers’ wages).
On the other hand, US workers might be thankful that productivity is weak (declining) as real output growth declines because otherwise the employment would have probably fallen significantly. Productivity growth means that the same level of output can be produced with less workers and so for a given growth in real GDP, the commensurate employment growth rate is lower. This means that when employment growth is declining, the unemployment queues will not swell by as much if productivity growth also slows.
Anyway, the day after the productivity growth data came out the BLS released (September 2, 2011) their Employment Situation data for August 2011 which has sent the shivers up the spines of those who were hoping against hope.
The BLS report that:
Nonfarm payroll employment was unchanged (0) in August, and the unemployment rate held at 9.1 percent … Employment in most major industries changed little over the month … The number of unemployed persons, at 14.0 million, was essentially unchanged in August, and the unemployment rate held at 9.1 percent. The rate has shown little change since April … The number of persons employed part time for economic reasons (sometimes referred to as involuntary part-time workers) rose from 8.4 million to 8.8 million in August.
So zero change in employment – no net jobs added in August – but a move towards more underemployment – so the mix between jobs that were satisfying the preferences of the labour force and those that fell short of the desired hours of work shifted adversely.
In other words, the labour market deteriorated – rather than held its ground.
The consensus among media reports is that while this data might not be signalling an inevitable double-dip recession, it certainly demonstrates a very gloomy outlook for the US economy.
It puts more pressure on the US President in terms of his job creation announcements which will be delivered this coming Thursday.
The advance news on that announcement suggests that the US President will be signalling “specific cuts … to entitlement programs such as Medicare for the elderly, including lifting the eligibility age to 67 years from 65” among other austerity measures (Source).
You don’t cut public spending when private spending is flat and your economy fails to add 1 net job in the last month and other indicators are going backwards.
The direction for the US economy unaided at present is to head back into recession. New net spending is required.
The following Table is my recreation (summary) of the BLS Table A-15. Alternative measures of labor underutilization and it shows some of the measures of labour underutilisation that the BLS compiles from U3 (official unemployment rate) to the broader measures which include underemployment and hidden unemployment.
While the official unemployment rate is stuck, the broader measures are deteriorating.
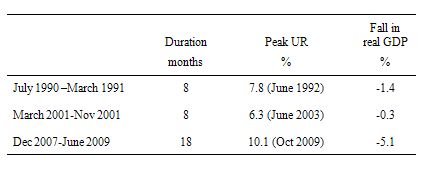
The following table shows the timing of US recessions since 1990 as derived from the NBER.
I restricted the analysis to the three recessions since 1990 because the BLS gross flows data (which I wanted to examine) is only available from that period (February 1990).
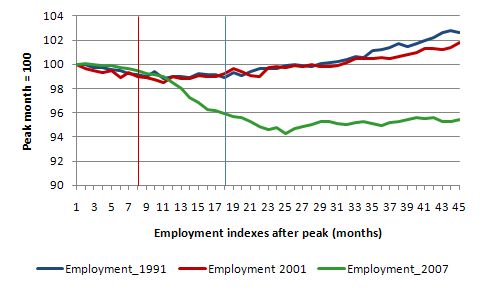
The following graph shows total US employment in each of the three recessions charted out to 45 months, which is the length of time since the most recent recession began to now. The red vertical line is the official end of the 1991 and 2001 episodes (when real GDP growth resumed) – that is, after 8 months; and the blue vertical line is the peak-to-trough of the most recent recession.
The series are indexed to 100 at the respective start of each recession. So they tell you about the direction and pace of employment growth in the initial decline and then as the real economy recovered.
The current period is indeed striking. Even after real GDP growth resumed in the US (after 18 months of decline and a staggering drop of 5.1 per cent), total employment continued to fall. The 1991 and 2001 recessions had a broadly similar impact on total employment which lagged the turning point in real GDP growth by a few months but then steadily moved upwards.
The sheer loss of employment in the US this time is staggering and the US labour market has been stagnant for months as the politicians fight about how much austerity should be imposed. The debate is about quantum not whether there should be austerity which is the appalling feature of modern US politics given this data is staring them in the faces.
On the face of it, the current recession is much worse for workers than the last two US recessions. How much worse? How much easier it is for an unemployed worker to gain employment now compared to a similar stage in the last 2 recessions? Are new entrants into the labour market more likely to gain employment this recession? What is the chance of a worker losing their job relative to previous recessions?
These sorts of questions can be answered by examining the Gross labour flows that are available from the US Bureau of Labor Statistics. I updated my databases this morning and now have data up to August 2011.
To fully understand the way gross flows are assembled and the transition probabilities calculated you might like to read these blogs – What can the gross flows tell us? and More calls for job creation – but then. For earlier US analysis see this blog – Jobs are needed in the US but that would require leadership
By way of summary, gross flows analysis allows us to trace flows of workers between different labour market states (employment; unemployment; and non-participation) between months. So we can see the size of the flows in and out of the labour force more easily and into the respective labour force states (employment and unemployment).
The various inflows and outflows between the labour force categories are expressed in terms of numbers of persons. But a useful alternative presentation is to compute transition probabilities, which are the probabilities that transitions (changes of state) occur. For example, what is the probability that a person who is unemployed now will enter employment next period.
So if a transition probability for the shift between employment to unemployment is 0.05, we say that a worker who is currently employed has a 5 per cent chance of becoming unemployed in the next month. If this probability fell to 0.01 then we would say that the labour market is improving (only a 1 per cent chance of making this transition).
The following table shows the schematic way in which gross flows data is arranged each month – sometimes called a Gross Flows Matrix. For example, the element EE tells you how many people who were in employment in the previous month remain in employment in the current month. Similarly the element EU tells you how many people who were in employment in the previous month are now unemployed in the current month. And so on. This allows you to trace all inflows and outflows from a given state during the month in question.
The transition probabilities are computed by dividing the flow element in the matrix by the initial state. For example, if you want the probability of a worker remaining unemployed between the two months you would divide the flow (U to U) by the initial stock of unemployment. If you wanted to compute the probability that a worker would make the transition from employment to unemployment you would divide the flow (EU) by the initial stock of employment. And so on.
So for the 3 Labour Force states we can compute 9 transition probabilities reflecting the inflows and outflows from each of the combinations.
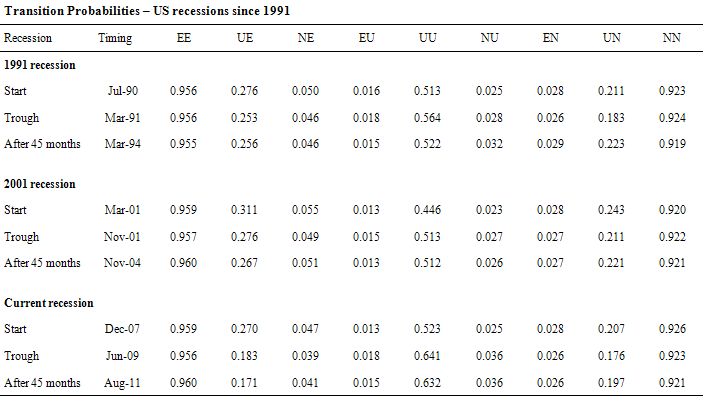
The following Table compares the three recessions in terms of the gross flow transition probabilities as at the start, the trough (when the NBER declared the recession over) and 45 months after the crisis began.
The 9 transition probabilities tell an interesting story.
First, for those in employment, the situation is broadly similar in the last two recessions – an initial decline in the likelihood of an employed worker keeping their job (EE) of the same order of magnitude and a similar probability after 45 months.
Second, the probability of an unemployed worker entering employment (UE) is very different this time around. The drop in this probability in 1991 and 2001 was nowhere near the order of magnitude that has been experienced this time around. The common feature is that even after the recovery officially began, UE continued to decline in the 2001 and 2007 recessions indicating that other adjustments were going on (other than unemployed taking jobs).
Third, an unemployed worker has a much higher likelihood of remaining in that state (UU) after 45 months this time compared to previous recessions.
Fourth, new entrants to the labour market are more likely to enter unemployment (NU) than employment (NE) at present which reduces the capacity of individuals to gain essential job experience (especially out of school).
Fifth, unemployed workers are more likely to exit the labour force (UN) than gain employment (UE) now.
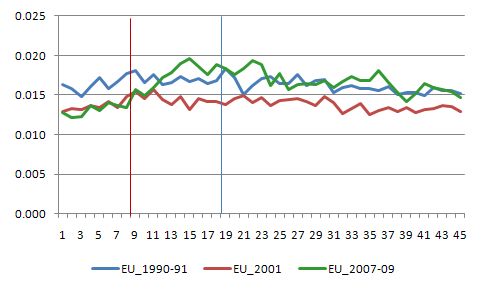
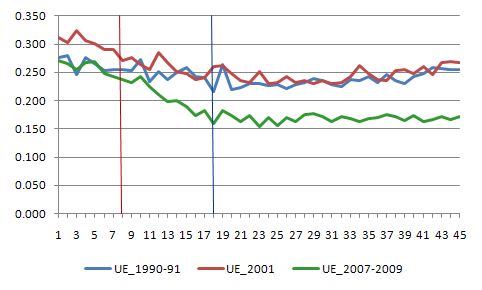
To gain a dynamic view of how each recession unfolded I plotted selected transition probabilities from the start of each of the recessions to the 45 month-point (so in effect – filling in the gaps in the previous Table).
Here is the graph for the EU transition – the probability that an employed person will become unemployed. The vertical lines (red and blue) are as before. The major observation is how quickly the current recession deteriorated as it became clear that fiscal stimulus was not going to be sufficient.
The next graph shows the UE transition probabilities – – the probability that an unemployed person will become employed. This is when you really see what happened in the current recession. The previous recessions behaved fairly similarly. For around 18 months the likelihood that an unemployed worker would gain employment in the next month fell and then as growth intensified the UE probability slowly rose again.
The experience this time around is very different. The decline has been more severe and for the last 27 months or so, the probability has been stuck at the trough level.
Conclusion
After the crisis began the US economy was saved from a major depression by the initial fiscal stimulus. There is no doubt about that. However, because the stimulus was not of a sufficient magnitude, the economy only slowly ground its way towards growth and the labour market was stuck in a very persistent recessed state with only slight improvements occurring.
A year ago, it looked like the recovery would be very drawn out. Now it looks like the recovery has failed and the economy (and the labour market) is deteriorating.
The implementation of (and/or calls for) fiscal austerity in many nations has undermined the nascent growth that was emerging on the back of the fiscal stimulus programs. Various governments have deliberately put their economies back into precarious states.
All the data tells me that cutting public spending in an environment as fragile as we are now seeing is likely to put the recovery into reverse. Voters around the world should take the next opportunity to clean these neo-liberals out of office forever.
That is enough for today!



Given real economy problems, financial economy problems and governance problems (denial of necessity for deficit spending in severe recession), it looks to me as if we are in for the Second Great Depression. When one adds in Limits to Growth, Climate Change, Mass Extinction and Resource Depletion one gets a truly concerning picture.
It seems to me that virtually all economists (orthodox and heterodox) are paying too little attention to Resource Depletion and the potential for that problem to greatly exacerbate existing problems in the economy. Only thermoeconomics or biophysical economics appears to be paying enough attention to the fact that the real economy depends on real resources (matter and energy). Resource depletion manifests as a continual decline in resource quality. As these declines multiply through the system, they reinforce each other in creating compounding problems for the real economy.
The EROEI (Energy Return On Energy Invested) factor declines as non-renewable energy sources are exploited. Thus, whereas an oil field might have once returned (in energy equivalent) 20 oil barrels for every 1 oil barrel expended in search and recovery, it might now only return 5 for 1. At the same time a mine which once provided a 5% pure ore grade may now only provide a .5% pure ore grade as the best grades are gone. So we have only one fourth of the net energy previously available and yet (even if ore recovery energy costs are linear) we need 10 times more energy than previously to extract the same amount of ore. Thus, this part of our economy is now operating under an energy handicap where it is now about 40 times harder to provide the recovered metal than previously. These numbers are well within the ball park of real factors operating right now for some oil fields and some mines.
At the same time, continued growth is making our task ever more difficult again. Consider the Erlich equation.
I = PCT where;
I = Total Environmental Impact,
P = Population,
C = per Capita Consumption, and
T = a Technology variable (Environmental Intensity of Production).
If we wanted to reduce our environmental impact by 50% by 2050 (compared to 2000), assuming population goes from 6 billion to 9 billion in the same period and the world manages an economic growth rate of between 2% and 3 % for that time (yeilding a per capita quadrupling of consumption over 50 years), then meeting this target would require environmental intensity of production to decline to decline by a factor of 12. In other words, efficency of unit production must increase by 90% according to John Foster, “The Sustainability Mirage”. It is not credible that we could ever achieve this.
As bad as the problem is that governments and their corporate bosses don’t understand Keynes and MMT, the real problem that the real economy (and all humans) will face from resource depletion is several orders of magnitude worse.
Surely Bill, it wasn’t just because the S wasn’t large enough that it more or less failed. Surely it was also because it wasn’t applied in the most apposite manner, that is, oriented toward job creation more or less directly. Directness isn’t always right, but in this case indirectness failed miserably for most.
Ikonoclast,
The mainstream is not sweating resource depletion, because they still worship at the high alter of efficient markets. They believe rising commodity prices will signal future shortages and drive investment in recycling or substitute resources.
I’m thinking the markets will react too little, too late and completely overshoot as usual. They will probably not anticipate running out of several critical commodities at the same time. Making substitution impossible.
Ikonoclast;
Regarding real resource depletion – I think it’s really all about energy. We won’t run out of matter. Above all else, we will need ammonia to fertilize our crops and feed people. We will need to make it in a different way, using stranded renewable sources like arctic wind and ocean thermal – and, possibly, if necessary, intentionally-stranded nuclear. But when the time comes, it will not be oil depletion that defeats us. Only a failure of ideas and imagination can do that.
Cheers
My wife got really lucky – she finally landed a permanent full time job. Her chances to do this in US, I am sure, were much smaller than 17%. She is African American, over 40, been unemployed since 2008.
Her nominal salary equals the nominal salary she earned in 1992 for similar job, but we are happy.
Dale;
Yes, in some ways I too regard energy as the ubiquitous master resource; the one resource you need to utilise all other resources. However, water also comes close to being needed in all cases to utilise all other resources. Saying we won’t run out of matter is really an immaterial point (forgive the pun). The point about matter is that it must be the right matter (element, compound or aggregation) in the right form to be useful to us. A man lost in the desert is surrounded by matter but not the right matter in the right form for survival.
When matter is useful to us in its (local) native form like pure water in a stream, it represents implicit embodied energy. Nature (as in natural forces) has done the energetic work to evaporate water from the ocean and carry it high over land to then precipitate and gather in a stream. Where we attempt to utilise sea water directly and turn it into potable water, we must expend energy, usually in industrial size installations. This is true for all naturally occuring materials we use. We must find them in a naturally useful state or expend further energy in processing to render them to a useful state. Thus while we nver run out of material we can run out of useful material, useful concentrations of material and so on.
In some senses I am derailing this thread now. However, to be concerned solely about MMT prescriptions for a growing capitalist economy whilst not addressing the limits to growth, is a little like being fascinated by the ripples in a rock pool when a tsunami is approaching. A correct understanding of fiat currency and the scope for deficit spending to avoid unemployment is important within the system. But when the entire real economic system is soon to be seriously disrupted by external shocks from the real natural world then this requires a radical widening of focus. I fail to see this development from both orthodox (neoclassical) and heterodox economists who are all still largely lost in the intracacies of their own speciality be it specious reasoning (like neoclassical economics) or valid empirical research and reasoning (like the work of Bill Mitchell and Steve Keen).
Those heterodox economists who are on the right track of modern political economy but are still essentially in the mode of the viewing the economy as a self-contained system (i.e. natural limits are left outside the research program) are soon likely to find their entire research program rendered obsolete. IMHO, Bill and Steve need to incorporate the emerging insights of biophysical economics into their research program.
And the U.S. retirement market is looking even grimmer?
Ikonoclast said: “Given real economy problems, financial economy problems and governance problems (denial of necessity for deficit spending in severe recession), it looks to me as if we are in for the Second Great Depression.”
Would anyone be willing to listen to the idea that most (with emphasis and not all) “Depression” conditions should actually be strived for?
The late William Vickrey (“We Need A Bigger Deficit”) on the 1991 recession:
“The administration is trying to bring the Titanic into harbor with a canoe paddle,
while Congress is arguing over whether to use an oar or a paddle, and the Perot’s and
budget balancers seem eager to lash the helm hard-a-starboard towards the iceberg. Some
of the argument seems to be over which foot is the better one to shoot ourselves in. We
have the resources in terms of idle manpower and idle plants to do so much, while the
preachers of austerity, most of whom are in little danger of themselves suffering any
serious consequences, keep telling us to tighten our belts and refrain from using the
resources that lie idle all around us.”
🙁
@ Ikonoclast
Growth of economy in services while holding the industrial base near steady can strongly limit the growth of Impact. Switching from non-organic materials to organic and recycling disposed stuff can also limit the needs of mining materials. These are examples.
To get any desired material configuration, one needs three “factors”: free energy, materials and information. Materials can always be obtained from pre-existing materials, energy and information. There are no in principle limits for the generation of information by human brains. Free energy is a different case as it must be tapped from a natural source, yet one does not know where the actual limits are for solar or terrestrial sources, including nuclear fusion. Therefore the key factor – and the potentially unlimited – is information.
Information generation is potentially unlimited but humans self-impose limits on it by greed and sticking to ignorance. We should be diminishing Impact or tapping energy in a much greater scale of activity, yet the behavioral absurdities of politics and finance wrt to employment and money block development. So, in a sense, dissemination, acceptance and putting at work of MMT constitute a key step for a technological civilization as the present to become viable in the long run.
The reason resource depletion is not considered is exactly the same reason Keynes and MMT are not understood: money. Nobody gets rich today by leaving resources in the ground until tomorrow.
Ikonoclast, I think part of the problem is that economics fundamentally has nothing to say about absolute scarcity. In fact, the neoclassical school actively denies its existence. To them, all scarcity is relative, and substitutes can always be found at some cost. Of course, we know that absolute scarcity is a fundamental factor of biological existence.
The balance sheets considered do not include nature’s balance sheet; many of our assets are created with a corresponding ‘off-balance sheet’ liability that we have been able to ignore, or foist on others, for a long time, and so we see the “externalisation of costs” (a euphemism for plunder and exploitation) that leads, among other things, to C02 rising to 392 ppm and counting.