Today (March 6, 2024), the Australian Bureau of Statistics released the latest - Australian National…
Australian National Accounts – good result but be wary
As winter arrived (June 1), the March quarter Australian National Accounts came out and showed that the Australian economy contracted by a staggering 1.2 per cent. With the seasons passing into spring and the warm days are back, the Australian Bureau of Statistics released the National Accounts data for the June 2011 quarter which not only revised last quarter’s result to -0.9 per cent but also showed than in the subsequent three months of this year the Australian economy grew at a robust 1.2 per cent. That means in the last 12 months the economy has grown by 1.4 per cent (a very poor result) but in the second quarter accelerated on the back on household consumption and a strange pickup in inventories. But if the growth continues then I expect some reductions in the unemployment rate by the end of the year – which is a good prospect. The irony is that the external sector continues to drag the growth rate down despite our so-called “once-in-a-hundred-years” mining boom. There are mixed signals in the economy at present though. Remember the National Accounts are a rear-vision view of what was happening in April, May and June. Since then the global economy has gone apoplectic and China is slowing. The most recent Australian data does not accord with the strength indicated in today’s (rear-vision) version of events.
The news yesterday in the form of the ABS data release – Balance of Payments and International Investment Position, Australia – for the June quarter 2011 – was that:
– The current account deficit, seasonally adjusted, fell $3,696m (33%) to $7,419m in the June quarter 2011. The surplus on the balance of goods and services rose $2,852m (104%) to $5,599m. The primary income deficit fell $870m (7%) to $12,499m.
– In seasonally adjusted chain volume terms, the deficit on goods and services rose $1,643m (19%) from $8,581m in the March quarter 2011 to $10,224m in the June quarter 2011. This is expected to detract 0.5 percentage points from growth in the June quarter 2011 volume measure of GDP.
What does that mean? It means that the external sector is not adding to real GDP growth in Australia despite the so-called “once-in-a-hundred-years” mining boom. While the income from net exports of goods and services is rising (along with the terms of trade) so is the net income flowing abroad (net profits repatriation) and the latter outstrips the former by some margin.
In other words, we are exporting our minerals like crazy but sending more of our income to foreign owners of our capital and debt. Net result: the external sector is a contractionary part of our economy.
Further, the August – Australian Performance of Construction Index (PCI) – reported the following:
The downturn in the national construction industry deepened in August 2011 driven by a further fall in activity and a sharp reduction in new orders … The seasonally adjusted … Australian PCI … declined by 4.0 points to 32.1. This marked the 15th consecutive month that the index has been below the critical 50 points level separating expansion from contraction. Moreover, it represented the weakest reading on the overall state of the construction industry in almost 2 1/2 years … Businesses attributed the on-going decline inactivity to a lack of incoming work and an associated shortage of new tender opportunities.
I constructed the following graphs to show you the recent history. The graphs are small so that I could juxtapose them horizontally but they show the period August 2009 to August 2011. The peak in the bars is around April-May 2010.
An interesting feature of the recent downturn was that unlike previous recessions, the Australian construction industry continued to grow and that helped keep the rise in unemployment down.
The reason is simple – the federal fiscal stimulus targetted public infrastructure construction (mainly providing new buildings in the public schooling system) – and although the conservatives vilified the program as a waste and a violation of choice – the evidence is indisputable – it saved thousands of jobs and kept construction going.
Once that program petered out and the Government reasserted their obsession about running budget surpluses – the withdrawal of the fiscal stimulus which started mid-2010 – led to a rapid decline in new orders and construction activity which also saw employment demand decline in that sector.
The graphs tell the story better than I can.
The decline in that sector is directly and unambiguously being caused by the failure of private sector demand to replace the fiscal stimulus. This is a very clear demonstration of how aggregate demand deficiencies impact on overall output. It was also obvious that the fiscal stimulus was propping up local industry despite the claim from the mining sector that they were responsible for the fact that Australia did not go into a deep recession with the rest of the world.
While the conservatives like to emphasise supply constraints and most recently they are once again mounting an attack on workers’ wages and conditions there is no supply-side story one can tell to explain the trends in the graphs.
June National Accounts story
The main features of today’s National Accounts release for the June 2011 quarter were (seasonally adjusted):
- Real GDP increased by 1.2 per cent (after falling by 0.9 per cent in the March quarter.
- The main positive contributors to expenditure on GDP were Inventories (0.8 percentage points) and Final consumption expenditure (0.7 percentage points)
- The main main negative factors impacting on spending were net exports (-0.5 percentage points down from -2.4 percentage points in the March 2011 quarter).
- Real gross domestic income rose by 2.6 per cent on the back of a 5.4 per cent rise in the Terms of Trade (courtesy of China).
It is clear that external demand (as indicated by our booming terms of trade) remains robust and that export volumes are being negatively impacted as a result of the floods earlier in the year (especially coal). But even before the floods, net exports were a negative influence, record terms of trade notwithstanding.
Nobody should get carried away with a single quarter’s data. As we saw today, the very severe contraction that was indicated when the March quarter accounts came out has now been moderated (from -1.2 per cent to -0.9 per cent). So things were not quite as bad as we thought.
Similarly, it is likely that today’s data will be revised (I suspect downwards a bit). But a 1.2 per cent growth spurt is still a solid result.
But my overall reading of the many strands of information and data that is currently available is that just as the first quarter’s contraction was always going to be a one-off event, the strong growth in the second quarter is also not likely to be sustained at that rate. There are many indications that the Australian economy is still relatively weak.
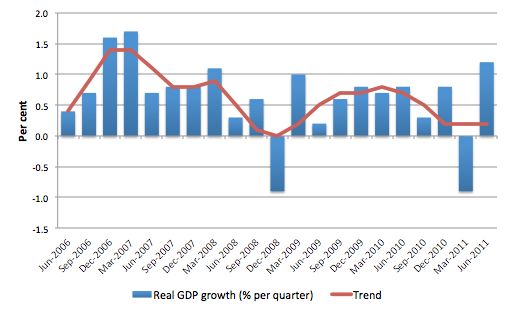
The following graph shows the quarterly percentage growth in real GDP from June 2006 to March 2011 (blue columns) and the ABS trend series (red line) superimposed. Trend real GDP growth started to level off in September 2009, dropped rapidly then levelled off over the last year.
The average for both trend and actual real GDP quarterly growth over the last year is 0.4 per cent. So today’s figures indicate that over the last year the Australian economy grew by 1.4 per cent, which is a poor result. However, if the bounce-back in the June quarter is indicative of what is ahead then the economy will get back onto the longer-term trend growth which will be a good result.
So what components of expenditure added to and subtracted from real GDP growth in the June 2011 quarter?
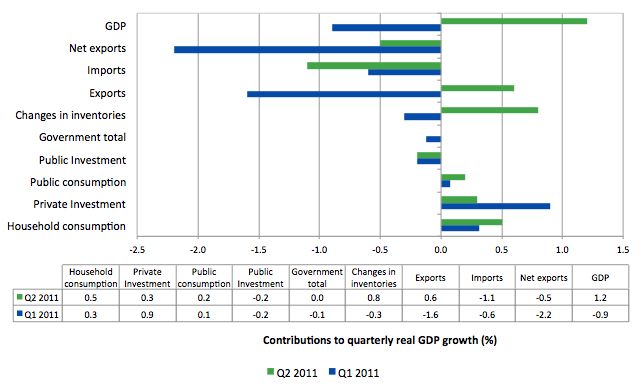
The following bar graph shows the contributions to real GDP growth (in percentage points) for the main expenditure categories. It compares the first quarter contributions (blue bars) with the second quarter (green bars). The first quarter results are the revised results.
We see that even though exports made a comeback in the June quarter (as the damage of the floods abated), imports also rose sharply which is a combination of increased consumer items and firms investing.
However, despite the claims that businesses are about to unleash an investment boom, the direction was towards more subdued investment in the second quarter (relative to the March quarter). In the March 2011 quarter, private investment was the strongest positive contributor to growth which was a major reversal on the previous three quarters (of 2010). The expectation is that private investment will continue to be strong. Time will tell.
The overall contribution of the government sector is zero. So what it added by way of general government consumption it subtracted through the winding back of the capital works program. Overall, the public contribution is falling as the government unwinds its fiscal stimulus in pursuit of a budget surplus. If the Federal government continues down this path (and the May Budget suggested it intends to accelerate the austerity drive) then the economy will be burdened by fiscal drag.
The stand-out contributions are the strong household consumption result and the major reversal of inventories. Inventories in the December 2010 quarter also added 0.8 percentage points and are subject to major quarterly reversals. My suspicion is that the inventory cycle will moderate its contribution next quarter.

Is the growth spurt temporary?
Last quarter I asked the question “Is the contraction temporary?” and concluded that much of the negative growth impact was the direct result of the severe floods and cyclone that hit Northern Australia in the early part of this year. In that context I concluded the contraction was not a true reflection of the state of the economy.
Once I netted out the “natural disaster” effect I estimated that if all the other contributions to real GDP growth were unchanged (a very simplistic assumption) then annual real GDP growth would have been 2.1 per cent rather than 1 per cent.
So is this growth spurt temporary? One of the likely candidates for reversal will be the inventory accumulation. In the March quarter they were $A1555 million – 0.5 per cent of Domestic Final Demand (down from $A2604 million in the December 2010 quarter). They rose to $A4227 million in the June quarter (or 1.3 per cent of Domestic Final Demand).
The average inventory investment since September 1974 has been 0.3 per cent of Domestic Final Demand and there are regular fluctuations up and down around that around. There is no upward trend in that proportion.
I thought this observation from commentator Micheal Pascoe (September 7, 2011) – Beware deficit slashing – and statistics – reflected my thoughts on inventories:
Even a key factor in the June quarter GDP rebound – inventory growth – can be a double-edged sword depending on your view of what has been happening since June 30, either wholesalers rebuilding stock levels with confidence about demand or wholesalers setting themselves up for trouble by being over-optimistic about demand.
My judgement is that the contribution of inventories next period will be much lower if not negative. The most recent data suggests that retailers and wholesalers are not doing very well and so the inventories may well reflect mistakes in demand forecasts. Just yesterday, it was announced that one of Australia’s largest multi-brand car dealerships has gone broke because they are carrying to much unsold stock in the face of a declining market.
The other side of the picture is that real net national disposable income rose by 3.7 per cent over the last 12 months as the record terms of trade boosted our export earnings. While the external sector is still contributing negatively to growth this is not a bad thing because firms and households are able to enjoy higher material standards of living through the extra imports they can purchase. I know there are two ways of looking at bingeing on imports but I like having access to cheaper foreign-made goods courtesy of our high exchange rate and rising household incomes.
Household saving ratio
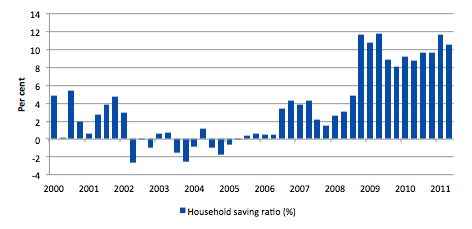
The following graph shows the household saving ratio (% of disposable income) from 2000 to the current period. The household sector is now behaving very differently since the GFC rendered its balance sheet very precarious. Prior to the crisis, households maintained very robust spending (including housing) by accumulating record levels of debt. As the crisis hit, it was only because the central bank reduced interest rates quickly, that there were not mass bankruptcies.
The household saving ratio was at 10.5 per cent of disposable household income in the June quarter down from 11.7 per cent in the March quarter. It has averaged 10.1 per cent since the crisis.
For the economy to continue to grow strongly while households are maintaining rising levels of saving (from disposable income), public spending, private investment and/or net exports has to increase. We will not be able to rely on the boost from inventories each quarter.
Clearly the contribution from net exports remains negative (as explained above) which means we are relying on private investment spending and that is flukey at best.
I still maintain that there is scope for expansionary fiscal contribution, to support the household saving effort and maintain trend growth.
The continuation of budget deficits, however, should not be seen as some weakness or profligacy. During the long period of post WW2 growth, the federal government ran continuous deficits as a response to the saving desires of the private domestic sector.
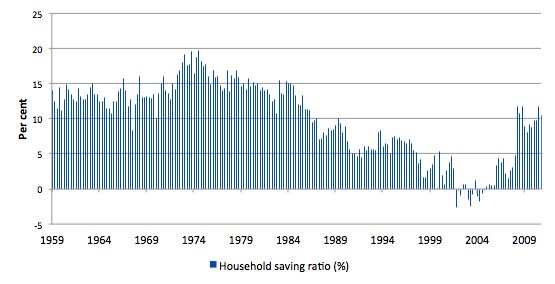
You get a better picture of how unusual the credit-binge period was by looking at the household saving ratio over a longer period. The following graph starts at the time National Accounts data began (September 1959). This graph helps readers understand the comments I make about “typical” and “atypical” behaviour among the macroeconomic aggregates.
I have often said that the period in the late 1990s up until the crisis when the government was running surpluses and the household sector was accumulating record levels of debt which allowed it to indulge in a consumption binge were atypical. The credit-binge underpinned relatively strong growth, which in turn allowed the government to run the surpluses (revenue growth was so strong) over this period.
But the behaviour was very odd by historical standards. The problem now is that the conservatives (who are really neo-liberals rather than traditional Tories) have reconstructed history as if the budget surpluses are normal.
The following graph shows how atypical the period of the budget surpluses were (from 1996 to 2007). As households increasingly went into the red and were dis-saving the household saving ratio became negative. As a result of the risk now carried by the record levels of indebtedness and the uncertain nature of the economy at present (threat of unemployment is still high), households are resuming their historically typical behaviour and consumption is more subdued as a result.
Conclusion
Once again, today’s result is difficult to be definitive about. Clearly, it is a strong result on the surface. But given the strong contribution of inventory accumulation one has to think that next quarter will not sustain this result – especially given some contemporary data.
The data also conflicts with retail sales data – given how strong private household consumption was in the June quarter. Household consumption measures what is being purchased on a recurrent basis and so the retail sales data would appear to be grossly underestimating what is actually happening. I suspect the National Accounts measure will be revised downwards next quarter.
The portents with respect to private investment are relatively good bar domestic housing (which fell by 0.1 per cent in the June quarter). However overall machinery and equipment was strong (4.9 per cent) and total private gross fixed capital formation increased by 1.3 per cent.
For the overall growth to be maintained, total private gross fixed capital formation will have to pump up over the next 12 months.
That is enough for today!


Bill, what do you make of the analysis quoted here:
http://www.macrobusiness.com.au/2011/08/how-the-mining-boom-is-shared-or-not/ ?
It doesn’t seem consistent with your view that the external sector is a contractionary part of our economy.
Cheers, Ian
While the income from net exports of goods and services is rising (along with the terms of trade) so is the net income flowing abroad (net profits repatriation) and the latter outstrips the former by some margin.
Bill does the repatriation of profits include interest paid on foreign borrowings?
thanks
Dear Ian Lucas (at 2011/09/07 at 16:32)
The article is not inconsistent. Clearly the terms of trade are providing us with growing real incomes but the incomes were are earning via exports are going into increased imports (which are good) and increased net income going overseas (profit repatriation).
The fact is clear – the current account is in deficit and that means the external sector overall is a making a negative contribution to real GDP growth.
best wishes
bill
Dear Different Max (at 2011/09/07 at 16:58)
Yes it does.
best wishes
bill
Ian. This summary quote from that article seems contradictory
“So, in some very significant way, the mining boom is simply a transfer of wealth from one area of the economy to another, ie miners. It’s not, strictly speaking, a generalised boom at all.”
The trade deficit is lower because of resource extraction but it’s outweighed by the profit extraction as more foreigners have investments in Australia than vice versa.
The impact on wages seems quite low, so the rationale for tightening monetary AND fiscal policy is not there.
Hope that helps?
Hi Bill,
I hope things are well with you outside the macroeconomic field. I was wondering if you or anyone else here can help me. I was wondering whether our “commodities”, our “mineral wealth” are currently being sold in USD or AUD. I know at one point it was consistently USD and I wonder if that changes any analyses in any meaningful way if it is USD still.
At this time I think AUD would make more sense as I imagine that is what driving the dollar besides the “carry trade” (which I don’t fully comprehend the meaning of)
Kind Regards,
Senexx
I for one was very surprised to read the GDP figures this afternoon. It paints a picture of an economy in fairly robust health.
I have been following a stream of economic news that has been largely so-so to outright weak – and some of it came from the ABS’s own figures over the period in question. The notion that household consumption was strong appears to fly in the face of the data I have been following and what I have been observing anecdotally. I seem to recall jobs growth over that period being quite weak, along with retail, manufacturing, housing, broad credit growth etc.
The headline figure does not seem to accord with reality.
Thanks Will and Bill,
Yep, I get it now (I think).
I can see that if there is a net external deficit, then there isn’t a case for tightening policy to “make room for miners”.
Another question (pardon if it is dumb, I ain’t no economist) – is the mining boom holding up the exchange rate?
Or does the fact that there is a net external deficit mean that the external sector overall is not putting net upward pressure on the exchange rate? That is, if a lower trade deficit puts upward pressure on our currency does higher repatriation of profits put downward pressure on our currency?
ie is it really true that the mining boom is damaging the rest of the economy via “Dutch disease”?
Cheers,
Ian
I’m no economist either Ian, but I get the feeling that mining is only part of it. I hear arguments that the carry trade is largely to blame, as hot money floods here to earn higher returns owing to our much higher interest rates (which are actually fairly low by historical standards but a lot higher than most of the rest of the developed world, given that their economies collapsed in the GFC while Australia’s did not)
Basically foreigners are building building mining infrastructure and renting land in return for unlimited access to minerals and fat profits. RTZ, Chevron…… Even BHP are mostly foreign owned right?
Makes Australia look like an exploited third world country. Except some third world countries are smart enough to nationalize their resource industries.
The Chinese must be laughing their socks off as they refuse to export rare earth metals and take advantage of the mugs who open up their own markets. How many mines in China are Australians operating?
Interesting stuff. Try asking small business owners if it makes them feel any better. The problem with all these numbers is that it leaves out the human factor. Economies don’t operate in isolation of human beings. Sadly the number crunchers seem to have forgotten this and we are all supposed to be over the moon when we see the economy grew at x% last quarter. My income has contracted by 40% over the past year and I would suggest as a small business person this is not all that unusual in the current “booming” WA economy. Next we’ll be hearing about the need to put interest rates up to slow the economy.
It’s a joke!
Does anybody know how and how much iron ore production is taxed in Australia?
Dear MamMotTh (at 2011/09/08 at 7:19)
The mining corporations pay standard corporate taxes for income earned in Australia and also pay mining royalties to the State governments. In general, with all the concessions they receive from governments they are grossly under-taxed given the damage they do to the environment and local communities.
best wishes
bill
“The average inventory investment since September 1974 has been 0.3 per cent of Domestic Final Demand and there are regular fluctuations up and down around that around”
Is there any simple explanation as to why the average contribution of inventory to growth has been 0.3% since 1974?