Today (March 6, 2024), the Australian Bureau of Statistics released the latest - Australian National…
Australian National Accounts – below trend growth continues
As Summer struggles to makes it appearance on the East Coast (coldest start for something like 40 odd years) the ABS released the Australian National Accounts – for the September 2011 quarter came out today and showed that the Australian economy grew by 1 per cent in the quarter down from the strong 1.2 per cent in June. In real terms, the economy grew 2.5 per cent over the last 12 months which is a good result considering that the March quarter contraction of 0.9 per cent. There are several competing forces contributing to this result. The growth is being driven by private capital formation and household consumption but being dragged down by net exports, harsh government austerity and the run down in inventories, the latter suggesting firms are losing confidence in the immediate outlook. If the private investment boom continues then growth for the foreseeable future should be maintained and approach trend. I would note that the recent (pre-crisis) trend growth was insufficient to mop up both the residual unemployment and the rising underemployment. The case for continued government support for higher growth remains especially with inflation now falling.
We should always note that the National Accounts data provide a rear-vision view of what was happening in July, August, and September and is only a proximate guide to what is happening now. Since then the global economy has probably contracted – with the Euro crisis now back in the spotlight and the impacts of that crisis starting to show in Asia. China is now slowing and that will be the most likely conduit for the Euro crisis to impact negatively on our economy
The main features of today’s National Accounts release for the June 2011 quarter were (seasonally adjusted):
- Real GDP increased by 1 per cent (falling by 1.2 per cent in the June quarter.
- The main positive contributors to expenditure on GDP were Private gross fixed capital formation (2.1 percentage points) and Final consumption expenditure (steady at 0.7 percentage points)
- The main main negative factors impacting on spending were net exports – (-0.6 percentage points worsening from the -0.5 percentage points in the June quarter), change in Inventories (-0.7 percentage points – a major reversal from the positive 0.8 percentage points contribution in the June quarter), and Public gross fixed capital formation (detracting 0.4 percentage points).
- Real gross domestic income rose by 1.6 per cent (down from 2.6 per cent in the June quarter) on the back of a 2.7 per cent rise in the Terms of Trade (down from 5.4 per cent rise in the June quarter).
- Sectoral contributions were dominated by Construction (0.4 percentage points) and Mining (0.3 percentage points).
It is clear that external demand (as indicated by our booming terms of trade) remains robust and that export volumes are strong (and are largely recovering from the poor performance in earlier in the year as a result of the floods).
When you consider that the 2.5 per cent (seasonally adjusted) annual growth rate carried one negative quarter (March 2011) the performance of the Australian economy stands out from other advanced nations.
My overall reading of the many strands of information and data that is currently available is that the economy is maintaining strong growth but it is slowing from what was implied in the June quarter.
How the intensifying global crisis (particularly Europe) and the obsessive push for the budget surplus is impacting in the current period remains to be seen. But overall this is a good result.
Yesterday (December 6, 2011) , the ABS published the September quarter 2011 data for Government Finance Statistics which showed how quickly the fiscal contraction is now occurring. It also shows that as the economy is growing more slowly than the Government estimated in its May Budget, the shortfall in expected taxation revenue is outstripping the decline in spending and so the budget deficit is rising via the automatic stabilisers.
The data shows (in seasonally adjusted terms) that:
- Real total general government final consumption expenditure decreased by 1.2 per cent compared with June quarter 2011.
- Real general government gross fixed capital formation decreased by 7.3 per cent.
Total revenue fell by 19 per cent in the September quarter relative to the June quarter 2011.
The contraction in the government contribution to real growth is even surprising the private bank economists. The Sydney Morning Herald (December 6, 2011) carried the story – Slash in spending builds to weigh on GDP quoted one bank economist as saying:
The government spending figures were very soft and it has to be a consideration for the central bank that a sector that accounts for a fifth of the economy is going backwards.
The article reports that “government spending fell a steep 2.5 per cent in the third quarter” and:
… was much weaker than anyone expected and implied a drag on economic growth of around 0.6 percentage points of gross domestic product (GDP), the biggest subtraction since 1999.
As I reported yesterday, the Balance of Payments data also showed yesterday that the external sector would drain demand by 0.6 percentage points in the September quarter.
Add to that the news on Monday (December 5, 2011) from the ABS – Business Indicators – (September quarter 2011) which showed that real inventory inventory had fallen by 1.1 per cent in the quarter (seasonally adjusted).
In this sort of climate (deep uncertainty and pessimism) this sort of movement is usually interpreted as a drop in business confidence.
So let’s add up all the known “hits on growth” in the September quarter before we even get to consumption and private capital formation.
1. Government austerity – draining growth by 0.6 percentage points.
2. External sector – draining growth by 0.6 percentage points.
3. Inventory cycle – draining growth by 0.8 percentage points.
Thus, these three components were draining growth by 2.0 percentage points in the September quarter 2011. That is a lot of ground for private consumption and business investment to make up. Private consumption growth has been a steady contributor at around 0.7 percentage points over the last two quarters.
The real growth engine now is Private gross capital formation which is associated with the commodities boom – new mining infrastructure, railways, ports and the like are contributing a very healthy 2.1 percentage points to real GDP growth. While that lasts the economy will continue to grow and the ABS data signalling expected investment suggests the support will continue for some time yet.
Does this give the government room to contract as quickly as is now happening? I don’t think so.
Even with the negative growth quarter (March 2011) taken out of the equation (that was due to floods and cyclones), the Australian economy is still not growing fast enough to absorb the huge pool of underutilised labour (currently around 12.5 per cent of the available labour force). The ABS trend growth estimate is at 3.2 per cent (annualised). The average annual growth rate in the five years leading up to the crisis (up to December 2007) was 3.6 per cent.
The idle labour (particularly the staggeringly high youth unemployment and underemployment) provides the scope for government to pursue further non-inflationary growth and that should be a priority. There is no case for a budget surplus at present or into 2012 while labour underutilisation remains that high.
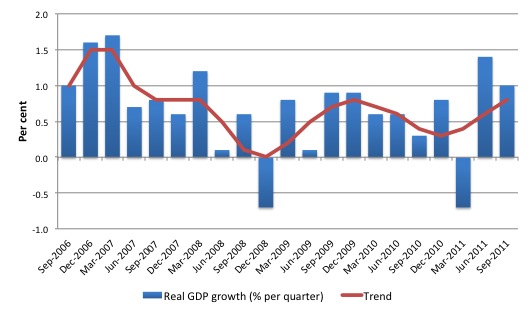
The following graph shows the quarterly percentage growth in real GDP from September 2006 to September 2011 (blue columns) and the ABS trend series (red line) superimposed. After the decline in trend growth was arrested by the fiscal stimulus in 2008-09 the decline in government support saw the dip in trend growth in 2010. Now the private investment is driving the new rise in trend growth.
The average for both trend and actual real GDP quarterly growth over the last year is 0.6 per cent. Today’s data indicate that over the last year the Australian economy grew by 2.5 per cent. However, as noted even if we discount the poor March quarter and assume that the ABS trend growth estimate continues the economy will still be below the pre-crisis trend.
What components of expenditure added to and subtracted from real GDP growth in the September 2011 quarter?
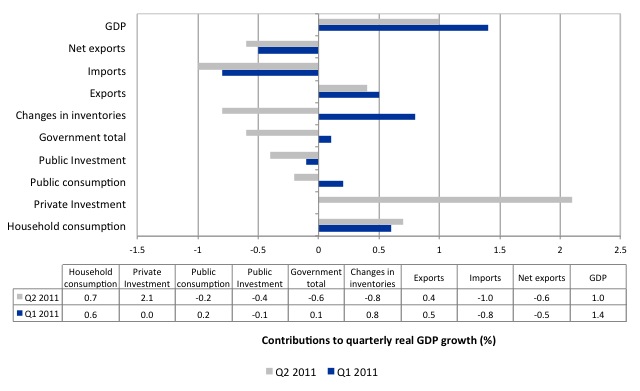
The following bar graph shows the contributions to real GDP growth (in percentage points) for the main expenditure categories. It compares the second quarter contributions (grey bars) with the third quarter (blue bars).
We see that exports reduced their contribution relative to the June quarter while imports also rose sharply which is a combination of increased consumer items and firms investing.
It also seems that the long-awaited surge in private capital formation is now started to show up with a extremely strong contribution from firm investment.
The overall contribution of the government sector has moved from 0.1 percentage points to minus 0.6 percentage points – a sharp reversal consistent with the Government’s plans to pursue a surplus by next year.
Public infrastructure investment has reduced its contribution substantially.
Household consumption has increased its contribution marginally (to 0.7 percentage points).
The worrying news from the data was the reversal in inventory investment. There are various ways of interpreting this shift from a positive 0.8 percentage point contribution to a negative 0.8 percentage point contribution.
On the one hand, firms may have over-invested in the second quarter and the September quarter result merely depicts a correction back to more desired levels of industries. The other way of thinking about it that it signals a reduced confidence among firms of the short-term outlook and they do not want to commit to new production plans and be stuck with unsold inventories.
Given the movement in inventories over the last several quarters, the latter interpretation carries more weight in my view.
Household saving ratio
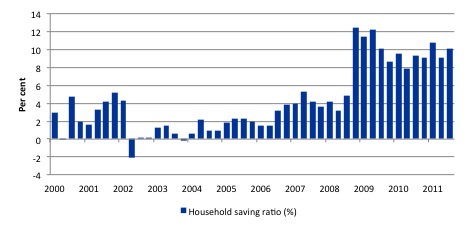
The following graph shows the household saving ratio (% of disposable income) from 2000 to the current period. The household sector is now behaving very differently since the GFC rendered its balance sheet very precarious. Prior to the crisis, households maintained very robust spending (including housing) by accumulating record levels of debt. As the crisis hit, it was only because the central bank reduced interest rates quickly, that there were not mass bankruptcies.
The household saving ratio was at 10.1 per cent of disposable household income in the September quarter (up from 9.1 per cent in the June quarter). It has averaged 10 per cent since the crisis.
For the economy to continue to grow strongly while households are maintaining rising levels of saving (from disposable income), public spending, private investment and/or net exports has to increase.
Clearly the contribution from net exports remains negative (as explained above) and government contribution to growth is now negative. which means we are relying on private investment spending to support the household deleveraging effort.
Given that the household sector is now carrying record levels of debt as a result of the credit binge leading up to the crisis, investment will have to be sustained for some years to allow the households to restructure their balance sheets.
As noted above, I still maintain that there is scope for a positive fiscal contribution given that private investment is not yet pushing the economy against the inflation barrier and this would hasten the household debt correction.
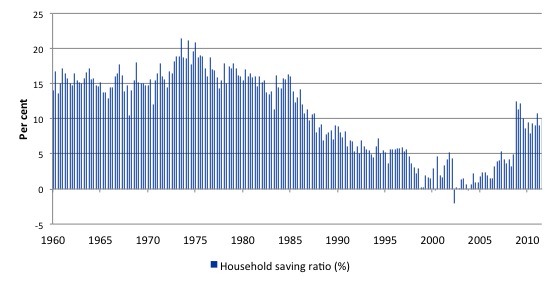
You get a better picture of how unusual the credit-binge period was by looking at the household saving ratio over a longer period. The following graph starts at the time National Accounts data began (September 1959). This graph helps readers understand the comments I make about “typical” and “atypical” behaviour among the macroeconomic aggregates.
I have often said that the period in the late 1990s up until the crisis when the government was running surpluses and the household sector was accumulating record levels of debt which allowed it to indulge in a consumption binge were atypical. The credit-binge underpinned relatively strong growth, which in turn allowed the government to run the surpluses (revenue growth was so strong) over this period.
But the behaviour was very odd by historical standards. The problem now is that the conservatives (who are really neo-liberals rather than traditional Tories) have reconstructed history as if the budget surpluses are normal.
The following graph shows how atypical the period of the budget surpluses were (from 1996 to 2007). As households increasingly went into the red and were dis-saving the household saving ratio became negative. As a result of the risk now carried by the record levels of indebtedness and the uncertain nature of the economy at present (threat of unemployment is still high), households are resuming their historically typical behaviour and consumption is more subdued as a result.
A household saving ratio of 10 per cent is thus likely to continue indefinitely. The surge in investment will not persist indefinitely. Taken together, there will be a need for continuous budget deficits in the coming years to support growth and private saving.
The juxtaposition is what I would call typical and runs against the austerity hype that is driving public policy at present.
Conclusion
The trend in the Australian economy is becoming more defined after being upset by the natural disasters earlier in the year which made it difficult to interpret exactly where things were.
The results today show that in the September quarter 2011 the economy is growing strongly and the trend ABS estimate of 3.2 puts us well ahead of most of the advanced economies.
The stand-out feature is the growing (and very substantial) contribution of private gross capital formation. This is the positive side of the mining boom. The growth impulse is coming via investment rather than trade.
The portents about investment are also positive given the data suggesting firms intend to continue creating new productive capacity at the same or accelerated rate into 2012. Eventually this rate of capital accumulation will slow and how quickly that happens depends substantially on what happens in Asia.
There is evidence that Asian growth is being negatively impacted by the crisis in Europe and so we will have to wait until March for the December quarter data to find out how much that is impacting on us. It will first show up in exports and then with a medium-period lag on investment (given the projects already in the pipeline).
The data also shows that the Government is contracting sharply and it remains to be seen how damaging that is. The plans outlined in recent weeks suggest that the austerity will accelerate and that will also temper growth.
Today is the first day of the Annual CofFEE Conference (aka the 13th Path to Full Employment Conference/18th National Unemployment Conference) in Newcastle.
That is enough for today!


“The results today show that in the September quarter 2011 the economy is growing strongly ”
Are you sure Bill? Only QLD and WA showed positive growth. Two states are in recession and growth is rather lacklustre elsewhere. This result appears to be almost entirely about mining investment – a small part of the economy and a tiny employer. This result was running concurrent with pronounced weaknesses in overall employment growth, retail and the housing sector.
If this was a strong result, than I don’t think that too many Australians were feeling it.
Dear Bill et al,
Just wondering about the rate of depletion of these mining resources shipped overseas, and consensus on their long term private and public benefit in Aus? Anyone know of responsible research here?
Hope your Conference makes a Mark!
Thanks …
jrbarch
Bill,
Australian gilts seem to be touted as offering better yields than both UK & USA – is this an indication of Oz weathering the GFC better than most?