Today (April 18, 2024), the Australian Bureau of Statistics released the latest - Labour Force,…
Australian labour force data – everything is bad
The Australian Bureau of Statistics (ABS) published the Labour Force data for November 2011 today. The data shows that employment has fallen, the participation rate has fallen and unemployment (and the unemployment rate) have risen. Monthly working hours have also fallen. This is the worst combination that can occur indicating that job creation is declining, workers are leaving the workforce because of the lack of job opportunities and labour underutilisation is rising. So while the Government and the uninformed were celebrating yesterday’s National Accounts data which showed that three months ago Australia was growing (below trend), today’s results are more immediate – they are a depiction of where things are now. The Government is undermining employment growth by insisting on its obsessive pursuit of a budget surplus. The most striking expression of how poor the Australian labour market is performing is the continued deterioration of the youth labour market. That should be a policy priority but unfortunately the government is largely silent on that issue. My assessment of today’s results are that – everything is bad.
The summary ABS Labour Force (seasonally adjusted) estimates for November 2011 are:
- Employment decreased 6,300 (0.1 per cent) with full-time employment decreasing by 39,900 persons and part-time employment increased by 33,600. Over the last year, employment has grown by less than 1 percent (0.9 per cent).
- Unemployment increased by 9,400 (1.5 per cent) and is now at 635,800.
- The official unemployment rate increased to 5.3 per cent down from 5.2 per cent last month.
- The participation rate decreased by 0.1 points to 65.5 per cent.
- Aggregate monthly hours worked decreased by 11.3 millions hours (0.7 per cent).
- The ABS broad labour underutilisation estimates (the sum of unemployment and underemployment) rose by 0.2 percentage points to 12.6 per cent. Both components unemployment and underemployment rose. So not only did the economy produce less jobs overall it also created jobs that increasingly offered deficient hours of work relative to the desires of the workers.
The results thus indicate broad failure.
A labour market that is failing to meet the needs of the available workforce on all fronts. What jobs that were created in net terms were short on desired hours. The poor employment outlook, in turn, led to the workers exiting the labour force – which means that hidden unemployment also rose.
The ABC News response – Unemployment rate rises to 5.3pc – said that the rise in unemployment had come “in above economists’ expectations”.
Last month they said the “the falling rate had beaten economists’ expectations”. Seems like the bank economists are on a roller coaster!
At least the commentary they cite from the bank economists have changed a little over the last six months as the economy fails to provide adequate employment growth.
The tack has changed from “we are close to full employment” with the warning about inflation etc to a much more subdued assessment.
For example, they quote a bank economist saying:
Employment is barely growing, having recorded an anaemic annual growth rate of just 0.4 per cent – the slowest in 27 months … And even if you collate all the jobs created over the first 11 months of 2011, it totals a paltry 44,700 jobs, marking the weakest result for a similar period in 15 years and a far cry from the 366,600 jobs created in the first 11 months of 2010.”
And we might have added that the 2010 growth was all on the back of the fiscal stimulus and the poor growth is due to the very rapid retrenchment of that stimulus – at a time when private spending remains weak notwithstanding the surge in private capital formation in the current year.
The Sydney Morning Herald report carried the same headline – Jobless rate rises to 5.3% .
They also quoted bank economists who continued this subdued outlook. It seems the private sector economists (with special sectoral interests at stake) take some time to get the message. The economy is failing to provide enough jobs and labour underutilisation is rising.
One bank economist quoted said:
It’s a softer number … much weaker than the market had been looking for … The longer this kind of softness persists the greater downside risk for consumer spending and that’s just going to put pressure on businesses.
The commentator might have then been asked to explain why the labour market was behaving in this way – and asked whether the obsessive pursuit of a budget surplus is causal – but the SMH didn’t seem to pursue that obvious line.
The same commentator went on:
A lot of people were getting excited about growth numbers yesterday … This employment data indicates the strong economy is not translating into more jobs.
Missing from that assessment is that the GDP figures described what happened 3 months or more ago while today’s labour force data describes what was happening a few weeks ago when the Labour Force survey was taken.
Employment growing but barely
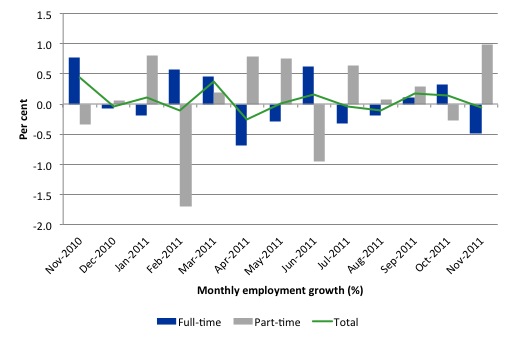
The November data shows that employment decreased by 16,300 (net) (0.1 per cent) with full-time employment declining sharply and repeating the pattern of the last 6 months. Small gain bigger loss – month by month.
There have been considerable fluctuations in the full-time/part-time performance and regular crossings of the zero growth line over the last year. Over the last 12 months, full-time employment has fallen by 14.9 thousand which is an appalling result.
Total employment has grown by 40.4 thousand (0.1 per cent increase per month on average) and all the growth has been in part-time (increasingly casualised) employment.
Since November 2010, employment has grown a miserly 0.4 per cent compared to labour force growth of 0.5 per cent. The latter is usually more than twice this annual growth rate. So the sluggish supply growth is keeping unemployment much lower than it otherwise would be given how poor the employment growth has been.
But still unemployment has risen.
The overall impression is that for the year to date we are effectively in a near jobless growth environment.
The following graph shows the month by month growth in full-time (blue columns), part-time (grey columns) and total employment (green line) for the 12 months to November 2011 using seasonally adjusted data. The ABS trend growth rate of employment is now zero.
While full-time and part-time employment growth are fluctuating around the zero line, total employment growth is still well below the growth that was boosted by the fiscal-stimulus in the middle of 2010.
The following table provides an accounting summary of the labour market performance over the last six months. The monthly data is highly variable so this Table provides a longer view (over the last 6 months) which allows for a better assessment of the trends. WAP is working age population (above 15 year olds). The first three columns show the number of jobs gained or lost (net) in the last six months.
The conclusion – a very modest addition of employment in net terms dominated by full-time employment growth.
The WAP has risen by 109 thousand in the same period while the labour force has risen by 69.1 thousand. Employment has, however, only risen by 29.9 thousand which is the reason unemployment has risen by 39.2 thousand over this period.
The reality is that the labour market is fairly weak and employment growth is failing to keep pace with the underlying population growth much less eat into the rising pool of idle labour.
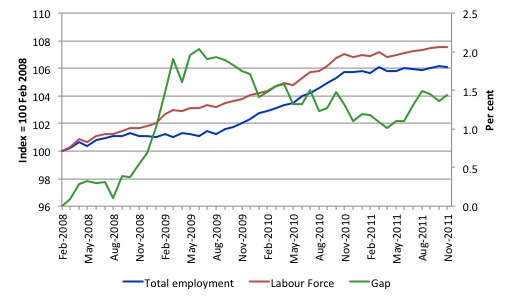
To put the recent data in perspective, the following graph shows the movement in the labour force and total employment since the low-point unemployment rate month in the last cycle (February 2008) to November 2011. The two series are indexed to 100 at that month. The green line (right-axis) is the gap (plotted against the right-axis) between the two aggregates and measures the change in the unemployment rate since the low-point of the last cycle (when it stood at 4 per cent).
You can see that even though the labour force is slowing (mainly due to a fall in working age population due to lower in-migration rates), the divergence between it and employment growth has been widening over the last several months, although in September and October there was a small correction. The overall result is that the Gap (unemployment) has risen significantly in recent months.
The Gap series gives you a good impression of the asymmetry in unemployment rate responses even when the economy experiences a mild downturn (such as the case in Australia). The unemployment rate jumps quickly but declines slowly.
It also highlights the fact that the recovery is still not strong enough to bring the unemployment rate back down to its pre-crisis low. You can see clearly that the unemployment rate fell in late 2009 and then has hovered at the same level for some months before rising again over the last two months.
The Australian labour market continues to be stuck in a period of sluggish growth.
Teenage labour market – appalling and getting worse
The teenage labour market has continued to deteriorate in November from an already parlous starting point. The appears to be no policy awareness with the government and the media continually trying to convince us that the economy is close to full employment.
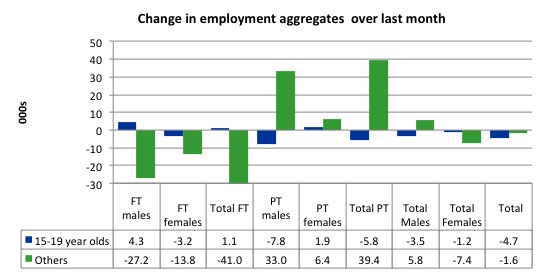
The following data shows that the teenage labour market is in an appalling state. In November 2011, teenagers endured further losses in total employment.
The following graph shows the distribution of net employment creation in the last month by full-time/part-time status and age/gender category (15-19 year olds and the rest).
If you take a longer view you see how poor the situation is.
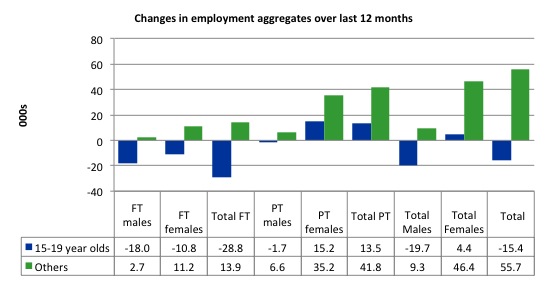
Over the last twelve months teenagers have lost 15.4 thousand (net) jobs while the rest of the labour force has gained 55.7 thousand jobs (net). however, the overall figure hides the extent of the loss. 15-19 year olds lost 28.8 thousand full time jobs in the same period while gaining only 15.2 thousand part-time jobs. In other words, the sparse job opportunities available to them are in the form of casualised, low-paid, insecure jobs that will not develop skills.
The following graph shows the change in aggregates over the last 12 months. Australian teenagers are going backwards which is a trend common around the world at present.
To further emphasise the plight of our teenagers I compiled the following graph that extends the time period from the February 2008, which was the month when the unemployment rate was at its low point in the last cycle, to the present month (November 2011). So it includes the period of downturn and then the “recovery” period. Note the change in vertical scale compared to the previous two graphs. That tells you something!
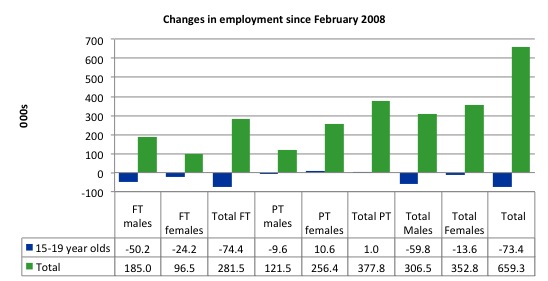
The results are stunning and represent a major policy failure. Since 2008, there have been 659 thousand (net) jobs added to the Australian economy but teenagers have lost 73.4 thousand over the same period. It is even more stark when you consider that 74.4 thousand full-time teenager jobs have been lost in net terms while only 7.9 thousand (net) part-time jobs have been added.
Further, around 57 per cent of the total (net) jobs added since February 2008 have been part-time.
There is nothing good that you can say about any of that. It makes a mockery of those (like the bank economists and our politicians) who claim we are close to full employment. An economy that excludes its active teenagers from any employment growth at all is not one that is using its existing capacity to its potential.
The longer-run consequences of this teenage “lock out” will be very damaging.
In the November 2011 quarter broad labour underutilisation data released today by the ABS, the underemployment rate for 15-24 year olds was 13.2 per cent. Total labour underutilisation for 15-24 year olds was 24.7 per cent.
Last week, the Treasurer announced sharp cuts to government spending as a response to the declining tax revenue (because growth is not as strong as expected).
He made no announcements about helping teenagers get into a job.
I would recommend that the Australian government announce a major public sector job creation program aimed at employing, in the first instance, all the unemployed 15-19 year olds.
It is clear that the Australian labour market continues to fail our 15-19 year olds. At a time when we keep emphasising the future challenges facing the nation in terms of an ageing population and rising dependency ratios the economy still fails to provide enough work (and on-the-job experience) for our teenagers who are our future workforce.
Unemployment
The unemployment rate rose by 0.1 percentage points to 5.3 per cent in November. The decline in employment growth was greater than the decline in the labour force (as participation rates dropped) and so unemployment rose by 9,400 (1.5 per cent) to 635,800.
The rise in unemployment would have been even worse had not the participation rate risen. So some of the weakening in the labour market moved outside the official labour force in the form of rising hidden unemployment.
Overall, the labour market still has significant excess capacity available in most areas and what growth there is is not making any major inroads into the idle pools of labour.
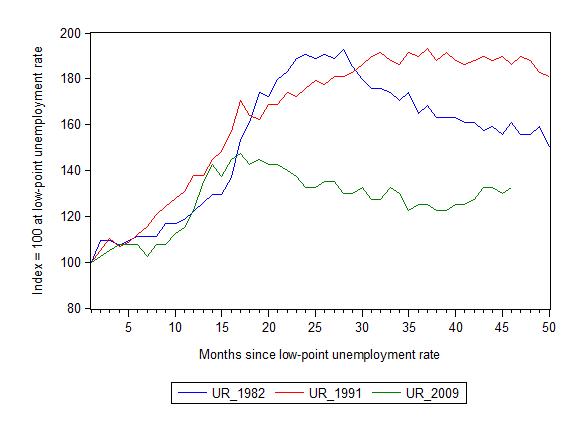
The following graph updates my 3-recessions graph which depicts how quickly the unemployment rose in Australia during each of the three major recessions in recent history: 1982, 1991 and 2009 (the latter to capture the 2008-2010 episode). The unemployment rate was indexed at 100 at its lowest rate before the recession in each case (August 1981; November 1989; February 2008, respectively) and then indexed to that base for each of the months as the recession unfolded.
I have plotted the 3 episodes for 45 months after the low-point unemployment rate was reached. For 1991, the end-point shown is the peak unemployment which was achieved some 38 months after the downturn began although the recovery was painfully slow. While the 1982 recession was severe the economy and the labour market was recovering by the 26th month. The pace of recovery for the 1982 once it began was faster than the recovery in the current period.
It is significant that the current situation while significantly less severe than the previous recessions is dragging on which is a reflection of the lack of private spending growth and declining public spending growth.
The graph provides a graphical depiction of the speed at which the recession unfolded (which tells you something about each episode) and the length of time that the labour market deteriorated (expressed in terms of the unemployment rate).
From the start of the downturn to the 46-month point (to November 2011), the official unemployment rate has risen from a base index value of 100 to a value 132.5 – peaking at 145 after 21 months. The trend, however, was upward not downward. At the same stage in 1991 the rise was 186.2 (and falling) and in 1982 – 161 (and falling overall with monthly variations).
Note that these are index numbers and only tell us about the speed of decay rather than levels of unemployment. Clearly the 5.3 per cent at this stage of the downturn is lower that the unemployment rate was in the previous recessions at a comparable point in the cycle although we have to consider the broader measures of labour underutilisation (which include underemployment) before we draw any clear conclusions.
The notable aspect of the current situation is that the recovery has stalled.
Each quarter the ABS publish their broader measures of labour underutilisation. Today, we received the data for the November 2011 quarter.
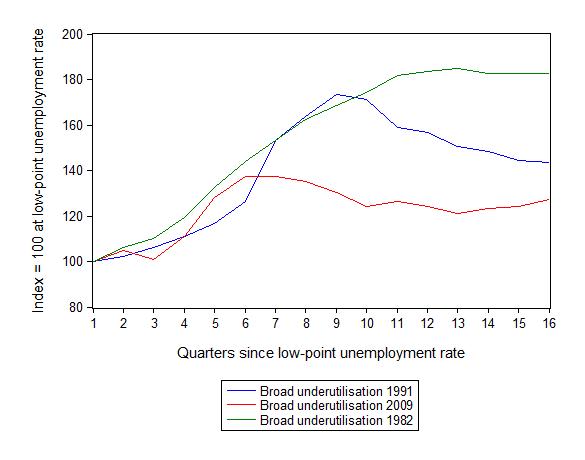
The following graph replicates the previous graph except it uses the ABS broad labour underutilisation rate (unemployment plus underemployment) as a better means of comparing the three recessions.
At the same period in the recovery (using quarterly data), the broad labour underutilisation rate (unemployment plus underemployment) had an index value of 143 in the 1982 recession (absolute value of 11.9 per cent and falling); an index value of 182 in the 1991 recession (absolute value of 17.9 per cent and steady); and an index value of 127.3 in the current period (absolute value of 12.6 per cent and rising).
So while the level of unemployment is much lower now than in the 1982 recession (at a comparable stage), underemployment is now much higher and so the total labour underutilisation rates are similar.
Commentators who think of the 1982 recession as severe, rarely see it in these terms. Joblessness is probably worse than underemployment but both mean that labour is wasted and income earning opportunities are being foregone. For a worker with extensive nominal commitments, the loss of income when hours are rationed may be no less severe than the loss of hours involved in unemployment, if the threshold of solvency is breached.
Labour force participation falls
The impact of a falling labour force participation rate is that hidden unemployment has risen marginally and the rise in unemployment was less than it otherwise would have been given the parlous employment growth performance.
Hours worked rise marginally in November
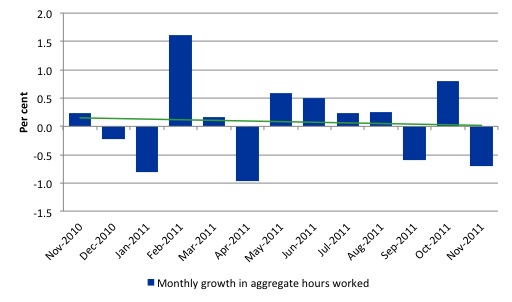
Aggregate monthly hours worked decreased by 11.3 millions hours (0.7 per cent).
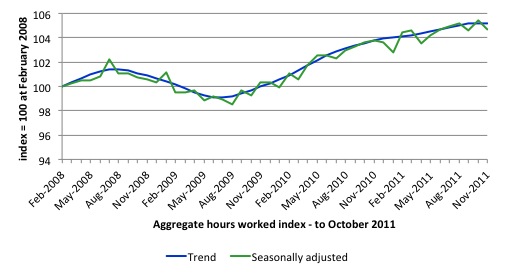
Total monthly hours worked rose by 11.3 million hours in November (0.7 per cent). After the initial fiscal-driven recovery from the recession, the trend is now flat to falling.
The following graph shows the trend and seasonally adjusted aggregate hours worked indexed to 100 at the peak in February 2008 (which was the low-point unemployment rate in the previous cycle). The rising trend which marked the early recovery courtesy of the fiscal stimulus has now flattened.
The next graph shows the monthly growth (in per cent) over the last 12 months. The green linear line is a simple regression trend and it is suggesting monthly growth rates is very weak negative trended..
Once again the data doesn’t support the notion of a fully employed labour market that is bursting against the inflation barrier.
Conclusion
It is clear that our economy was growing three months ago but since then the labour market has been indicating a slowing economy.
The November Labour Force data shows that the Australian economic recovery remains very subdued and is not producing any significant growth in employment and over the last year there have been several months of negative employment growth.
We always have to be careful interpreting month to month movements given the way the Labour Force Survey is constructed and implemented but there has now been enough data over the last several months to tell us that my assessment in the previous paragraph is sound.
Employment growth over the last twelve months has been insufficient to keep pace with the population growth and so despite so-called economic recovery unemployment has been rising. The withdrawal of the fiscal stimulus has now been revealed to being sharp and has undermined employment growth. The fiscal stimulus has been withdrawn too early and too quickly.
The most striking aspect of a sad picture is the appalling performance of the teenage labour market. Employment has collapsed for that cohort and I consider it a matter of policy urgency for the Government to introduce an employment guarantee to ensure we do not continue undermining our potential workforce.
However, the Government has become obsessed with pursuing its budget surplus and has lot track of what the real priorities that it should attend to are.
Today’s results were particularly poor.
It is Day 2 of the Annual CofFEE Conference (aka the 13th Path to Full Employment Conference/18th National Unemployment Conference) which I host each year in Newcastle. I may have some reportage from the Conference in tomorrow’s blog. We are running a Modern Monetary Theory (MMT) panel today and I should be able to produce some video for that session.
That is enough for today!

What has been described above is characteristic of an oligarchy which is afflicted with what I call the SIA Syndrome – Stupidity,Ignorance,Arrogance. In spite of the hard lessons from the Great Depression the same mistakes have been and continue to be made,all in the service of a mindless ideology.
Austerity is now the conventional wisdom,indeed,the fashion.This will only serve the short term interests of the financial sector,but they only “think” in the short term,just like their political puppets.
I see another Great Depression coming.In spite of the suffering that will cause it may,in fact be a good thing.The system is broken and there needs to be a lot of creative destruction.
RBA has a dual mandate. Currency stability and full employment…..although nobody ever talks about full employment. How convenient.
They have only one lever which is interest rates. The currency is stable (i.e. inflation is manageable). Surely they must lower interest rates to boost employment? Even with made up NAIRU numbers they cannot be meeting their full employment remit.
Hey Bill, I have to admit I have not yet read this article, but I have a burning question. Today on the news, in the wake of the RBA’s 1/4% interest rate cut, a report said that one of the banks was being skittish about “passing on” the rate cut because of the price of funds in the retail banking sector. I may have garbled that slightly, but what I really want to know is what governs the price of funds for retail banks? I thought it was mainly related to the RBA’s interest rate. Is this a case of the reporter not knowing his stuff or am I missing something? Do “retail banks” simply create funds for new loans or do they have to get the money from deposits?
Bill,
It appears to take a generation to fully utilise new inventions (steam power for Industrial Revolution) and the computer/PC is now commonplace for the Information Age Revolution. This thought coupled with rapid expansion of the world’s working population could account for Government’s ability to gainfully employ its citizens. This not to excuse the Neo-Con actions of the economic/financial communities whose policies are exacerbating the problem.
Chris,
There is a large cohesive group of people who have accumulated great wealth, power and control over a significantly larger group of other citizens. They have adopted a common ideology. They seek to consolidate their position and further their own ambitions at whatever cost necessary. The give nary a jot for the wellbeing of others.
Class warfare is nothing new in human history. It’s just for the last 50 years, the masses were lulled into a false sense of security. It may make take a generation for most people to realise the difficulty they are in.
Bill et al.
Just to make a point about unemployment that Bill et al. might not fully realise: most reporters and members of the public do not know that governments and central banks deliberately create unemployment to “control inflation”. I’m saying this to Bill, because he might not know how little most people know about something I believe should be front page news. This is something every reporter and commentator should be challenging govts and CBs on, for the sake of the public.
Thanks for that CharlesJ.
Take a trip over to pragcap and see sincere, staunch, MMT advocates struggling with this basic economic concept.
Most people don’t see business profits and executive pay as an inefficent transfer tax on the workerforce and consumers either 😉