Today (April 18, 2024), the Australian Bureau of Statistics released the latest - Labour Force,…
Australian labour market – converting unemployment into hidden unemployment
Today’s release by the Australian Bureau of Statistics (ABS) of the Labour Force data for April 2012 reveals a weak labour market with the employment gains being confined to part-time work and workers dropping out of the labour force due to the limited available vacancies. While unemployment fell by 28.8 thousand, the drop in participation accounted for 26 thousand of that – meaning the Australian economy has been busy over the last month converting the official unemployed into hidden unemployed. This is not a “good” outcome as some in the media and the Government are claiming today. The outlook is also not very positive either given the Federal government’s obsessive pursuit of a budget surplus which will cut economic growth by some percentage points. They are even boasting that if growth falls short and tax revenue shrinks they will impose even further cuts on spending and/or increases in taxes. At that point the word idiocy comes to mind. The most disturbing aspect of the labour market data remains the appalling state of the youth labour market. This should be a policy priority for the government. But they have gone missing in action – lost in their surplus mania. My assessment of today’s results – very subdued indeed. I will be on ABC Radio National Drive program tonight from 18:15 talking about today’s data! Live Feed.
The summary ABS Labour Force (seasonally adjusted) estimates for April 2012 are:
- Employment increased by 15,500 (0.1 per cent) with full-time employment falling by 10,500 (0.1 per cent) and part-time employment rising by 26,200 (0.8 per cent).
- Unemployment decreased by 28,800 (4.6 per cent) to 598,200. The decline in unemployment is almost solely due to the declining participation rate.
- The official unemployment rate fell to 4.9 per cent because of the labour supply contraction.
- The participation rate decreased by 0.1 pts to 65.2 per cent.
- Aggregate monthly hours worked increased by 6.6 million hours (0.4 per cent).
- The ABS broad labour underutilisation estimates (the sum of unemployment and underemployment) is published quarterly (next release in May 2012) and in February was 12.5 per cent. I expect that underemployment will have risen given that drop in full-time employment.
The Sydney Morning Herald story – Jobless rate in surprise fall – referred to the prediction by bank economists that the unemployment rate would rise to 5.3 per cent (up 0.1 per cent).
One bank economist was quoted as saying:
It’s generally stronger than expected … You’ve got another reasonable gain in employment and while the previous month was revised down, the last couple of months have been decent.
Which is not the story that the numbers are telling. The gain in employment was tepid and full-time employment fell. An economy that adds part-time jobs only is not providing a “reasonable gain in employment” or indicating strength.
And with the participation dropping again, the story is far from decent. I will show you what the decline in participation means further on.
The Employment Minister was quoted as saying:
Even the most trenchant critics of the government would have to acknowledge that an unemployment rate of 4.9 per cent is good news for the nation.
As one of the Government’s most trenchant critics a fall in the unemployment rate that is associated with a drop in full-time employment (that is, further moves to casualisation and low-pay) and the unemployed leaving the labour force because vacancies are scarce is hardly “good news”. It just means that the quality of employment is declining and the official unemployed are becoming hidden unemployed as an artefact of the way the statistician conducts the Labour Force Survey and classifies activity.
Three days ago (May 7, 2012), the same Sydney Morning Herald reporter (Chris Zappone) reported that – Job ads point to labour market weakness. This story was in relation to a job vacancies series which is published by one of the four main banks. The bank also indicated that it was revising its previous estimates of job ads growth down because the data was found to be unreliable.
Last week, the RBA in its Statement on Monetary Policy – see Chapter Domestic Economic Conditions – also said that the current expectations of jobs growth were too optimistic:
… these leading indicators have tended to overestimate net employment growth … Overall, the vacancy data and survey measures continue to point to modest employment growth in the period ahead.
So today’s data does not alter that view – a very sombre outcome was presented.
The ABC report – Unemployment drops as job seekers give up – focused on what is actually happening:
Australia’s unemployment rate dropped to a 12-month low of 4.9 per cent last month in a surprise result as people gave up looking for work … The figures suggest job seekers dropped out of the hunt for work; the participation rate, which measures the number of people at work or seeking work, fell 0.1 of a percentage point to 65.2 per cent.
While most people will think the decline in unemployment is a “good thing” the reality is as explained above – a conversion of unemployment to hidden unemployment in the face of declining vacancies and increased casualisation is not a good signal.
The ABC also quoted the Employment Minister as saying that:
… the figures showed that more Australians were at work than ever before Federal employment minister Bill Shorten said the figures showed that more Australians were at work than ever before and highlighted the importance of the Government’s confidence building measures, such as bringing the budget back to surplus.
First, the ABS Population Clock tells us that there is “an overall total population increase of one person every 1 minute and 34 seconds”. Saying that “more Australians were at work than ever before” is thus meaningless. There are also more American in work than Australians and so on.
Second, the data does not suggest an increased confidence in the private sector. Exactly the opposite. Full-time jobs vanishing, casualisation increasing, people dropping out of the labour force because there are limited new vacancies.
Third, the pursuit of the surplus is the reason the labour market is so flat and on trend terms in decline.
As a preview of what we are going to be up against in the coming year, the Treasurer gave is usual Post-Budget speech to the National Press Club yesterday.
He told the gathering that if real GDP growth was below the Treasury forecast in the Budget released on Tuesday and tax revenue was lower than expected then he would impose deeper spending cuts and/or tax rate rises over the next 12 months to keep his budget surplus promise on track.
He indicated he would allow the economy to weaken instead of abandoning his (near-hopeless – my words) quest for a surplus.
This is in the context of the 2012-13 Budget proposing a 3 percentage points of GDP fiscal shift in one year – a totally unprecedented contraction in our history.
The Treasurer will learn that he doesn’t control the budget outcome. Private spending and saving also has an important role to play and that will be damaged by the fiscal withdrawal and it is highly doubtful that the surplus target will be achieved. The problem is in trying, the Government will further undermine a relatively weak economy.
Employment growth – positive but trend remains weak
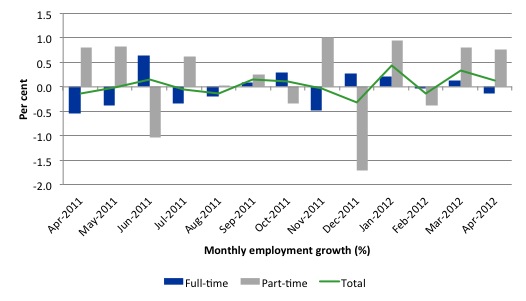
The April data shows that employment increased by 15,500 (net) (0.1 per cent) with full-time employment falling by 10,500 (0.1 per cent) and part-time employment rising by 26,200 (0.8 per cent).
Today’s data reasserts the message that the labour market data is switching back and forth each month with an sluggish underlying trend being fairly stable for some months now.
There have been considerable fluctuations in the full-time/part-time growth over the last year with regular crossings of the zero growth line. Over the last 12 months, full-time employment has risen by just 10.2 thousand while part-time employment has risen by 58.9 thousand reflecting the weak bias in the labour market.
Since April 2011, employment has grown by a miserly 0.6 per cent while the labour force has grown by 69.8 thousand (0.6 per cent), which means that unemployment has risen (by 8.4 thousand) over the same period.
Labour force growth is also subdued by the state of the economy (with participation rates still well down on previous peaks and down 4 percentage points over the last 12 months), which means that the sluggish supply growth is keeping unemployment much lower than it otherwise would be given how poor the employment growth has been.
The following graph shows the month by month growth in full-time (blue columns), part-time (grey columns) and total employment (green line) for the 12 months to April 2012 using seasonally adjusted data.
Today’s results just repeat the topsy-turvy nature of the data over the period shown. The Australian labour market is struggling with the low GDP growth creating a near jobless growth environment.
While full-time and part-time employment growth are fluctuating around the zero line, total employment growth is still well below the growth that was boosted by the fiscal-stimulus in the middle of 2010.
The following table provides an accounting summary of the labour market performance over the last six months. The monthly data is highly variable so this Table provides a longer view (over the last 6 months) which allows for a better assessment of the trends. WAP is working age population (above 15 year olds). The first three columns show the number of jobs gained or lost (net) in the last six months.
The conclusion – overall only 46.6 thousand jobs (net) have been created in Australia over the last six months. Full-time employment has fallen in total over this period. So all the growth in employment has been in part-time jobs. The WAP has risen by 117 thousand in the same period while the labour force has risen by only 21 thousand.
The upshot is that relatively weak employment growth has still allowed the unemployment to fall (by 26 thousand) because the decline in the participation rate (0.30 points) has led to a subdued labour force growth rate relative to the underlying population growth.
If participation had not have fallen over this period (that is, the labour force had have grown more in line with the underlying population growth) there would have been a rise in unemployment.
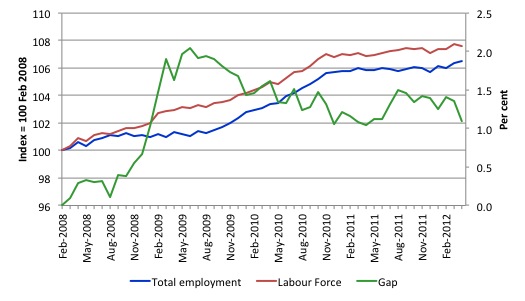
To put the recent data in perspective, the following graph shows the movement in the labour force and total employment since the low-point unemployment rate month in the last cycle (February 2008) to April 2012. The two series are indexed to 100 at that month. The green line (right-axis) is the gap (plotted against the right-axis) between the two aggregates and measures the change in the unemployment rate since the low-point of the last cycle (when it stood at 4 per cent).
You can see that the labour force index has largely levelled off and now falling and the divergence between it and employment growth has been relatively steady over the last several months with this month showing some improvement.
The Gap series gives you a good impression of the asymmetry in unemployment rate responses even when the economy experiences a mild downturn (such as the case in Australia). The unemployment rate jumps quickly but declines slowly.
It also highlights the fact that the recovery is still not strong enough to bring the unemployment rate back down to its pre-crisis low. You can see clearly that the unemployment rate fell in late 2009 and then has hovered at the same level for some months before rising again over the last two months.
The gap shows that the labour market is still a long way from recovering from the financial crisis that hit in early 2008. There hasn’t been much progress since November 2010, when the fiscal stimulus started to run out.
Teenage labour market – remains in a parlous state
Regular readers will know that I regularly highlight the plight of our teenagers in the labour market.
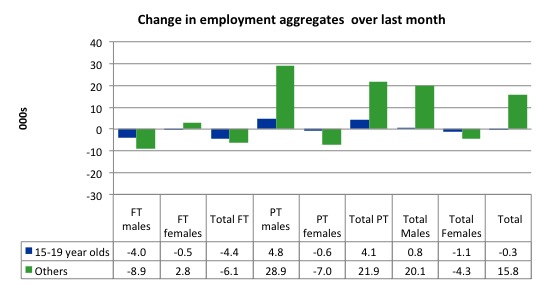
The teenage labour market deteriorated further this month, with 300 jobs being lost overall while the rest of the workforce gained 15.8 thousand jobs.
The following graph shows the distribution of net employment creation in the last month by full-time/part-time status and age/gender category (15-19 year olds and the rest)
If you take a longer view you see how poor the situation is.
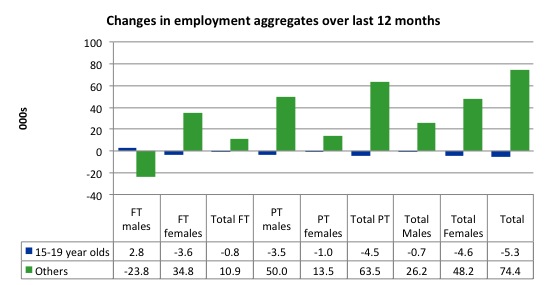
Over the last twelve months teenagers have lost 5.3 thousand (net) jobs while the rest of the labour force has gained 15.8 thousand jobs (net). So it is the teenage segment of the labour market that is being dragged down by the sluggish growth, which is hardly surprising given that the least experienced and/or most disadvantaged (those with disabilities etc) are rationed to the back of the queue by the employers.
The following graph shows the change in aggregates over the last 12 months. Australian teenagers are going backwards which is a trend common around the world at present.
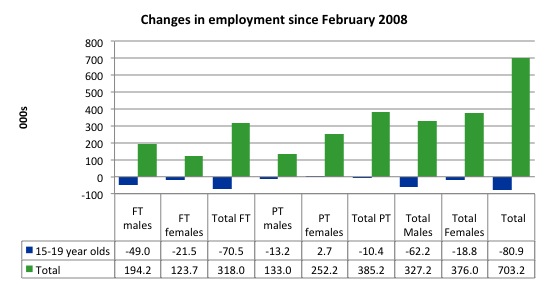
To further emphasise the plight of our teenagers I compiled the following graph that extends the time period from the February 2008, which was the month when the unemployment rate was at its low point in the last cycle, to the present month (April 2012). So it includes the period of downturn and then the “recovery” period. Note the change in vertical scale compared to the previous two graphs. That tells you something!
The results are stunning and represent a major policy failure.
Since February 2008, there have been 703 thousand (net) jobs added to the Australian economy but teenagers have lost 80.9 thousand over the same period. It is even more stark when you consider that 70.5 thousand full-time teenager jobs have been lost in net terms. Even in the traditionally, concentrated teenage segment – part-time employment – there have been 29.7 thousand jobs (net) lost.
Further, around 54.7 per cent of the total (net) jobs added since February 2008 have been part-time.
Overall, the performance over the last 12 months is poor and should receive a much higher priority in the policy debate than it does.
The longer-run consequences of this teenage “lock out” will be very damaging.
The Australian government has no coherent strategy to resolve this appalling state. Ensuring teenagers are included in paid work, if they do not desire to remain in school, should be number one policy priority.
The Government’s response is to push this cohort into endless training initiatives (supply-side approach) without significant benefits. The research shows overwhelmingly that job-specific skills development should be done within a paid-work environment.
I would recommend that the Australian government announce a major public sector job creation program aimed at employing, in the first instance, all the unemployed 15-19 year olds.
It is clear that the Australian labour market continues to fail our 15-19 year olds. At a time when we keep emphasising the future challenges facing the nation in terms of an ageing population and rising dependency ratios the economy still fails to provide enough work (and on-the-job experience) for our teenagers who are our future workforce.
The 2012-13 Budget announced on Tuesday failed to meet the challenge posed by the Gonski Review which recently indicated that an urgent $A5 billion was needed to be injected into the public education system to redress the decline in standards. The policy strategy to deliberately starve our public education system of funding and then fail to provide enough jobs for the teenagers who exit the sub-standard system – all in the pursuit of a budget surplus at all costs – is reprehensible.
Unemployment
The unemployment rate fell by 0.3 percentage points in April to 4.9 per cent as the labour force contracted.
Overall, the labour market still has significant excess capacity available in most areas and what growth there is is not making any major inroads into the idle pools of labour.
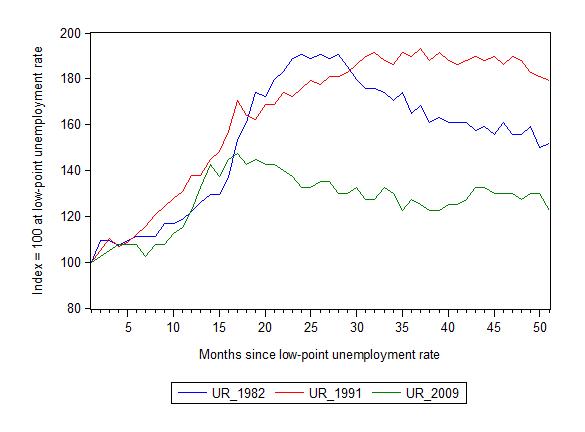
The following graph updates my 3-recessions graph which depicts how quickly the unemployment rose in Australia during each of the three major recessions in recent history: 1982, 1991 and 2009 (the latter to capture the 2008-2010 episode). The unemployment rate was indexed at 100 at its lowest rate before the recession in each case (August 1981; December 1989; April 2008, respectively) and then indexed to that base for each of the months as the recession unfolded.
I have plotted the 3 episodes for 51 months after the low-point unemployment rate was reached. For 1991, the end-point shown is the peak unemployment which was achieved some 38 months after the downturn began although the recovery was painfully slow. While the 1982 recession was severe the economy and the labour market was recovering by the 26th month. The pace of recovery for the 1982 once it began was faster than the recovery in the current period.
It is significant that the current situation while significantly less severe than the previous recessions is dragging on which is a reflection of the lack of private spending growth and declining public spending growth.
The graph provides a graphical depiction of the speed at which the recession unfolded (which tells you something about each episode) and the length of time that the labour market deteriorated (expressed in terms of the unemployment rate).
From the start of the downturn to the 51-month point (to April 2012), the official unemployment rate has risen from a base index value of 100 to a value 122.5 – peaking at 145 after 21 months. It reached this local low point 8 months ago (122.5) and has been hovering at the higher level since then. Unlike the other episode, the current trend, at this stage of the cycle, is unclear.
At 51 months, 1982 index stood at 152 and falling slowly, while the 1991 index was around 179 and falling slowly.
It is clear that at an equivalent point in the “recovery cycle” the current period is more sluggish than our recent two major downturns.
Note that these are index numbers and only tell us about the speed of decay rather than levels of unemployment. Clearly the 4.9 per cent at this stage of the downturn is lower that the unemployment rate was in the previous recessions at a comparable point in the cycle although we have to consider the broader measures of labour underutilisation (which include underemployment) before we draw any clear conclusions.
The notable aspect of the current situation is that the recovery has stalled.
Aggregate participation rate fell again
The participation rate fell by 0.1 percentage points in April 2012 and has fallen by 0.4 percentage points over the last 12 months. It is now at 65.2 per cent which is still substantially down on the most recent peak of 66 per cent (November 2010) when the labour market was gathering pace courtesy of the fiscal stimulus.
This drop in participation in the last year or more has meant the labour force growth has been relatively subdued with the additional result being that the unemployment rate is considerably lower than would otherwise been the case.
What would have the unemployment rate been if the participation rate was constant?
The labour force is a subset of the working-age population (those above 15 years old). The proportion of the working-age population that constitutes the labour force is called the labour force participation rate. So changes in the labour force can impact on the official unemployment rate and so movements in the latter need to be interpreted carefully. A rising unemployment rate may not indicate a recessing economy.
The labour force can expand as a result of general population growth and/or increases in the labour force participation rates.
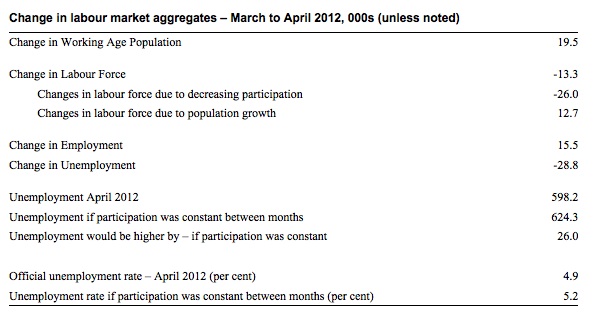
The following Table shows the breakdown in the changes to the main aggregates (Labour Force, Employment and Unemployment) and the impact of the fall in the participation rate.
In April 2012, employment rose by 15.500 while the labour force fell by 13,300 which meant that unemployment fell by 28,800.
However, the labour force would have grown by 12.7 thousand more had the participation rate not fallen. The underlying population growth added 19.5 thousand to the labour force. The population growth impact on the labour force aggregate is steady from month to month.
If the participation rate had have been unchanged then the labour force would have been 12125.3 thousand instead of 12099.2 thousand. Given the current employment level, unemployment would have been 624.3 thousand instead of 598.2 thousand.
So if the participation rate had have remained unchanged, the unemployment rate would have been 5.2 per cent (its March 2012 value) rather than 4.9 per cent as officially published. The difference, of-course, is the that the “hidden unemployment rate” rose.
The conclusion is that the fall in unemployment of 28,800 was almost exclusively due to the fall in labour force participation (equivalent to 26,000 persons). That tells you how weak employment growth was in April 2012.
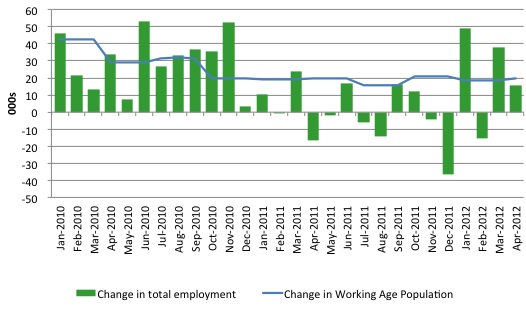
Another way of thinking about the strength of employment growth is to compare the change in employment each month with the change in the working age population (WAP). The change in the WAP is the underlying number of workers that enter the labour force month to month. The labour force fluctuates also due to participation rate changes but they tend to be volatile and cyclical.
So is the Australian economy adding jobs faster than the growth of its population? The answer is no.
The following graph plots the two series over the last two years. Over that period, the WAP has expanded on average by 24 thousand per month while employment has only grown on average by 15 thousand. That is why unemployment has risen. But then further fluctuations in unemployment are driven by the participation rate volatility over this period.
If you consider the last 12 months, it is very clear that employment growth is lagging well behind the growth in the working age population.
To see how participation effects really matter I computed what the impact of the declining participation rate since its last peak (April 2008) has been.
Since that peak the participation rate has fallen from 65.8 per cent to 65.2 per cent, a substantial reduction.
If the participation rate had have remained constant then there would have been an additional143.2 thousand workers in the official labour force count and at present employment growth, unemployment woud be at 773 thousand rather than 598 thousand.
The official unemployment rate of 5.2 per cent would have been 6.1 per cent – a considerably weaker picture than that presented in the official data.
The 175 thousand workers who have stopped looking for work are being discouraged (probably) by the flat employment growth.
Hours worked rose slightly in April 2012
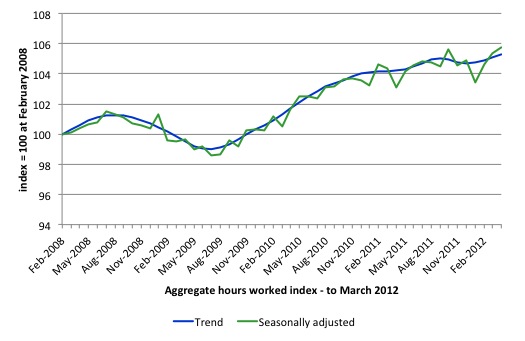
Aggregate monthly hours worked increased by 6.6 million hours (0.4 per cent) in seasonally adjusted terms although they were mostly flat in trend terms.
The following graph shows the trend and seasonally adjusted aggregate hours worked indexed to 100 at the peak in February 2008 (which was the low-point unemployment rate in the previous cycle). The rising trend which marked the early recovery courtesy of the fiscal stimulus is now clearly flat.
This should also moderate the views of those that think today’s data shows “strength”. It doesn’t do anything other than show that the situation is not deteriorating from a very subdued current state..
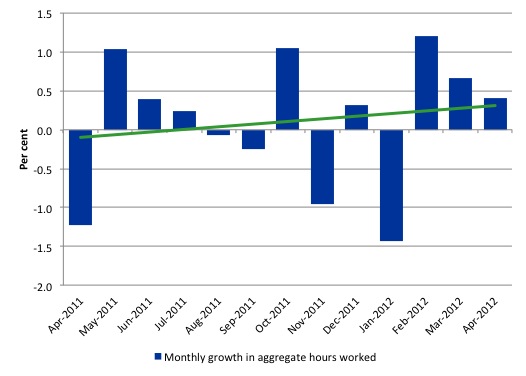
The next graph shows the monthly growth (in per cent) over the last 12 months. The green linear line is a simple regression trend and it is suggesting monthly growth rates only weakly trending upwards.
Once again the data doesn’t support the notion of a fully employed labour market that is bursting against the inflation barrier.
The trend in hours growth is now virtually flat with several large losses over the last 6 months.
Conclusion
2011 was a year of jobless growth in net terms. Over the last 6 months of 2011 employment growth contracted sharply. The national economy clearly had failed in 2011 to grow at a rate sufficient to absorb the underlying population growth and unemployment rose.
In the first months of this year, the situation remains uncertain with positive and negative swings in employment growth already evident and repeating the behaviour over the last 18 or so months.
The drop in unemployment in April should be seen for what it is – almost 100 per cent due to workers dropping out of the labour force. Employment growth is very weak and without the labour force shrinkage there would have been barely any change in official unemployment.
The best assessment is that the labour market is weak – especially when you consider that full-time employment has fallen over the last six months.
While many commentators still hang onto the view that the investment associated with the mining boom will eventually push the Australian economy into an inflationary situation with the labour market tightening this year, I am less sure.
Other data (finance, housing etc) remains weak and the most recent National Accounts (although three months old) shows that private investment fell sharply.
The labour market is stuck and employment growth is barely positive and has been that way for some months.
I still believe that the private sector is deleveraging after a period of unsustainable credit-driven consumption and that mining boom aside, net exports are not strong enough to offset the spending moderation.
In the coming year, the obsessive push towards surplus by the Federal government will also put a significant brake on aggregate spending growth.
We always have to be careful interpreting month to month movements given the way the Labour Force Survey is constructed and implemented. But the underlying trend is weak as a result of the withdrawal of the fiscal stimulus undermining employment growth.
The most striking aspect of a sad picture remains the appalling performance of the teenage labour market. Employment has collapsed for that cohort and I consider it a matter of policy urgency for the Government to introduce an employment guarantee to ensure we do not continue undermining our potential workforce.
That is enough for today!

I hear my self thinking ‘what do these clowns not understand about the intellectual (and real world) poverty of austerity’? But then, I already know the answer … Everything.
Bill, have you seen this? Tim Colebatch argues that flawed methods have caused the ABS to grossly underestimate the growth in employment, and that it has been much stronger than the figures since the end of 2010 suggest [http://www.petermartin.com.au/2012/05/colebatch-has-cracked-it-why-jobs-data.html]
“I still believe that the private sector is deleveraging after a period of unsustainable credit-driven consumption”
in other words, we are suffering from over-consumption that has to be paid for (worked off) now. The problem probably is more due to policies that enhanced the previous consumption and the related expansion of credit than a matter of present policy. Prior interference by policies that produced such over-consumption should be blamed.
Dear Lefty (at 2012/05/11 at 12:51)
Yes, I read it earlier. The ABS also published a detailed explanatory note yesterday which explains how the population extrapolations are done and why they made the changes in 2010. They, of-course, deny Tim Colebatch’s assertions. There is pro and con in both versions of the issue. We take the monthly data with a very liberal grain of salt anyway because of the sampling errors. Tim’s point is that a whole year’s data is wrong. We will see. The tax data supports his view, the national accounts and other data says otherwise.
best wishes
bill
Linus:
in other words, we are suffering from over-consumption that has to be paid for (worked off) now.
Really? We overconsumed stuff then that we are only working to produce now?
No, what happened is that insufficient stable government credit (deficit spending targetted at people who actually do something) was part of the cause of excessive unstable private credit funding consumption of goods produced before they were consumed, in the traditional order. And in the traditional way of all unsustainable unstable things, it wasn’t sustained, and even people & firms who were perfectly well & usefully employed at the ordinary tasks of life, like teachers & firemen & multifarious businesses suffer for no reason at all.
Does the idea of malinvestment make sense without one of “beninvestment”? – A word I just coined, and plan to charge for the use of. 🙂
MMT has the bright idea of making monetary economies work as well as the premonetaries economy they grew out of, and which understood themselves better, by not unemploying, by making the definitionally-true beninvestment of employing ready, willing and ABLE people in what society democratically & practically determines as boninvestments.
“The tax data supports his view, the national accounts and other data says otherwise.”
Yes, reflecting on the issue, had jobs growth been strong in 2011 then I would have expected to see broad strength across a range of indicators. Instead we saw softening GDP, the weakest credit growth in the history of the RBA series, a horror year for the housing market and a range of other weak data.
I’m not convinced that Tim has found what he seems to think he has found.
Unemployment is a very important issue to me since I can not get a job. I want to see the government close down job network (which is ineffective at best even admitted to by Peter Costello) and start job creation programs in lower socio-economic areas to prevent further “poverty by postcode”. I suffered by not being able to get work in my twenties and am constantly still falling into brackets of overqualified and under-experienced in my early thirties. It also angers me that people are not counted as unemployed if their partner works (making them ineligible for assistance from government) when the cost of living in Sydney is so high and for many people the only agencies are for profit job search agencies who only take Centrelink customers.
When politicians like Wayne Swan start believing their own politically manipulated unemployment figures then the crash is inevitable and we should all be concerned. Hundred of thousands of Australians are placed on invalid pensions, single mother pension, parenting payments, useless retraining programs, etc, which masks the true extent of the catrastrophe happening right now in Australia. I can only guess the true unemployment figure; but I would place it at around 20% of the population of Australia. Working a few hours a fortnight is in the government eyes, being employed. I suppose you could say that doing volunteer work is being employed too. However, this will not pay for the ever increasing cost of living in Australia.
Retailing is a huge employer; but where is the future in selling mostly Chinese produced goods. I am not complaining about chinese merchandise as we have access to inexpensive products but it is sending our jobs to Asia. Where is the future for Australian manufacturing? Only time will tell.