It's Wednesday and I discuss a number of topics today. First, the 'million simulations' that…
The US economy is precariously poised
Last week (June 6, 2012), the US Bureau of Labor Statistics released the Employment Situation Summary – for June 2012, which revealed that the US economy had added 80,000 net jobs in the last month, well below the quantity that economists had been estimating. The US national unemployment rate was unchanged at 8.2 percent. The BLS said that the “Nonfarm payroll employment continued to edge up” but the commentators labelled the result “soft”. The US policy makers continues to ignore the plight of the unemployed. The data shows that June 2012 is the 41st consecutive month that the national unemployment rate has exceeded 8 per cent, which is the longest period of above 8 per cent unemployment in the history of the data series (from January 1948). The danger now is that the economy will fall prey to the political debate leading up to the November election and resulting policy responses will truly push the economy over the cliff into recession. The US economy is precariously poised at present and some fiscal commitment to supporting growth is urgently needed.
With the number of unemployed persons unchanged at 12.7 million and the participation rate steady at 63.8, the US economy is adding jobs at a pace just equal to underlying growth in the working age population.
The national unemployment rate was above 8 per cent for 12 consecutive months starting January 1975 and then for 27 consecutive months between November 1981 and January 1984.
This recession is certainly setting new marks.
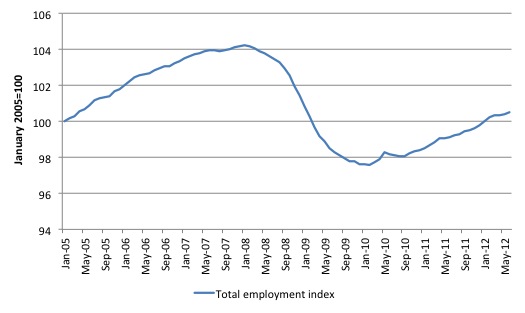
The following graph (using BLS data) reveals that total employment growth is now stalling in the US. The following graph uses the BLS data and shows total non-farm employment expressed as an index (January 2005 = 100).
Total payroll employment (133,088 thousand) is now around the April 2005 level (when it was 133194 thousand) and has . So the crisis has seen the US economy lose about 7 years of employment growth, which is a stunning testimony to
the depth of the crisis.
Total payroll employment (133088 thousand) is now around the April 2005 level (when it was 133,194 thousand) and has . So the crisis has seen the US economy lose about 7 years of employment growth, which is a stunning testimony to the depth of the crisis.
The BLS also reported that:
The average workweek for all employees on private nonfarm payrolls edged up by 0.1 hour to 34.5 hours in June. The manufacturing workweek edged up by 0.1 hour to 40.7 hours …
What does the slight increase in the average weekly hours worked – an increase of 6 minutes per week – mean?
The Bloomberg News article (July 6, 2012) – Employers Get More From U.S. Workers as Jobs Gain Lags Forecast – presented an interesting estimate of what the drop in average weekly working hours means in terms of employment foregone.
They said:
The average workweek climbed by six minutes to 34.5 hours in June … The increase in the average workweek would be equivalent to a 325,000 gain in payrolls, according to estimates by economists at Nomura Securities International Inc …
So in May 2012, average weekly hours worked were 34.4 hours and the total private employment of 111,061 thousand would give a total working hours of 3820498.4 thousand hours for that month. In June 2012, average weekly hours had risen to 34.5 and employment was 111,145 thousand giving a total working hours of 3834502.5 hours.
Had that many hours been generated by workers working 34.4 hours on average per week then total employment would have been 111,468 thousand, a rise of 323 thousand in total employment.
So the calculation is correct but difficult to attach any importance to given the month-to-month movements.
For example, in January average weekly hours worked was also 34.5 and in February 34.6. If we were to compare the June result with February, total employment in June is 321 thousand more than it would have been if the actual total hours worked in June was associated with the higher average working week of February (34.6 hours).
The point is that month-to-month variations make it very hard to draw any trends.
The Bloomberg article also noted that firms are boosting hours worked but acting in a restrained manner when it comes to increasing persons employed.
A discussion about hours worked and persons employed usually invokes the concept of labour hoarding, which was implicit in the Bloomberg article.
Employers have various ways in which they can adjust to cyclical swings in aggregate demand. Their choice is influenced by how “fixed” they consider their workers are.
There was an article by http://en.wikipedia.org/wiki/Walter_Oi”>Walter Oi in 1961 – Labor as a Quasi-Fixed Factor – (Full Reference: Oi, W. (1962) ‘Labor as a Quasi-Fixed Factor’, The Journal of Political Economy, 70(6), 538-555) – which dealt with this problem. There are aspects of the paper that are contestable but the principle notion was sound.
Walter Oi wrote:
The cyclical behavior of labour markets reveals a number of puzzling features for which there are no truly satisfying explanations … I believe that the major impediment to rational explanations for these phenomena lies in the classical treatment of labor as a purely variable factor … I propose a short-run theory of employment which rests on the premise that labor is a quasi-fixed factor. The fixed employment costs arise from investments in hiring and training activities.
Note that he was operating within the neo-classical tradition but recognising that the standard mainstream labour market model was unable to explain key factors regarding the cyclical behaviour of employment.
He went on:
Consider a firm faced by a decline in product demand. The adjustment process involves a reduction in output accompanied by a decline in the demand for each variable factor. There is no reason to expect that the demands for all variable factors will be decreased by the same proportion.
Firms thus will try to keep costs of adjustment to a minimum when faced with variations in their sales arising from fluctuations in aggregate demand. They first have to determine whether the variations are temporary (cyclical) or structural (that is, their product is no longer desired in the case of a downturn).
We can thus measure the labour input in terms of the number of persons employed or in terms of the total hours worked. If firms treated labour as a purely variable input (that is, did not perceive any hirining and firing costs to be attached to their workforce) then they will adjust their labour input by hiring and firing workers to meet the fluctuations in demand for their product.
The firms know that some skilled workers are costly to replace because it is likely they have job- and firm-specific skills that have been accumulated over time. Further, firms may encounter what are called reputation costs if they are seen as being capricious in a downturn.
Skilled workers have more sway in an upturn and will shun firms that provided unstable employment conditions in the downturn. Those firms then face higher longer-term costs as a result of saving wages in the short-run.
The upshot is that firms may choose to “hoard labour” in a downturn. Labour hoarding means that employers maintain workers during a recession above the levels required to maintain current production. The firms see this strategy as being an optimal longer-term approach to employment because it minimises costs over a longer period.
It allows the firms to avoid costly hiring and firing.
The degree to which firms hoard labour depends on the proportion of “skilled labour” (that is, labour with significant hiring and firing costs) and whether the firm thinks the downturn is cyclical or structural.
If it thinks there is a longer-term shift away from a particular product line etc (requiring certain labour skills) then the firm is less likely hoard labour.
The extent to which labour is hoarded at the national level depends on how the negative aggregate demand shock is distributed. That is, a firm can only hoard if it remains in business. When firms go bankrupt, the output adjustment is made totally in terms of lost jobs.
So labour hoarding occurs when employers do not adjust their labour demand in the same proportion as the change in demand for their products. That is, they choose to adjust hours of work rather than persons employed as a way of meeting the cyclical variation.
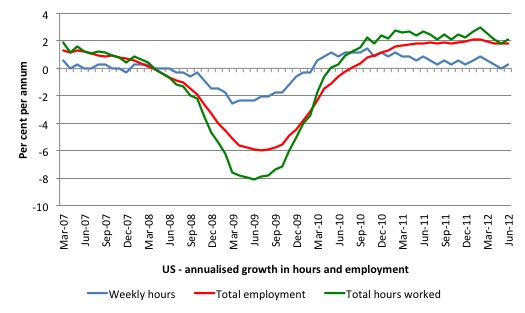
The following graph used BLS data and shows the annualised percentage change in total hours worked, average weekly hours worked, and total employment since March 2007 to June 2012.
While the recession led to a substantial drop in total employment, it is also evident that the working week was shortened on average as the economy faltered.
It is also apparent that firms are once again reducing average weekly working hours as the economy slows again.
One of the interesting aspects of labour hoarding is the resulting behaviour of labour productivity. One of the basic results that an undergraduate student takes (I don’t use the word “learn” in this context) from studying mainstream economics is that labour productivity is counter-cyclical – that is, it falls when employment (and output) rises. This result is derived from the assertion that there are diminishing returns to the so-called variable input (labour).
There was an interesting article in the Sydney Morning Herald this morning (July 9, 2012) – It’s stupid economists, people – by the economics editor Ross Gittins, that bears on the undergraduate economics model.
I often disagree with Ross Gittins but I found myself agreeing with this article.
He notes that:
Many people don’t realise the economics we hear from politicians, business people, economists and the media, morning, noon and night, is just one way of analysing how the economy works.
Almost everything we’re told about what causes what is inspired by the “neoclassical” model. It’s long been by far the dominant way of explaining why things happen and predicting what will happen, but it’s not the only way. And it’s far from infallible.
When I use the term mainstream or orthodox or neo-liberal in relation to economic theory I am usually referring to neo-classical economics and its modern variants – New Classical, New Keynesian etc.
Ross Gittins notes that “neo-classical” economics “abstracts from the role of ‘institutions’ – be they organisations, laws or conventions – in influencing market behaviour, so often leads economists to make policy recommendations that prove seriously misguided”.
He lists many examples of how a blind adherence to the “institution-free” market analysis delivers disastrous outcomes when applied as policy. I will leave it to you to read about them if you are interested.
The so-called law of diminishing returns is a key theory in mainstream economic analysis. It says that as the economy adds more workers to the existing stock of capital, the marginal productivity (that is, the extra output that the last worker added generates) declines and eventually becomes negative (workers falling over each other in the workplace and destroying output).
The theory is used to derive labour demand curves with the conclusion that to increase employment (at a given technology) the real wage has to fall (because firms are assumed to equate the real wage with the marginal product).
The theory is used to determine the income distribution between labour and capital such that in a competitive economy, all factors of production are claimed to receive their marginal products – that is, the argument is that they all get what they put into production. This theoretical result was developed to blunt the progress of Marxism in the second-half of the C19th.
Marx had shown categorically that workers are not paid according to their contribution to production and profits are the realisation of surplus value that is expropriated from the workers because the capitalist production process can force workers to labour beyond the time necessary to support itself. That ignited claims that capitalism was intrinsically unfair and workers could benefit by taking control of the capital themselves.
The mainstream marginal productivity position was that capitalism was fair because all productive inputs are paid in proportion to their productivity.
The problem is that the so-called law of diminishing returns is merely an assertion – designed to fulfill an ideological role (as above) and has not withstood empirical scrutiny. The distribution theory built upon the notion has also failed. The famous Cambridge debates in the 1960s and 1970s proved conclusively that the orthodox distribution theory was internally inconsistent.
One of the striking demonstrations that marginal productivity theory is out of kilter with the real world is the behaviour of labour productivity. Far from being counter-cyclical, labour productivity is strongly pro-cyclical. That is, it rises when economic activity is stronger and falls when it is weaker.
One of the signs of labour hoarding is that employment is less variable than real GDP growth so that economies experience pro-cyclical movements in labour productivity – that is, labour productivity (output per unit of input) rises when the economy is growing and falls otherwise.
Further, if firms hoard labour and partially respond to the cycle by adjusting hours, then we would expect a divergence between labour productivity measured in persons (output per person employed) and labour productivity measured in hours (output per hour worked).
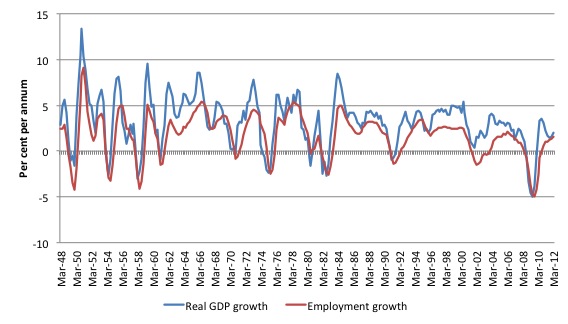
The following graph takes a longer perspective on annualised growth in real GDP and total employment in the US (from March-quarter 1948 to the March-quarter 2012). The real GDP data comes from the US Bureau of Economic Analysis.
Employment growth is clearly driven by real output growth, a major insight offered by Keynes etc. The turning points in the two cycles are very nearly coincident.
The data suggests, however, that employment fluctuations in the downturn are slightly larger or similar to real GDP growth fluctuations, which suggests that hoarding is a relatively minor part of the adjustment process in the US. For other nations that I have studied, employment growth is usually more muted in both directions than real output growth. Some more investigation is thus warranted to dig deeper into that result.
Also evident is the fact that employment grows more slowly out of a trough than real output – as firms adjust hours worked and wait for the recovery to consolidate.
So how has labour productivity behaved?
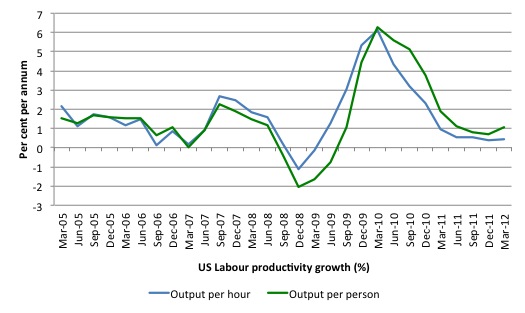
The following graph sows the annualised growth in labour productivity since the March-quarter 2005 up until the March-quarter 2012.
The blue line is labour productivty growth in hours (output per hour worked) and the green line is labour productivity growth in persons (output per person employed).
Both series are clearly pro-cyclical – a longer sample confirms that unambiguously. The procyclical behaviour of labour productivity per person occurs because employment fluctuations are lower than real output fluctuations over the business cycle.
It is a clear that as the US economy faltered in late 2007, firms were adjusting hours faster than persons employed even though the latter suffered a severe plunge. So there was some hoarding during that period.
As the US economy recovered somewhat on the back of the fiscal stimulus, firms increased persons employed more quickly than persons employed.
But as the US economy has slowed again (since 2010), labour productivity measured in hours has dropped faster than labour productivity measured in persons because employment growth has not been robust enough to offset the downward movement in average hours worked over this period.
Conclusion
The latest employment data shows that the US labour market is very weak. Employment growth, in both persons and hours has been flat for more than a year and is clearly not strong enough to eat into the huge pool of unemployed.
With the national election looming and the “fiscal cliff” idiocy certain to figure in the political debate the outlook is not that good.
If the government succumbs to the conservatives (the “fiscal cliff” scaremongering) and fails to endorse the continuation of the tax cuts and spending promises then it is certain the US economy will follow Europe down the drain.
Already, this recession has created records – the longest consecutive stretch of above 8 per cent unemployment. It will get worse unless there is renewed fiscal support for growth.
That is enough for today!
(c) Copyright 2012 Bill Mitchell. All Rights Reserved.


If the US somehow decided to dump its Central Bank and produce its own interest free Notes where would the wealth go ?
Bonds are not wealth ?
They are a metaphysical storage of that wealth.
So therefore the wealth would flow elsewhere – but where and to who ?
Is the US dependent on its CB to wage war on other countries so that it can remain in real goods defecit ?
You betcha.
So If we all dump the CBs it might work out.
But the first to jump is likely to get crucified by the boys.
The Banks have got us in a bind it seems.
Central banking has merely worked to centralise wildcat banking.
Its better wildcats produce their own paper rather then the coin of the realm – don’t you think ?
Its not the best situation – but surely its better then this !
Monopoly wildcat banking.
Central banking has been a failure (although a success for some)
The BoE claim that sovergins would save money via its 2 to 1 leverage ratio has been proven a sham.
I believe Wray mentioned Jackson positively in a article of his some time ago –
The seed of doubt into his Hamiltonian’s Brain case for just a second.
But now its gone .
Replaced by a misplaced faith once again.
Jackson was correct
But why was there a depression afterwards ?
I would suggest his failure was he did not produce greenbacks to fill the banks credit hole.
The MMT thing ( the treasuary and CB as essentially the same thing) has been proven to be false I am afraid.
The Central bank is the commercial banks big sister – nothing more.
True republics produce script only – we have been lead astray by these false Post Cromwellian republics.
They are nothing of the sort.
Its a fake.
The banks merely used the serfs as agents to destroy the Kings money power.
Filling their heads with nonscene.
Now the banks have become the Kings with full executive power as in the EU market state the wheel has turned full circle.
PS – we all know the US treasuary is owned by the NYFR and all other countries cheque books are owned by the local banking boys everywhere.
Its the Banks dummy.
They own everything.
Why not ?
They have been given goverment sanction to produce credit poison.
So they can buy all the stuff.
A Republic merely producing script would rise and fall based on open decisions in a forum.
But bank credit and the socialisation of its malinvestment
via sov debt afterwards !!!
Its just too much.
It cannot be managed via a pseudo – scientific MMT study that can only be understood by some.
The production of money must be kept as open & simple as possible.
The objectives of a central banks in most anglo countries is the same. It is to ensure currency stability and full employment. There is nothing wrong with the objectives and little that is particularly wrong with system. The car is not very broken it just has a few bad components and a lot of bad drivers.
It is the degree to which the CB’s are controlled by private corporate interests, self serving career politicians or the will of the majority that counts.
“The blue line is labour productivity growth in hours (output per hour worked) and the green line is labour productivity growth in persons (output per person employed)”
If the blue line represents output per hour worked, why does it fluctuate so much? Are the workers really varying their rate of work so much?
If the output is represented by the GDP, and given
GDP = C + S + T,
where these quantities are measured by the amount of money the workers pay and save, shouldn’t the output per hour worked be equal to one by definition?
Say’s Law. Still trapping young players after all these years.
helpful for me to write a book about the present world economy.