It was only a matter of time I suppose but the IMF is now focusing…
Eurozone policy makers destroying prosperity
In the last week, several major data releases have been published by Eurostat, culminating in yesterday’s release of the September unemployment which shows that the jobless rate has risen to its highest in the currency union’s history. There are now 18.49 million people in the Eurozone without work and that is the tip of the iceberg when it comes to assess the wasted production and lives that the fiscal austerity is creating. Just in the last month, a further 146,000 became unemployed. More than 25 per cent of available workers are unemployed in Greece and Spain. We have moved from describing this tragedy as a recession. This is now a full blown Depression of the scale of the 1930s travesty and, once again, its depth is a direct result of policy failure. All the indicators are coming together and providing an unambiguous verdict – that the Eurozone policy makers destroying prosperity and have relinquished any sense of capacity to govern, where that term means the capacity to advance public purpose and improve welfare.
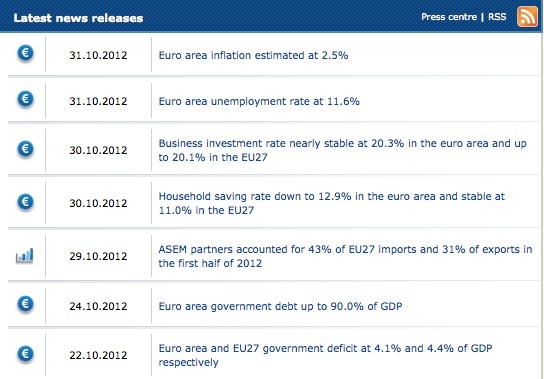
The following graphic is a capture of today’s (November 1, 2012) Latest News Releases at Eurostat. The juxtaposition of a listed items is very interesting (in an intellectual sense – tragic in a personal sense) and weaves a narrative that is very familiar to those who have read and understood Modern Monetary Theory (MMT).
There is no ambiguity at all in what the various data release headlines are signalling.
On Tuesday, Eurostat published their – Quarterly Sector Accounts – for the June-quarter 2012.
The data shows that the:
In the second quarter of 2012 compared with the first quarter of 2012, the household saving rate decreased in the euro area (EA17) while remaining stable in the EU27. The household investment rate fell in both the euro area and the EU27. In the euro area, household income per capita fell by 0.5% in real terms, after a decrease of 0.3% in the previous quarter.
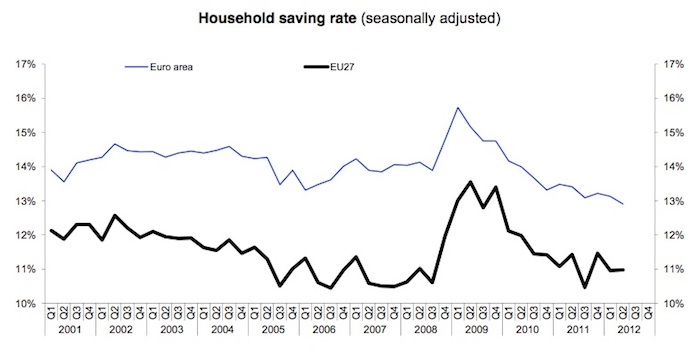
First, the decline in the household saving ratio. The following graph is reproduced from the Eurostat publication and compares the household saving ratio for the Eurozone and the broad EU27 block of countries.
Eurostat report that:
In the second quarter of 2012, the gross saving rate of households in the EU275 was 11.0%, stable compared with the first quarter of 2012. In the euro area6, the household saving rate was 12.9%, compared with 13.1% in the previous quarter
Notice that the rate was relatively stable prior to the crisis (and note this is a aggregate ratio – we know that in several nations the credit-fuelled housing binge was in full swing over this period).
When the crisis hit, households sought to decrease their risk by increasing their saving ratio overall. That is typical behaviour and was supported by the increasing deficits as the automatic stabilisers swung into play.
But once the policy environment turned sour in Europe and the Troika started bullying nations into introducing pro-cyclical fiscal adjustments – the anathema of sound policy management and the last thing that should have been done at that time – the saving ratios have nose-dived.
Why is that? The answer is simple. Saving is a function of national income and it is with fiscal austerity undermining economic activity and savaging income growth there is only one way for total private saving to go – down even if the intention, signalled by households in 2008, is to save more.
The flip side of the decline in the household saving ratio is the movement in the main private spending aggregates from the national accounts – household consumption and capital formation (investment).
Table 4 in the Eurostat Sectoral Accounts publication provides information that allows us to trace the movement in these aggregates.
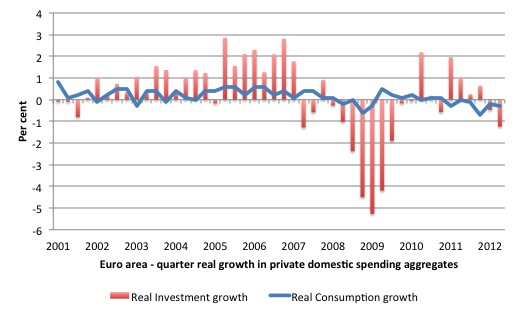
The following graph shows the quarterly growth in consumption and investment since the first-quarter 2001 up until the June 2012-quarter.
The sharp and enduring decline in private investment growth in 2008 into 2009 is a typical cyclical phenomenon. As spending growth dries up firms have no need to maintain growth in productive capacity and they become very cautious.
But what has happened in Europe is that both the major private components of aggregate demand ad now
simultaneously declining.
Private investment is now 16 per cent below the March 2007 peak and deteriorating further.
Remember all that blather from the Troika and their stooges in the financial press that private households and firms were refusing to spend because they feared that higher deficits would require higher taxes in the future and so they had to save now to pay for them?
This is the Ricardian Equivalence proposition that mainstream economists visited on us and told us it was just common sense.
Please read my blog – Pushing the fantasy barrow – for more discussion on why Ricardian Equivalence has never been a viable explanation of private spending behaviour.
And do you remember the interview – Interview with La Repubblica – that the then ECB President, Jean-Claude Trichet gave on June 16, 2010.
It represented the height of hubris then and his predictions have just made him look like a fool. Both criticisms are fair assessments given the way the evidence has unfolded.
He was asked whether the imposition of fiscal austerity was a “correct” strategy and whether the measures taken were “sufficient”. He replied:
The delicacy of the current situation requires credible measures, this is very important. It is necessary in order to correct divergent paths. Sustainable fiscal policies will help to consolidate the recovery. Governments have solemnly stated that they are aware of this need, and have decided to bring forward consolidation measures. But the credibility of their measures will be subject to constant scrutiny.
He was then asked whether there was a risk that the fiscal austerity measures he was championing would worsen the crisis – to which he said:
I don’t think that such risks could materialise. On the contrary, inflation expectations are remarkably well anchored in line with our definition – less than 2%, close to 2% – and have remained so during the recent crisis. As regards the economy, the idea that austerity measures could trigger stagnation is incorrect.
Which is now a comment that enshrines his stupidity, lack of judgement and lack of qualification for the position he held.
The interviewer, almost incredulous, asked him to confirm that he said “incorrect”. He responded:
Yes. In fact, in these circumstances, everything that helps to increase the confidence of households, firms and investors in the sustainability of public finances is good for the consolidation of growth and job creation. I firmly believe that in the current circumstances confidence-inspiring policies will foster and not hamper economic recovery, because confidence is the key factor today.
One person or firm’s spending is another person and/or firm’s income. There is no escaping that basic macroeconomic rule.
Mainstream macroeconomics has always been bedevilled with the problem of compositional fallacies, which are errors in logic that arise when we infer that something that is true at the individual level, is also true at the aggregate level. The fallacy of composition arises when actions that are logical, correct and/or rational at the individual or micro level have no logic (and may be wrongful and/or irrational) at the aggregate or macro level.
Keynes led the attack on the mainstream thinking at the time – mid-1930s – by exposing several fallacies of composition. Lets consider two famous fallacies of composition in mainstream macroeconomics: (a) the paradox of thrift; and (b) the wage cutting solution to unemployment.
The Eurostat data clearly demonstrates the paradox of thrift, which refers to a case where individual virtue can be public vice. If an individual or household attempts to increase the proportion that it saves out of their disposable income (income after tax) – the so-called saving ratio – then if they approached the task in a disciplined manner they would probably succeed.
There is an old saying – look after the pennies and the pounds will look after themselves.
So by reducing their individual consumption spending a person can increase the proportion they save and enjoy higher future consumption possibilities as a consequence. The loss of spending to the overall economy of this individual’s adjustment would be small and so there would be no detrimental impacts on overall economic activity, which is crucially driven by aggregate spending.
But imagine if all individuals (consumers) sought the same goal and started to withdraw their spending en masse? Then total spending would fall significantly and national income falls (as production levels react to the lower spending) and unemployment rises. The impact of lost consumption on aggregate demand (spending) would be such that the economy would plunge into a recession and everyone would suffer.
Moreover, as a result of the income losses it is highly likely that total saving would actually fall along with consumption spending so the economy as a whole would be saving less.
The paradox of thrift tells us that what applies at a micro level (ability to increase saving if one is disciplined enough) does not apply at the macro level (if everyone attempts to increase saving, overall incomes fall and individuals would be thwarted in their attempts to increase their savings in total).
Why does the paradox of thrift arise? In other words, what is the source of this compositional fallacy?
The explanation lies in the fact that a basic rule of macroeconomics, which you will learn once you start thinking in a macroeconomic way, is that spending creates income and output. This economic activity, in turn, explains how employment is generated. Adjustments in spending drive adjustments in total production (output) in the economy.
So if all individuals reduce their spending (by attempting to save) the level of income falls rather than stays constant, as would be the case if just one person reduced their spending.
As total saving (the sum of all household saving) is a residual after all households have made their consumption spending choices from the available disposable income then national income shifts, in turn, feedback on total saving. When national income falls, consumption falls and total saving will also usually decline in absolute terms.
The only way that an increasing desire to save can be accommodated without a decline in national income is if another injection of aggregate demand arises. But in the context of the crisis that injection could have only come from net public spending.
Firms had no incentive to increase their investment because not only could they supply all the goods and services being demanded with the current capacity but also as unemployment started to rise they would have formed the view that it was suicidal to outlay resources building productive capacity that might never be used.
Further, with all nations pursuing the same mindless policy direction – austerity – nations could not pick up demand growth from exports.
Conclusion – government deficits had to rise and substantially. The Troika’s response – re-read Mr Trichet’s hectoring statements above.
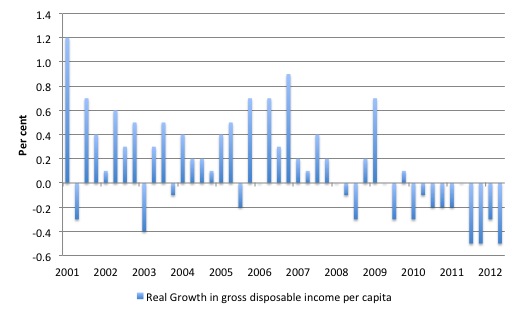
The following graph shows the real growth in adjusted gross disposable income per capita since the first-quarter 2001. The impact of the fiscal austerity and the recessed conditions in the last 2.5 years is clear.
It is little wonder that private consumption and investment are collapsing.
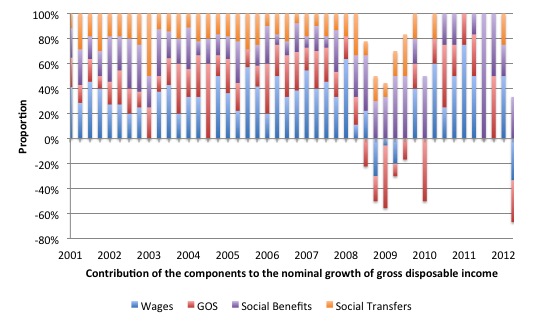
Interestingly, the Eurostat sectoral accounts provides information on the contributions of the components of gross disposable income to the nominal growth. The next graph shows these contributions.
To make the graph more readable I have left out taxes (which are mostly negative or zero) and Net property income. The remaining components shown are wages received Gross Operating Surplus and mixed income (so, mostly profits); Social benefits; and Social Transfers in Kind.
The graph is a 100-per cent stacked format. In the years leading up to the crisis the four components shown all contributed to growth in nominal gross disposable income, with solid contributions from wages (averaging 0.36 percentage points per quarter up until March 2008). Over the same period, profits contributed on average 0.23 percentage points per quarter; Net property income 0.11 percentage points; Social Benefits 0.21 percentage points; Taxes -0.11 percentage points; and Social Transfers 0.18 percentage points.
Since the second-quarter 2008 to the June-quarter 2012, Wages have contributed 0.07 points; Profits -0.04 points; Net Property income -0.02 points; Social Benefits 0.2 points; Taxes -0.04 points; and Social Transfers 0.08 points.
In the June-quarter, wages contributed -0.1 points; Profits -0.1 points; Net Property income 0 points; Social Benefits 0.1 points; Taxes -0.01 points; and Social Transfers 0 points.
The declining growth in real gross disposable income (absolute and per capita) is a combination of stagnant economic activity and deliberately imposed fiscal austerity, the latter now driving the former.
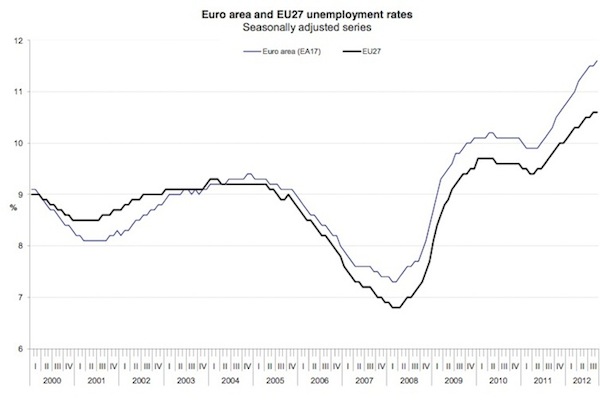
The upshot of all this policy vandalism is manifest in the fact that the unemployment rate in the Eurozone is at record levels (11.6 per cent) with no end to the rise in sight and Greece and Spain have topped 25 per cent – Depression-levels.
And all of this is deliberate.
The latest Eurostat – Labour Force publication – released yesterday (October 31, 2012) – jolts our memories.
There is a tendency to act like frogs in the pot of boiling water and ignore the rise from August to September in the Eurozone unemployment rate of 0.1 per cent.
But consider that in the last 12 months – five years in to recession – the Eurozone unemployment rate has risen from 10.3 per cent to 11.6 per cent.
Consider that in the same 12 months a further 2.145 million workers were made jobless by the Troika and its supporters. In the last month alone 146,000 workers became unemployed.
Consider that there are now 25.8 million workers in the EU27 who are unemployed now.
And this is before we consider the rise in underemployment and the fall in participation rates (that is, the rise in hidden unemployment).
The following graph shows clearly the impact of fiscal austerity. Notice the way it started to level off as the deficits started to rise and support some minimal levels of aggregate demand (particularly household consumption). Then the second-stage of the escalating unemployment rates came with the punitive withdrawal of net government spending and the attacks on workers wages and conditions.
Last week (October 22, 2012), Eurostat published the latest – Public Finance – data for 2011.
We learn from that publication that the public debt ratio (debt/GDP) rose between 2010 and 2011 despite the fiscal austerity carving into government expenditure and pushing tax revenue up.
Two days later, they published the latest – Public Debt – estimates for the June-quarter 2012.
The public debt ratio has risen from 87.1 per cent to 90 per cent over the last 12 months and overall public debt levels have risen by some 389,853 million Euros.
Now, from a Modern Monetary Theory (MMT) perspective these movement, of themselves, are of no interest. But when you understand why the ratios and levels are moving in the direction they are, then you realise that the policy makers are caught up in a self-defeating and vicious cycle.
Even though interest rates are low, real GDP growth is collapsing faster than they can reduce the primary budget balance (the non-interest component).
At the end of each year, all this policy stance yields is higher unemployment, lower real incomes, lower saving and rising public debt.
he UK Guardian (October 31, 2012) article – Eurozone unemployment: what the economists say – canvassed opinions from economists (although the sample was extremely biased towards financial market economists)s. The opinions will not surprise you in that sense.
The most interesting tangle of logic was this:
… with recession approaching eurozone governments are facing a similarly difficult time in reducing their debt burden. The debt to GDP ratio of the currency union has now reached 90.0% … it illustrates a general point that it is difficult for the public and the private sectors to reduce their debt burden at the same time. Only large export gains could provide sufficient demand in this situation to keep the economy afloat, but with emerging markets slowing and both Japan and the US sliding towards their own sovereign debt crises there is no realistic prospect for that to happen.
So the economist was travelling well as he more or less articulated the sectoral balances framework that tells us that without a major increase in the external surplus, the private domestic sector and the government sector cannot simultaneously run surpluses and reduce their debt levels.
There was also a recognition that coordinated austerity chokes all sources of spending and national income growth. National income growth is a necessity if private saving ratios are to rise and be sustained at the higher levels.
But then the commentator demonstrated that he (it was a male) didn’t really get the problem – choosing to invoke the myths that the term “sovereign debt crisis” is applicable to currency-issuing nations such as Japan and the US.
Neither country is sliding towards any sort of public debt crisis. They can always service their liabilities in their own currencies without question.
The Eurozone states are different because they effectively use a foreign currency – the Euro. Only the ECB can provide the necessary surety to prevent private bond markets undermining the capacity of the member states to access funds – and, well, the ECB has been led by the likes of Jean-Claude Trichet!
Conclusion
It is not often that the Eurostat headlines bring the full story together in a few data releases as is shown in the introductory graphic.
But as each new data release comes out in Europe, it becomes obvious that fiscal austerity is not only failing on its own terms (that is, in terms of its own objectives) but also leaving a scarred social landscape that many nations will struggle to ever recover from.
Announcement
On Tuesday, November 20, 2012 my research centre will be running a workshop on the role of employment guarantees in economic development with an emphasis on Timor Leste.
The UNDP TL mission economist DR Daniel Kostzer, who was the architect of the Head of Households program in Argentina, will be my guest. I will also give a talk.
The Workshop will be held in the afternoon at the Casuarina Campus of the Charles Darwin University, Darwin. All are welcome and there will be no charge for attendance.
A more formal announcement will be made in the coming week.
That is enough for today!
(c) Copyright 2012 Bill Mitchell. All Rights Reserved.
Dear Bill
Regarding the paradox of thrift, there is one thing that I have never understood, and that is: why is the initial savings rate at a given point in time OK but an increase on it bad? If the savings rate goes up from 10% to 15%, then we may get a recession. But why is the 10% not a problem? After all, 10% is higher than 5%, and 5% is higher than 0%. Doesn’t the argument of the paradox of thrift really imply that the savings rate should be zero at all times?
Regards. James
Dear James Schipper (at 2012/11/01 at 20:49)
It is a good question. Remember though that the saving ratio is a ratio of two flows – non-consumption out of disposable income and GDP. So it is the change in
the relativities of the flows that requires some other spending source to change as well in the opposite direction to stop national income from changing.
It might be that the level of national income that these changes emanate from is not desirable – for example, there might be mass unemployment already.
Then the point is that an attempt by the households to all increase their saving ratio will cause the bad situation to become worse unless the loss of spending
is offset by another one of the national expenditure components.
best wishes
bill
Europe is the plantation owners house.
The rest of the world is the plantation.
The owner is trying to free up now scarce capital by reducing the input costs to his domestic servants in Europa house.
The domestic servants wish to continue with this arrangement despite the new hardship as they know no other life.
Everything everything flows back to 1648.
Great article
Bill,
“When national income falls, consumption falls and total saving will also usually decline in absolute terms.”
This seems reasonable, but is there an ambiguity in the phrase “total saving”? Are you referring to 1) the total amount that has been saved declining or 2) the act of saving itself declining, the former declining because people are dipping into their ‘savings’ even while consuming less because their income has declined? This Q is more baroque than I meant it to be.
Bill, I didn’t phrase the Q well. Sorry.
Thanks to seafoid of the Irish economy blog for this instant classic from Private Eye.
“The IMF has warned that the austerity cuts it said were essential to escape economic meltdown have caused an economic meltdown. “Having studied the effects of 2 years of austerity we now conclude that austerity leads to austerity in the countries that implement it”, said an IMF spokesman.
Downgrading its growth forecasts from “abandon all hope ye who enter here” to “bring out your dead” the IMF said that more austerity measures would be needed to combat the austerity measures that have led to austerity throughout the region.
“It’s only through a fresh round of austerity that Britian and Europe can hope to escape from the misery caused by the first round of austerity””
Dork – once you realise that the ECB & IMF sees Europe as a base of operations rather then a collection of semi national economies (pre 1986 ~) things begin to make more sense.
Euroland & the UK has been exporting its capital base and earning a global wage arbitrage rent from these capital exports for a long long long time.
When the now fully globalised banks came back to shit in the nest post 2007 the former national goverments had forgotten what a national goverment was supposed to do.
Domestic house servants don’t pick cotton too well.
South Africa’s work program in the news
http://www.bbc.co.uk/news/business-20125053
This blog is depressing; I’m surprised you can keep an even keel when confronted with all this bad news. What signs, if any, can the optimist take cheer from? The work programmes in India and various other countries?
As you’ve said time and time again, political discourse is dominated by bogus economics that dates back to the gold standard and the false analogy with households. It’s easy to blame politicians for this. On the other hand, if everyone’s economic training taught them better, maybe the politicians wouldn’t be so awful. (Is a mass-unemployment depression really in anyone’s interests?)
Is there any reason for hope when it comes to economics education? I know you’re doing your bit, but at a large scale, is there any encouraging news in the world of economics training?
Sorry to depress you even more Michael but check this out:
[BILL NOTES: I deleted a link to an advertisement which was for a well-known conference in Australia that features the neo-liberal establishment and has sessions on restoring the balance – which was about the urgency of surpluses etc. You get the message]
Getting a lot of press too, sadly.
Hi Bill,
First, thanks for all the effort you put into this blog – much appreciated by this European.
In your chart showing declines in Gross Disposable Income Per Capita, should I read 2012 as 0.5 + 0.5 + 0.3 + 0.5? And should I read that as an addition to 2011’s 0.7? I mean, is it correct that for every £1,000 of spending money Ms. or Mr. Average European had in 2011, s/he now has only £975?
@The Dork of Cork
I enjoyed the Private Eye quote. Help an ignoramus out. What happened in 1648?
P.S. I am very much not an economist.
Dear ahji (at 2012/11/03 at 11:38)
Thanks for your comments.
The quarterly growth in real gross disposable income per capita from March 2011 were -0.2, June 2011 0, September 2011 -0.5, December 2011 -0.5, March 2012 -0.3 and June 2012 -0.5 per cent.
If you started at the beginning of 2011 with 1000 Euro per capita, I calculate that you would have 980 euros now given that evolution.
Of-course millions have gone experienced large real disposable income losses from unemployment and austerity attacks on wages and pensions. Others, given inequality is rising, have probably gained some.
best wishes
bill
@Dork of Cork, can you please give the issue number and date of Private Eye from which you quoted?
Thanks in advance.
And I agree with the label ‘instant classic’.