Today (April 18, 2024), the Australian Bureau of Statistics released the latest - Labour Force,…
Bias towards low-pay job creation in Australia accelerates
The other day – in this blog – The British agenda to bring workers to their knees is well advanced – I considered the recent British Trades Union Congress (TUC) report (July 12, 2013) – The UK’s Low Pay Recovery – which shows that “eighty per cent of net job creation since June 2010 has taken place in industries where the average wage is less than £7.95 an hour”. The Report also showed that the middle-pay jobs were being shed and the bifurcation in the British labour market between an increasing number of (self-employed) low-paid jobs with precarious working conditions and future and the high pay jobs, which seemingly avoided much of the negative impacts of the recession, has intensified. The middle in Britain is being hollowed out and replaced by an increasing number of low paid workers. In Australia, 84 per cent of jobs created in the last 6 months have been part-time and underemployment has risen since February 2008 (the low-point in the last cycle) from 666.3 thousand (5.9 per cent) to 908.6 thousand (7.4 per cent). The question I look at in this blog, is the wage impacts of these employment trends in Australia. Are we also seeing the same hollowing out as is clearly occurring in Britain. Of those 84 per cent of jobs, what proportion are low-paid, medium-paid and high-paid. Clearly, if most of them are at the bottom end of the wage distribution then the raw figure of 84 per cent sits on top of an increasing disaster for the prosperity of working families.
The data for hours worked and the distribution of earnings is available from the ABS publication – Employee Earnings and Hours, Australia – which is an bi-annual release. The latest edition is for May 2012.
The industry employment data is from – Table 05. Employed persons by State and Industry – which allows a breakdown between full-time, part-time and total employment. The industry employment data is original (that is, not seasonally adjusted).
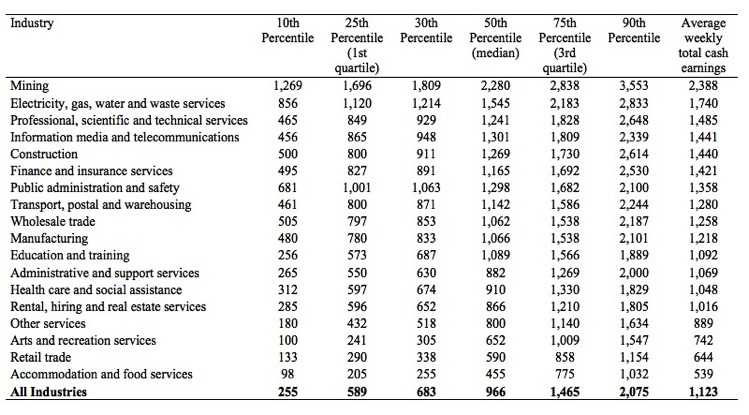
The following Table shows a summary of the wage distribution (as at May 2012) by industry sector in $A per week. The industries are ranked from highest average total cash earnings to lowest. The British study used hourly earnings by industry.
For reasons relating to compatibility of data provided by the ABS (matching employment with hours worked information), it is not really possible to come up with a reasonable estimate of hourly earnings. So I used average weekly total cash earnings by industry. The results will not vary all that much as a result of this pragmatic choice.
I decided to use the 30th Percentile as the cut-off for the definition of a low-pay sector (the TUC study used the 25th Percentile or the first quartile). The average for All Industries at the 30th Percentile is $683 per week.
As you can see from the Table Retail trade ($643) and Accommodation and food services ($538.80) are the industries below that overall average.
If I had restricted the low-pay industries to those whose average weekly total cash earnings were below the 25th Percentile for All Industries then only Accommodation and food services would be included.
The high-pay industries (those whose average weekly total cash earnings are above the 75th Percentile of the overall distribution – $1,465) are Mining ($2,388.20); Electricity, gas, water and waste services ($1,740.00) and Professional, scientific and technical services ($1,485.20).
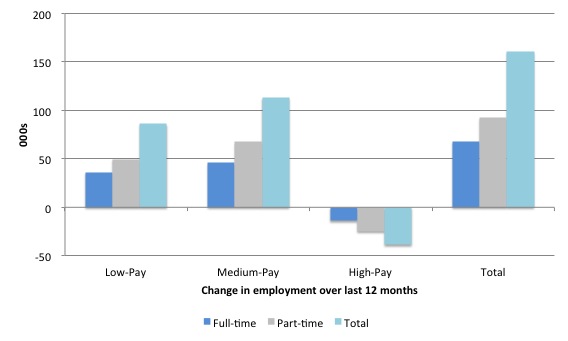
The first graph shows the change in total employment (in thousands) over the last 12 months by the three industry pay categories (low, medium and high) and by status (full-time, part-time, and total).
Of the 160.6 thousand jobs created in total (which amounted to a 1.4 per cent annual growth rate – fairly subdued by any standard), 86.1 thousand were in the low-pay sectors and 113.3 thousand were in the medium-pay sectors with an absolute contraction of 38.8 thousand in the high-pay industries.
The domination of part-time work is also evident, which is a point I will return to later.
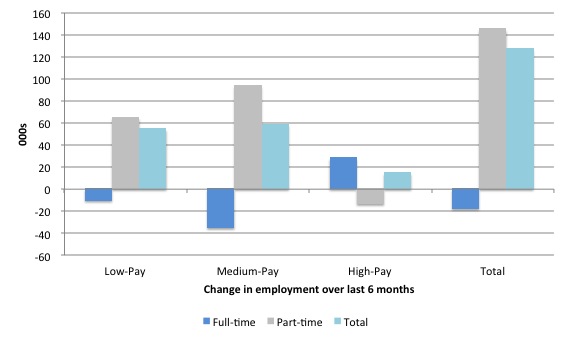
The second graph shows the same change over the last 6 months, a period that the move to part-time employment and casualisation has intensified as the slowdown in the economy has accelerated and job opportunities have dried up.
Please read my blog – Latest Australian vacancy data – its all down to deficient demand – for more discussion on the shrinking demand side of the Australian labour market.
Don’t be confused by the scale on the vertical axis between the two graphs. Here we observe that there has been an absolute contraction in full-time work overall (except for the gains in the high-pay sectors).
Further, there is a growing number of jobs being created in the low-pay sectors relative to the medium-pay sectors.
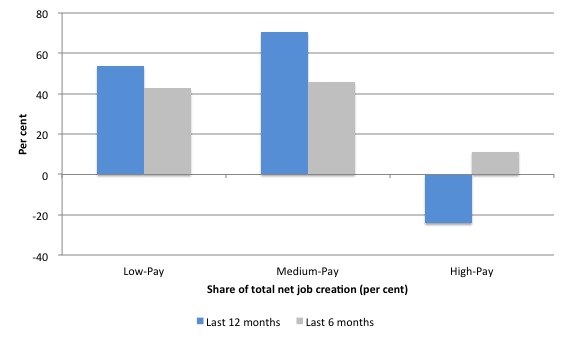
The next graph shows the share in total net job creation by pay sector over the last 12 months and the last 6 months. 53.6 per cent of the total change in employment were created in the low-pay sectors over the last 12 months, 70.5 per cent in the medium-pay sectors and a contraction in the high-pay sectors.
Over the last 6 months, 42.6 per cent of the total change in employment has been in the low-pay sectors, 46 per cent in the medium-pay sectors and 11.4 per cent in the high-pay sectors.
The proportion of employment change in the low-pay sectors is much greater than their overall share in total employment, which means that the share in total employment has grown over the last year.
But the situation in Australia does not appear to be as dire as the austerity-burdened UK economy although the Australian labour market is heading in the same direction.
The next graph attempts to shed light on the part-time share in total employment changes within each of the identified pay sectors (and total).
So over the last 12 months, of the total change in low-pay employment 57.8 per cent were part-time. The corresponding figure for medium-pay sector jobs is 59.6 per cent and 63.9 per cent for the high-pay sector jobs. In total (using the non seasonally-adjusted data) 57.6 per cent of the total employment change over the last 12 months was part-time.
We conclude there is a bias towards part-time work, which means that within each pay sector there is a bias towards job creation at the lower end of the wage distribution (lower Percentiles). That suggests that the average result discussed above understates the decline in working outcomes in the Australian labour market over the last 12 months.
There is a bias towards low-pay sector jobs but within each sector there is a bias towards lower paid positions in the wage distribution.
The situation gets worse if we consider what has happened over the last 6 months. Here the proportion of part-time employment in the total employment changes within each pay sector rises substantially. The above 100 per cent outcomes reflect the loss of full time employment in all but the high-pay sectors.
So there has been an acceleration towards wage outcomes at the lower end of the wage distribution within the two lowest pay groups in the last 6 months. Further, conditions have improved within the high-pay group as full-time employment has increased and part-time employment decreased. So the polarisation of the labour market intensified over the last 6 months as the economy has slowed.
The question that then arises is what sort of jobs are being produced in the medium-pay sectors? You will note from the initial table that there is significant variability in the average weekly total cash earnings across these sectors at all percentiles showed. Some of the medium-pay industries are relatively close to being low-pay sectors (for example, Arts and recreation services; Other services) in the sense that their overall average is below the median of the overall distribution.
It turns out (I am running out of time) that around 19 per cent of the total jobs generated over the last 6 months within the medium-pay sectors are in those two industries. But there is a trend towards jobs being generated in sectors at the bottom of the wage distribution within the medium-pay sectors and towards part-time work within each medium-pay sector.
Conclusion
This blog has explored the patterns of employment change by industry within Australia in recent periods by pay sectors. These pay sectors were aggregated with reference to their relative standing in the wage distribution.
The evidence suggests that the situation in Australia is not as dire as that which the British Trade Union Congress Report has demonstrated for the UK.
However, the trends are the same with a growing proportion of jobs being created offering only part-time status (and rising underemployment) and a bias towards low-pay jobs.
That is enough for today!
(c) Copyright 2013 Bill Mitchell. All Rights Reserved.


Dr. Mitchell,
Have you found teaching at CDU more rewarding than Newcastle?
What you describe is also taking place in the UK, as I know you are aware. But of course, unsurprisingly, the govt spin is that it shows a decrease in unemployment due naturally to their economic policies. This is all before the projected sacking of thousands of public service workers slated for the near future.
And the response by ministers to public attacks on their persistent lying is becoming imbecilic. Duncan Smith’s latest is that he believes he is right. Well, David Icke may well believe that we are being controlled by alien lizards. So what? Mere belief in itself has never been a sufficient justification for asserting that something you have said is true. I am uncertain how to characterize what these ministers are engaged in, as opposed to what they think they are engaged in.
My thinking nowadays is always conditioned but an underlying awareness of unsustainable trends. Whenever I see a trend, I ask myself, “Is it sustainable?”
The trends to;
1. Increasing profit share of the economy,
2. Decreasing wage share (the corollary of 1),
3. Increasing part time and insecure work,
4. Increasing numbers of people making incomes in the lower percentiles,
are all unsustainable trends in the long term. Since the long term trend, if extrapolated all the way, is towards workers living on nothing, therefore it cannot continue indefinitely. These trends must eventually halt and very possibly reverse. We have to ask ourselves what will happen at that juncture? It will be a key juncture with significant disruptions I would think.
Why do neoconservatives think they can keep pushing one way for ever (ever lower wages, ever more damage to the environment)? Don’t they realise it cannot go on like this?