It's Wednesday and I discuss a number of topics today. First, the 'million simulations' that…
US government sector is keeping unemployment high
There was an article in the Atlantic yesterday (November 5, 2013) – How Washington Is Wrecking the Future, in 2 Charts – which reports in a related article in the UK Financial Times (November 3, 2013) – US public investment falls to lowest level since war. The essence of the articles is that the political landscape in the US has undermined the US President’s plans to spend more of public “infrastructure, science and education” which will undermine the future growth potential and prosperity of the US economy. A Bloomberg article (November 6, 2013) – Don’t Blame Congress for Cutbacks in Public Investment – criticised both analyses on the grounds that the cutbacks are relatively small and the culprit is state and local government in the US rather than the federal government. There is truth in both sides but neither really grasps the nettle and considers the cutbacks in government spending in the context of what is going on in the non-government sector. The cutbacks in public spending in the US over the last three years are unnecessary (financially) and the fiscal drag is keeping unemployment high and increasing the poverty rates.
For clarity, the non-government sector is not an equivalent term for the private sector (households and firms). The non-government sector is the sum of the non-currency issuing parts of the economy and includes the private domestic sector (households and firms) and the external sector (exports and imports).
The Financial Times article (which the Atlantic article just puts a spin on) states that:
Public investment in the US has hit its lowest level since demobilisation after the second world war because of Republican success in stymieing President Barack Obama’s push for more spending on infrastructure, science and education.
Gross capital investment by the public sector has dropped to just 3.6 per cent of US output compared with a postwar average of 5 per cent, according to figures compiled by the Financial Times, as austerity bites in the world’s largest economy.
The data is provided by the – US Bureau of Economic Analysis – and so the FT might have better stated that they manipulated the public data rather than suggesting they “compiled” the figures. A small point.
The facts:
1. The average from the first-quarter 1947 to the June-quarter 2013 for Total Government Gross Investment is 5 per cent of GDP.
2. The averages for the federal government overall was 2.7 per cent of GDP; for federal defense investment spending 1.8 per cent of GDP; for federal non-defense 0.8 per cent of GDP; for State/Local 2.3 per cent of GDP and for the private sector 17.2 per cent of GDP.
3. The current investment ratios (at June 2013) are: Total government 3.63 per cent; federal government 2.7 per cent of GDP; federal defense 0.96 per cent of GDP; for federal non-defense 0.7 per cent of GDP; for State/Local 1.97 per cent of GDP and for the private sector 15.7 per cent of GDP.
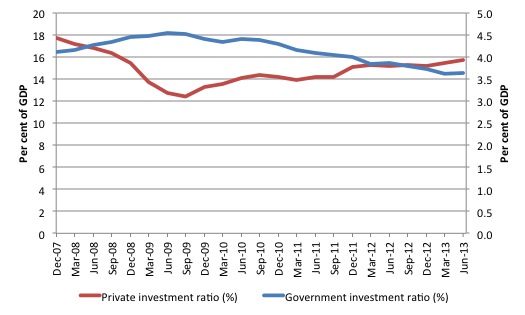
The following graph shows the evolution of the investment ratios for the total US government sector and the private sector since the December-quarter 2007 (the real GDP peak before the crisis).
It is clear that both have fallen (the federal ratio by 0.5 points and the private ratio by 2.1 points), although the latter is on the upward move, albeit very slowly indeed.
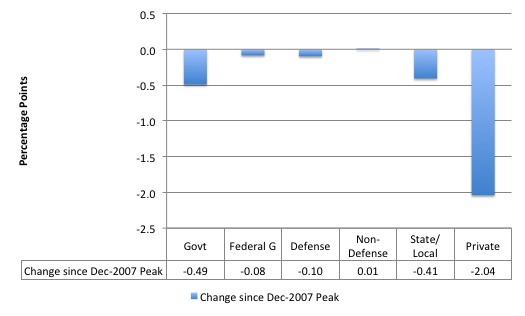
To put this “recovery” period in context, the next graph shows the change in investment ratios since the December-quarter 2007 in the US by Government and Private and then breaking the government down into Federal (total, defense and non-defense) and State/Local.
The results tell us that while the investment ratio for the Federal government has declined in this period (all because of a decline in the defense investment ratio), the overwhelming fall in investment spending as a proportion of GDP have been at the State/Local level.
So the Bloomberg article’s conclusion that the culprits are local governments is accurate. This does not, however, mean that the FT conclusion that the Republican maniacs in the US Congress are to blame for slow growth in the US.
It is clear that the austerity at the federal level (measured here as the decline in investment ratios) is being driven by the extreme right-wing in US politics coming up against a neo-liberal infested “centre” (Democrats and less manic Republicans) with no major faction in the US pushing for major increases in fiscal deficits at the Federal level.
The FT article argues the the Republicans in the US Congress will block the current plans to substantially increase federal investment spending. The figures they attribute to the chairman of the Council of Economic Advisers do not add up given the data but that is another matter.
More significantly, there has been a significant reduction in the overall public spending ratios (consumption and investment) in the US in recent years.
The Atlantic article says:
Rand Paul may not have noticed, but we’ve actually cut quite a bit of spending the past three years. Unfortunately, though, we’ve only cut quite a bit of the best kind of spending. Things like infrastructure, schools, and scientific research. The kind of things the economy needs to grow, but the private sector won’t invest enough in.
Note here that the Atlantic is talking a “cut quite a bit of spending” rather than declines in spending ratios. The two are, of-course, quite different.
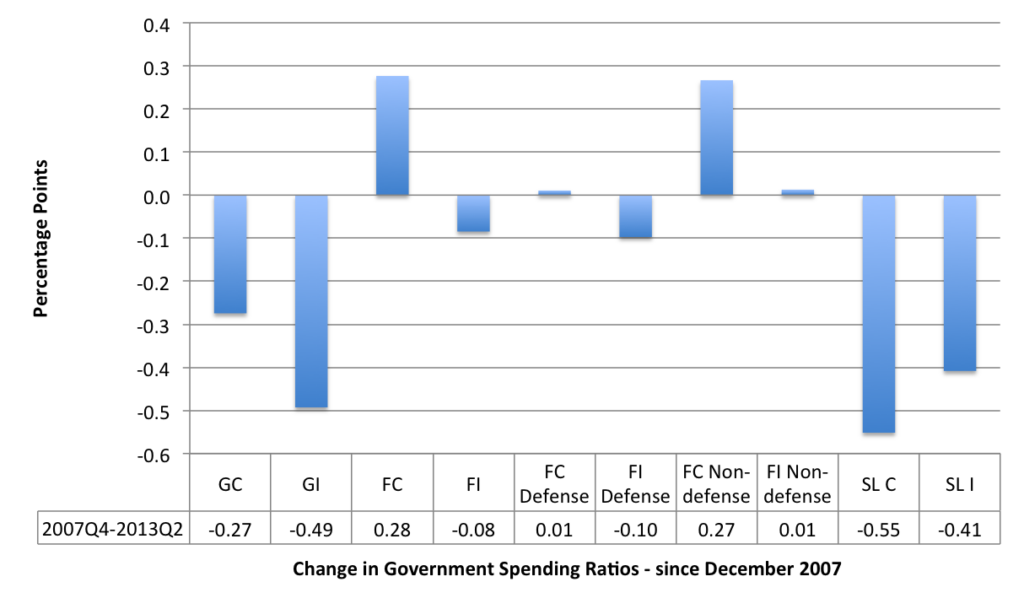
The following graph relates to the facts about the spending ratios.
It shows the change in the spending ratios (% of GDP) from the December-quarter 2007 to the June-quarter 2013 for total government consumption (GC), total government investment (GI), federal consumption (FC), federal investment (FI), federal consumption for defense (FC Defense), federal investment defense (FI Defense), federal consumption for Non-defense (FC Non-defense), federal investment Non-defense (FI Non-Defense), State and local consumption (SL C) and State and Local investment (SL I)
1. Total government spending ratios have fallen by 0.77 percentage points – split between a 0.27 points decline in consumption spending ratio and a 0.49 points decline in the investment ratio. So both components of government spending have fallen relative to GDP.
2. The federal consumption spending ratio has risen by 0.28 points (mostly in non-defense) while State/Local consumption ratio has fallen by a substantial 0.55 points.
3. The federal investment ratio has fallen less (0.08 points) compared to the dramatic fall in the State/Local investment ratio (0.41 points).
4. The policy austerity in the US, if defined in terms of cutting back, has been driven by the balanced budget rules that operate at the State/Local government level.
But that doesn’t really let the federal sphere off the hook. While there are significant Federal to State/Local fiscal transfers operating in the US, as there should be in a Federal system, there was a crying need in 2008-09 for increased federal spending to allow the State/Local governments to avoid the significant retrenchment of public service delivery.
In other words, the federal spending ratios should have risen substantially more than they have over this period. The politics in the US Congress prevented that from happening (coupled with the neo-liberal mindset of the Obama Administration).
But do not think that because the spending ratios have fallen total spending has fallen (which is the allegation in the Atlantic article). A ratio is comprised of two numbers – the numerator (in this case some measure of public spending) and a denominator (in this case, nominal GDP).
A declining ratio might mean the numerator is falling in absolute terms (spending cuts) or just failing to keep pace with the growth in the denominator.
The following Table summarises the shifts in the main National Accounts aggregates (in absolute value and percentages) from the June-quarter 2010 to the June-quarter 2013 – that is, the last three years (as per the Atlantic time period statement).
I have decomposed the government sector into federal (defense and non-defense) and state/local.
So the Atlantic’s claim that “we’ve actually cut quite a bit of spending the past three years” (referring to public spending) is somewhat accurate. While GDP has grown by 12 per cent overall during this period it has been driven by private consumption and investment spending and a small reduction in the net export drain.
Public spending has fallen by 1.9 per cent, which is fairly modest in one sense. But in the sense of what is required given the other aggregates, this is a substantial contraction.
It is clear though, that over this period, the contractions have been at the federal level (all driven by cuts to defense spending) with modest cuts continuing at the State/Local level.
In that sense, the US Congress is to blame (which means the attempt by the Bloomberg article to absolve the Republicans of any blame is not justified).
Conclusion
I did think the Bloomberg conclusion was reasonable though laced with neo-liberal bias:
This isn’t to say that the government should continue to cut spending, much less raise taxes. Even wasteful investments put money in people’s pockets today.
Any spending is warranted.
But the bias towards thinking that all the government can do is boondoggle. That suggests the author has a lack of imagination. It doesn’t take much of that to realise the significant potential for very productive public spending in the US.
First – a Job Guarantee.
Second – significant urban renewal.
Third – fix up the public education sector.
Fourth – fix up the environmental decay.
Fifth – get rid of private health insurance industry and introduce a truly universal public health system.
And that is just for starters.
That is enough for today!
(c) Copyright 2013 Bill Mitchell. All Rights Reserved.


Bill, Except for modifications of the last item in your list at the end, these apply to Britain as well. If Gove gets to finish his hatchet job, the secondary school sector will be intellectually dismembered. Lansley is doing his best, which isn’t very good, to destroy the welfare and benefits system. Urban renewal now consists of tearing down former public housing projects that were allowed to kind of rot and replacing them with market valued properties along with even more expensive, and less extensive, public housing that current occupants will not be able to afford. We are apparently traveling back in time.
Prof, why not just keep the budget deficit high enough to maintain unemployment at less than 2%? That would be a de facto job guarantee like during World War II.
@Benson ~
The purpose of the job guarantee is to avoid wage inflation. The job guarantee is specifically designed to avoid competition for employees between the guarantee program and the private sector. All other things being equal, workers will prefer private sector jobs over guarantee program jobs because private sector jobs pay (at least a little) more.
A buffer stock of jobs is the way forward – the perfect first step. By eliminating unemployment, the government gives a voice to everyone, not just the wealthy. People can make meaningful spending decisions which can impact all of the other points on your list. When people are below the poverty line, they are struggling to meet their physiological needs – higher needs that contribute to society fall way behind!
“Public spending has fallen by 1.9 per cent, which is fairly modest in one sense. But in the sense of what is required given the other aggregates, this is a substantial contraction.”
Is this statement consistent with this comment?
“It would be splendid if the US were able to shake off the biggest fiscal squeeze since post-Korea demobilisation in the 1950s. If that were to occur it would be a massive vindication of QE, evidence that monetary stimulus can overpower fiscal contraction. As an amateur monetarist, I would relish this (friendly) defeat of the Keynesian camp, those apostles of fiscal primacy.
My fear is that the Keynesians will be proved right yet again. You cannot tighten quite so violently in an anaemic economy without consequences.”
http://blogs.telegraph.co.uk/finance/ambroseevans-pritchard/100025218/can-the-world-cope-with-a-trigger-happy-fed/