I have received several E-mails over the last few weeks that suggest that the economics…
Why we have to learn about the NAIRU (and reject it)
I have very little time today to write, first a very long flight and then preparation for a major release tomorrow of our latest Employment Vulnerability Index (EVI), which measures the risk of localised communities in Australia of unemployment as the economy slows. We have a very neat mapping tool and I will write about that tomorrow once the press launch occurs (first thing). But I am also working on various other papers and, as usual, have become immersed in the Phillips curve. I remember when I first started by PhD at the University of Manchester in the early 1980s, my then supervisor said to me on the first day that once I started modelling inflation and unemployment (the Phillips curve) I would never stop. Among other truths he uttered during my time in that dank part of the world that statement was spot on. Every now and then I return to the topic and update, revise, re-create and (sometimes) even innovate. So today’s blog is just a collection of snippets of the more accessible things I have been working on over the last few days. It starts with a graph that appeared in the IMF’s World Economic Outlook in April 2013. Then follow the graphs. Conclusion: The NAIRU as estimated is a very dangerous concept for the well-being of ordinary people.
You should read this rather discontinuous blog in tandem with these blogs – The dreaded NAIRU is still about! and Structural deficits – the great con job!.
They provide more detail of the motivation for being worried about these concepts.
Full employment as genuine policy goal was abandoned with introduction of the natural rate hypothesis (NRH) in the late 1960s and its assertion that there is only one unemployment rate consistent with stable inflation.
In the NRH, there is no discretionary role for aggregate demand management and only microeconomic changes can reduce the natural rate of unemployment.
If governments tried to reduce the unemployment rate below the so-called natural rate, then inflation would accelerate and the attempt to reduce the unemployment would be self-defeating.
Accordingly, the policy debate became increasingly concentrated on deregulation, privatisation, and reductions in the provisions of the Welfare State with tight monetary and fiscal regimes instituted.
The result has been that high unemployment persisted in most nations even prior to the most recent meltdown associated with the GFC.
There are many reasons why the natural rate hypothesis is untenable and in our 2008 – Full Employment abandoned – we examine them in detail.
But the idea of a cyclically-invariant steady-state unemployment rate persisted in the form of the NAIRU concept, first introduced to the economics literature in 1975. The literature was poorer for the effort.
The NAIRU is the Non-Accelerating Inflation Rate of Unemployment and is the unemployment rate associated with stable inflation.
The authors (Franco Modigliani and Lucas Papademos, the latter showing up in modern day Greek politics as a stooge for the Troika) said that a NAIRU existed:
… such that, as long as unemployment is above it, inflation can be expected to decline.
Various theoretical structures support this conclusion, ranging from simple excess demand models with mark-up pricing to Marxist-inspired models where inflation arises due to incompatible claims on existing real income.
Whatever theoretical underpinning is used, the conclusion is simple: there is only one cyclically-invariant unemployment rate associated with stable price inflation.
The NAIRU concept has dominated macroeconomic policy making in most OECD countries since the late 1970s and the “fight-inflation-first” strategies have exacted a harsh toll in the form of persistently high unemployment in the 1980s and 1990s.
The reason we should all learn about it still is because it is a major plank in the justification for imposing fiscal austerity on highly recessed nations.
How so?
Simply that for the neo-liberals (mainstream economists) the NAIRU defines the full employment unemployment rate. So if the actual unemployment rate is equal to the estimate of the (unobserved) NAIRU, then the economy is said to be operating at full employment.
This definition of full employment is divorced from any notion that there has to be enough jobs available to meet the desires of the available labour force.
So in using this concept (the NAIRU), governments have been able to turn their failure to provide enough jobs into a success. Why a success? Because the mysterious NAIRU just happens to be estimated in a way that ensures it tracks the actual unemployment rate, which means that full employment is never far away. Remarkable idiocy – but then we all believe it when our politicians bring out the graphs and tell us all is well
Well, at least those who are not unemployed believe it.
But it gets worse and this relates to the link with fiscal austerity.
The NAIRU is an intrinsic part of the way in which central banks, treasuries, multilateral agencies such as the IMF and the OECD measure the so-called structural budget deficit.
We know that the actual budget outcome that is recorded at various times is an ambiguous measure. The budget outcome is determined by the state of overall activity and is, largely, beyond the control of government. If private spending is weak then the deficit will typically rise as tax revenue declines irrespective of what government does.
The endogeneity of the budget militates against the use of arbitrary and rigid fiscal rules. Movements in the budget balance are thus ambiguous.
A given budget outcome can be signal that the deficit is “good”, if it has arisen as a result of discretionary fiscal policy decisions by government to maintain full employment given the spending and saving decisions of the non-government sector; or “bad”, if it has arisen because non-government spending has fallen and the automatic stabilisers have led to a decline in tax revenue and an increase in unemployment.
When private spending collapses and the deficit rises, the correct response is to increase discretionary net public spending not cut it.
To overcome the ambiguity, economists sought to isolate the endogenous component (the cyclical component) from the underlying component that reflected the discretionary policy choices of the government.
They came up with the concept of a Full Employment Budget Balance, which was a hypothetical construct of the budget balance that would be realised if the economy was operating at potential or full employment.
In other words, calibrating the budget position (and the underlying budget parameters) against some fixed point (full capacity) eliminated the cyclical component – the swings in activity around full employment.
So a full employment budget would be balanced if total outlays and total revenue were equal when the economy was operating at total capacity. If the budget was in surplus at full capacity, then we would conclude that the discretionary structure of the budget was contractionary and vice versa if the budget was in deficit at full capacity.
This concept has been replaced by the terminology – structural balance. By redefining full employment as the unemployment rate equal to the NAIRU, it logically leads to the conclusion that if the economy is running an unemployment equal to the estimated NAIRU then not only is the economy claimed to be at full capacity (the inflation barrier) but also whatever budget outcome that might be recorded at that point must be all structural – that is, no cyclical impact.
It doesn’t take rocket science to realise that if you keep re-estimating the NAIRU to track the actual unemployment rate, the structural budget balance will almost always track the actual budget balance (that is, the cyclical component will always be relatively close to zero).
If you think about that, you will realise that if the economy goes into a downturn and unemployment jumps by a few percent or more, then the automatic stabilisers (the cyclical component) will push the budget deficit up (or the surplus down). But the way the neo-liberals estimate the NAIRU is that the rising unemployment will be accompanied by a rising NAIRU estimate.
Which means that the rising budget deficit will be interpreted as a rising structural deficit and the cyclical component will be underestimated.
Then they invoke their religious dogma that structural deficits are bad and fiscal austerity is proffered as TINA!
The reality is that there would be a very bad cyclical situation and the economy would be operating far from full employment, but the IMF or the OECD would conclude that the degree of slack was small and the budget position was too expansionary. That is what goes on in policy land.
The NAIRU as a guide to policy
How useful is the NAIRU as a guide to policy?
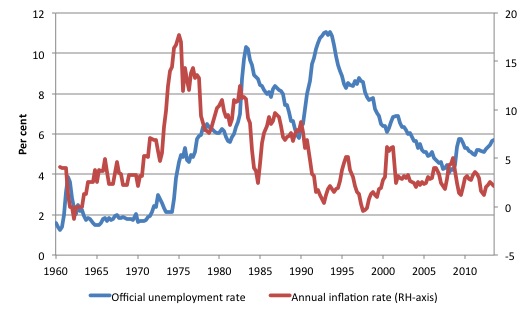
Consider the following graph, which shows the annual inflation rate for Australia on the right-axis and the official unemployment rate on the left-axis for the period March-quarter 1960 to the September-quarter 2013.
The experience is common for most OECD countries. What is apparent from the graph is the disparate behaviour of the inflation rate and the unemployment rate.
It is difficult to construe an unemployment rate over the period where you would witness accelerating inflation if the actual unemployment rate were lower or decelerating inflation if the unemployment rate was higher.
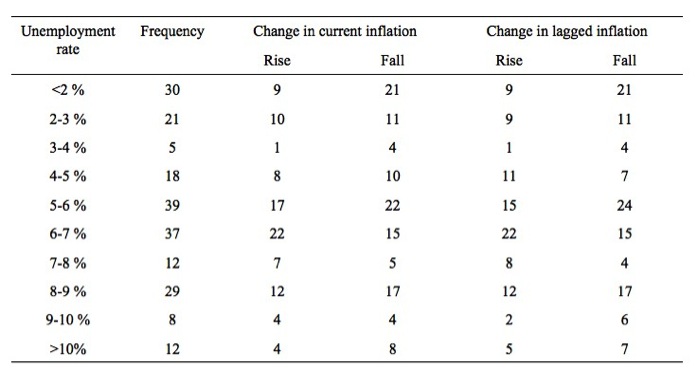
The following Table compares the frequency of accelerating inflation with decelerating inflation for given ranges of the unemployment rate since September-quarter 1959.
If there were a well-defined and stable NAIRU we would expect to find some unemployment rate range where all the changes in inflation were negative and below that range most of the changes in inflation positive.
The results clearly do not support the existence of such a rate.
We are unlikely to get any definitive information from the unemployment data about the likely movements in the inflation rate. More formal econometric work that I have been doing in recent days (and will be unveiled at the upcoming – National Unemployment Conference – Path to Full Employment Conference – which I host most years in Newcastle), also fails to find any evidence of a stable NAIRU specification. This is consistent with the findings of many researchers.
The OECD define the NAIRU or – Structural Unemployment – as:
Structural unemployment is the rate of unemployment consistent with constant wage inflation (non-accelerating wage rate of unemployment (NAWRU)), or constant price inflation (non-accelerating inflation rate of unemployment (NAIRU)), given current economic conditions.
They outline the methodology they use in this document – Estimating the Structural Rate of Unemployment for the OECD Countries.
We learn that:
The dominant view among economic analysts is that there is not a long-term trade-off between inflation and unemployment: in the long run, unemployment depends on essentially structural variables, whereas inflation is a monetary phenomenon.
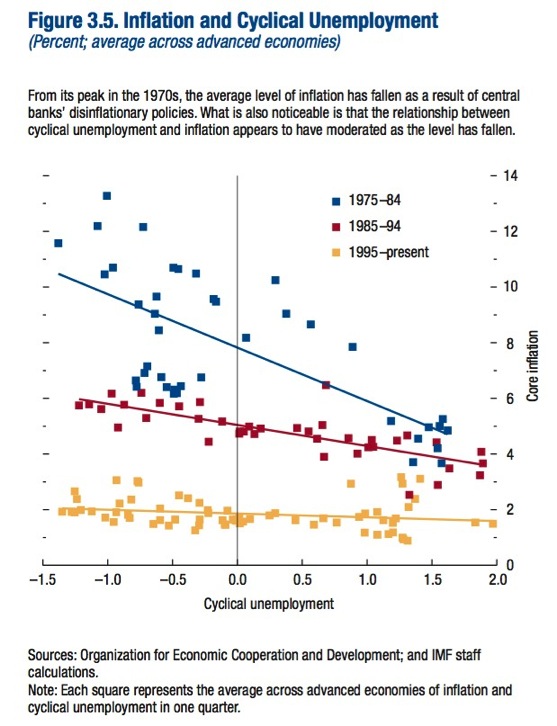
And then we might juxtapose that view with the following graph that appeared as Figure 3.5 (page 5) in Chapter 3 of the April 2013 edition of the IMF’s World Economic Outlook.
Which shows that a very clear trade-off over very long time-periods is clearly available. But we must be careful when in saying that.
If you look into the detail, you will see that the unemployment measure in the IMF’s graph is “Cyclical Unemployment”, which in Footnote 5 (page 5) of the IMF Chapter we learn that:
Cyclical unemployment is computed by subtracting the OECD estimates of the NAIRU from the unemployment rate. The NAIRU is the rate of structural unemployment consistent with no inflation pressure. Because the NAIRU estimates are available only at annual frequencies, we use linear interpolation to generate quarterly values.
So we cannot exactly say that the graph shows there is a trade-off between unemployment and inflation because the measure of unemployment is not actual but some confected measure.
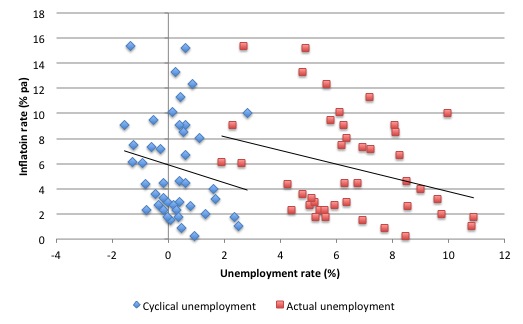
The following graph plots the annual inflation rate for Australia against the actual unemployment rate (markers) and the cyclical unemployment rate (blue markers), the latter being defined as the difference between the actual unemployment rate and the OECD’s NAIRU measure. The data period is 1970 to 2013 (annual data).
The black lines are linear regressions corresponding to each of the relationships (inflation regressed on the cyclical unemployment rate; inflation regressed on the actual unemployment rate).
It is clear that there’s very little extra informational content provided by the linear transformation of the unemployment rate to create the cyclical measure.
So what about the estimates of the NAIRU itself. Various techniques are used to come up with this mythical time series.
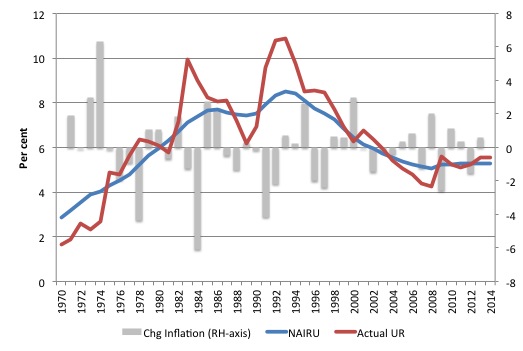
The next graph shows the OECD estimate of the NAIRU for Australia (blue line) plotted against the actual unemployment rate (red line) from 1970 to 2013 – both on the left-axis.
On the right-axis, I have plotted the change in the annual inflation rate – so the acceleration in the price level (grey bars).
The OECD and many others use simple linear filters (such as the Hodrick-Prescott filter) to estimate the NAIRU. These just provide a linear representation of the smoothed evolution in the actual data.
Points to note:
1. The NAIRU just tracks the actual unemployment rate (in a smoothed lag fashion). The unemployment rate is very cyclical and asymmetric – it rises sharply in recessions and falls slowly during the recovery.
That is a common pattern in all economies. The NAIRU just tracks that pattern. The point is that there are not structural changes going on here which would justify the claim that “structural” unemployment rose sharply in the second half of the 1970s or fell sharply in the 1990s.
When we have examined the so-called structural determinant so the NAIRU (such as, unemployment benefits, replacement ratios (dole), tax wedges (on-costs etc) we find: (a) they are highly cyclical; and (b) when you strip the cyclical component out (detrend) you find they don’t explain any change in the underlying estimates of the NAIRU.
2. The movement in the estimated OECD NAIRU measure bear no coherent relationship to the changes in the inflation rate.
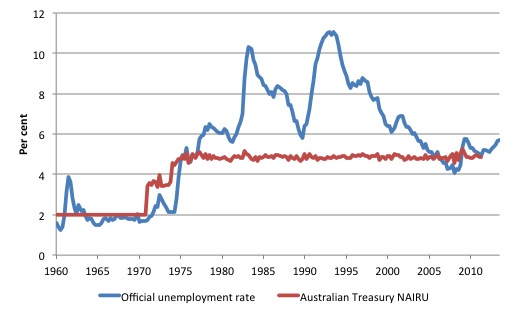
The next graph provides a different measure of the Australian NAIRU, which is even more hysterical for its audacity. It comes from the Australian Treasury’s Macroeconometric Model – TRYM, which uses an econometric approach to estimate the NAIRU after deriving a wage equation.
When you try to see what might have happened in the mid-1970s to justify such a quantum leap all that comes to mind is that a major recession occurred (a cyclical event) and a major ideological paradigm shift occurred (neo-liberalism to the fore and the abandonment of Keynesian macro).
The latter explains the jump. There was no substantial structural shift (inefficiency) in the Australian labour market that would justify such a jump. And then you have to ask: Why are the OECD and the Australian Treasury estimates so different? Answer: Arbitrariness of technique. You can come up with anything you like.
Hysterical comes to the lips!
But also tragic because these estimates are actually used to just fiscal positions as noted above.
Quick video instead of multiple graphs
I created the following brief video to let you see some of the stupidity. It took a few minutes to create and is not meant to be a visual feast. You cannot really see the data but the graph is evident and will give you the message.
Conclusion
Time’s up.
That is enough for today!
(c) Copyright 2013 Bill Mitchell. All Rights Reserved.
My Oxford Dictionary of Economics defines NAIRU (to paraphrase) as the level of unemployment that brings stable inflation. All that says is that if demand and hence numbers employed are on the high side, then inflation rises. And conversely if demand is deficient and there is excess unemployment, then inflation falls. That strikes me as a very simple and perfectly valid concept, even though it’s obviously difficult to say EXACTLY what level of unemployment equates to NAIRU, and even though loads of economists will take the NAIRU concept and get it all wrong.
Moreover the idea that there is a trade-off between inflation and unemployment did not suddenly appear in the late 1960s. Irving Fisher mentioned the trade off in the 1920s. And I’ll bet some people in Ancient Rome tumbled to the point: particularly when there was a credit crunch in Ancient Rome. I’ve no doubt that when that happened, unemployment rose and inflation fell, and some Romans noticed the fact.
Dear Ralph (at 2013/11/19 at 20:23)
You said:
You didn’t read carefully enough. I said the idea that there was NO trade-off (a unique unemployment rate associated with stable inflation) emerged in the late 1960s. The notable events were Milton Friedman’s Presidential Address to the AEA (1968) and a paper by Edmund Phelps at the same time.
I wrote a PhD about the history of the trade-off dating back to the C16th.
best wishes
bill
I note your fellow countryman Greg Jericho (Guardian) has problems disentangling structural from cyclical unemployment.
http://www.theguardian.com/business/2013/nov/19/training-long-term-unemployment-hope?commentpage=1
Hi Bill,
I’m not entirely clear what you are saying. You seem to accuse Friedman and Phelps of saying that there is no trade-off in the sense that the level of unemployment at which inflation gets serious never changes. (Which is an unusual use of the phrase “trade-off”, but never mind). My initial reaction on reading your above comment was doubts as to whether Friedman or Phelps actually said that. So I looked up Friedman’s 1968 presidential address. And he said (in reference to both the natural rate of interest and unemployment) that “..the “natural” rate itself will change from time to time”.
Indeed it would be amazing if it didn’t “change from time to time”. E.g. if the minimum wage goes up, I’d expect NAIRU to go up. Conversely, if labour markets become more efficient, e.g. because government spends more on training or state employment agencies, I’d expect NAIRU to decline.
Good post. Simple, but it really cuts to the heart of it.
The NAIRU is nothing more than a piece of neo-liberal sophistry used to justify government inaction in the area of unemployment.
What I still haven’t figured out is whether or not the mainstream economists who research in this field and use the concept as cover for policy failure can see it or not. Is it blind ideology or cold cynicism?
To Ralph
I read in Steve Keen’s Debunking about the use of dimensional analysis in economics. A useful way to check out each side to an equation. I see you propose a level of unemployment and relate this to a stable level of inflation. I read the idea of stable inflation as being a constant rate i.e. stable over time. The time dimension is missing on the unemployment side of the equation. I’m used to the idea of a dynamic economics – can you explain?
Jim
off topic, relating to broader MMT.
I often read around and stumble across economic articles of various persuasions. This one : http://www.marketoracle.co.uk/Article43171.html
briefly goes into bank vs state money. re. keynes 1930’s work (most of which I havent read directly).
Can anyone tell me (bill, neil W, any others perhaps) Is any of it relevant post- gold standard? I can see some of his errors in terms of not taking into account exports as a global entity (and particularly the core vs periphery deflation problems in the eurozone). I would tend to advocate fiscal policy changes using the knowledge gained in large part from this blog; I just dont know if this article from the halfway point down has any relevance and whether his conclusion re. monetary austerity has any validity at all?
I’m completely baffled by this whole argument. So I’ll go thru it stage by stage.
1. Given excess unemployment, the solution is to raise aggregate demand. Are we all agreed on that? (One could implement JG as well, but let’s leave JG out of it to keep things simple)
2. Given GROSSLY EXCESSIVE unemployment, the initial effect of a rise in demand will be to raise employment rather than inflation. OK so far?
3. At some point, and given a continuous rise in demand (at a rate faster than the real potential output of the economy is rising) inflation will kick in in a serious way because employers just cannot meet that demand. OK so far?
4. The point at which inflation kicks in a serious way is given different names. One name is NAIRU. Bill calls it the “inflation barrier”. Another name (now rarely used) is the “natural level” of unemployment.
5. The main difference between the NAIRU concept and the “natural level” one is the “A” in NAIRU: that’s the fact that according to the advocates of the NAIRU idea, inflation ACCELERATES. But frankly that’s a technical detail of no interest to me.
6. Why is Bill’s terminology, i.e. “inflation barrier” valid, but NAIRU is not valid? They’re much the same thing.
Jim,
What makes you think that “time” is missing from the unemployment side of the equation? If inflation is constant (over time), and assuming all else remains equal, then unemployment will remain constant (over time).
Would the inflation barrier be found closer to frictional unemployment?
@Ralph,
While its hilarious to watch you get your knickers into a twist over not understanding this…
The difference is between inflation or accelerating inflation. One theory posits a linear trade off and the other one an exponential (and fictional) trade off.
Robert,
The Oxford Dictionary of Economics defines frictional unemployment as “The unemployment that occurs because, as people change jobs when some sectors of the economy grow and others contract, it is not practicable to dovetail precisely leaving old jobs and starting new ones. At times of fairly full employment frictional unemployment may form an appreciable fraction of total unemployment.”
So they’re more or less agreeing with you, i.e. they’re saying that when unemployment is as low as it can go, the total number who are frictionally unemployed is close to the total number who are “inflation barrier” unemployed.
Incidentally I’d criticise that definition for placing too much emphasis on “sectors of the economy”. That is, even if the proportion of GDP taken by each sector remained absolutely constant, there’d still be some job changing for a host of reasons and thus frictional unemployment. E.g. people retire, people quit jobs voluntarily for a host of other reasons: pregnancy, quitting for a better paid job, etc.
Ralph’s discussion of the NAIRU could only be improved if Kenneth Mars recited it as per the Franz Liebkind character he played in The Producers.
Awesome.
Bill Mitchell arguments above indicate clearly that past attempts to estimate NAIRU are inconsistent with each other, and that there is no plausibility in the estimated changes in NAIRU over time.
Even so, Bill seems to agree with the broad concept an inflation barrier to the expansion of aggregate demand.
Indeed, MMT argues that bottlenecks in the economy makes demand expansion difficult, which is is one of the justifications of MMT’s JG proposal.
Bill’s main conclusion here is that “The NAIRU as estimated is a very dangerous concept for the well-being of ordinary people”.
This seems to imply that Bill thinks that current estimates of NAIRU are too high, which makes policy makers afraid to reduce unemployment by stimulating aggregate demand.
However, Bill’s conclusion is not proven – he makes no attempt to justify his belief that the true NAIRU is lower, and he makes no suggestions for better ways of estimating NAIRU.
“Can anyone tell me (bill, neil W, any others perhaps) Is any of it relevant post- gold standard?”
Any article that analyses money as an abstract concept without tying it back to real people spending money to do stuff misses the point.
If there is a reduction in the growth of bank money, that’s because people have stopped net-borrowing as much. Which means they are not net-spending as much in the real economy.
So either they have to be forced to net-spend or the government has to do the net-spending instead. Or in the case of the Eurozone you get some other country to net-spend and then blame them for doing so.
Thanks for replying NeilW.
I should have asked in the question about whether this bank vs state money is still as relevant as a concept now, as it was in the 30’s?
I know Im being imprecise but Im trying to tie together a few things. Re. Ellen Brown type essays, is it that bank money is credit based, where-as state money (has the potential to be) pure fiat, with no interest bearing bond attached. if so, perhaps this move away from bank money has the potential to be a positive. Are we going in the right direction (at least in a minor way) if we are moving away from ‘bank money’? Ive read most of Bills blogs and I dont remember a specific one which spoke about the difference between bank vs state money and how it has changed in recent years. (perhaps just the often referenced QE is an asset swap is all we need to know?)
@NicTheNZer: “The difference is between inflation or accelerating inflation. One theory posits a linear trade off and the other one an exponential (and fictional) trade off.”
Exactly. Little or no evidence for the latter (exponential) and undisputed evidence for the former (linear trade-off). Ralph, you may not be interested in the “A” in NAIRU but it’s the important (and completely wrong) bit yet it (the NAIRU) is used as a parameter for virtually all mainstream models and thus as an input to fiscal and monetary policy the world over. It’s wrong, it’s destructive and Bill is completely right in his analysis; methodologically, logically and empirically i.e. scientifically.
Dear KongKing (at 2013/11/20 at 15:57)
You said:
I have written many academic (peer-reviewed) articles, book chapters and a book on the topic that show in various ways that: (a) the true NAIRU doesn’t exist; (b) that the mainstream estimates of what I call the inflation barrier are biased upwards, sometimes by several percentage points; and (c) that full employment in Australia lies close to an unemployment rate of 2 to 2.5 per cent rather than the official estimates of the NAIRU which are just over 5 per cent.
I don’t have to repeat my life’s work every time I write a blog.
best wishes
bill
Hugh, the shorter Hanke…just get Basel’s foot off the throat of the banks and everything will be rosy.
Hugh, I don’t think there’s any move away from bank money towards state money. The 2 are linked because (contrary to the text books, as Bill continually reminds us) the central bank must supply reserves to the commercial banking sector as lending expands (to maintain control of the cash rate).
If there was no commercial banking system creating deposits, it would take about 5 minutes for one to evolve.
There’s nobody stopping you from creating your own “bank notes” but you might have trouble getting the broader community to accept them, most notably the Taxman.
Yes John. and thanks for the reply.
so, perhaps I will go read some more keynes and then bring this up again on another blog, Im wondering why the article states that keynes made a big deal of bank vs state money in the 30s treatise?
Your answer seems to suggest that it does relate to the pre vs post gold standard issue, and that now, the power of the central bank makes the distinction largely irrelevant, as per my first post. thanks.
I will have to try to find the time to read the early stuff though, we have to be able to point out the fallacies however they are presented by mises disciples.
Amazing thing that in these examples there is almost always full employment or very close, at least in the IMF perspective. Doesn’t matter if there is 3% or 8% unemployment. UR on NAIRU level is full employment in IMF eyes.