Today (March 6, 2024), the Australian Bureau of Statistics released the latest - Australian National…
Australian national accounts – stagnation sets in
Today’s Australian Bureau of Statistics – Australian National Accounts – for the September-quarter 2013, shows that real GDP growth was 0.6 per cent, down from the (revised) 0.7 per cent for the June-quarter. The annualised growth rate of 2.3 per cent is now well below the trend rate between 2000 and 2008 of 3.3 per cent. This poor growth relative to trend is the reason the unemployment rate is rising. The stunning result is that the public sector contributed 1.5 percentage points to growth this quarter (a reversal from the June-quarter). This contribution, while welcome, will not be sustained given the current political environment. Overall, the data paints a fairly gloomy overall picture for the Australian economy. It ia hard to discern what the new Federal government is up to given that in 2 months we have already had four discrete statements about education policy, for example! But if their overall macroeconomic rhetoric is maintained and they start hacking into public spending to flex their conservative muscles then the outlook will shift very quickly from gloomy to disastrous and we will follow Europe down the sink hole.
The main features of today’s National Accounts release for the September-quarter 2013 were (seasonally adjusted):
- Real GDP increased by 0.6 per cent after recording a 0.7 per cent increase in the June-quarter.
- The main positive contributors to expenditure on GDP were the contributors to expenditure on GDP were Public gross fixed capital formation (1.3 percentage points), Net Exports (0.7 percentage points) and Final consumption expenditure (0.4 percentage points).
- The main negative factors were Private gross fixed capital formation (-1.4 percentage points) and Changes in inventories (-0.5 percentage points).
- Our Terms of Trade (seasonally adjusted) fell sharply by 3.3 per cent in the quarter and 3.6 per cent for the 12 months to September 2013.
- Real net national disposable income, which is a broader measure of change in national economic well-being fell by 0.6 per cent whih means that real living standards fell.
Overall growth picture – continuing to trend down
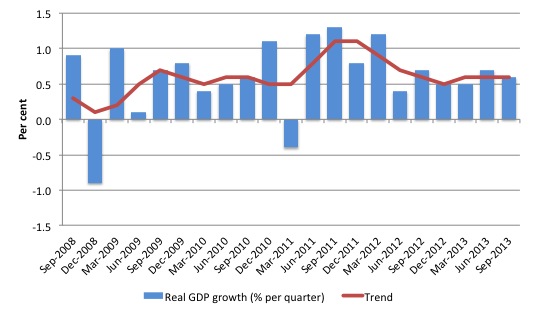
The following graph shows the quarterly percentage growth in real GDP over the last five years to the September-quarter 2013 (blue columns) and the ABS trend series (red line) superimposed. After the decline in trend growth was arrested by the fiscal stimulus in 2008-09 the decline in government support saw the dip in trend growth in 2010.
Initially, the growth in private investment associated with the record terms of trade and the resulting mining boom helped drive the new rise in trend growth and that appears to have ended in the December-quarter 2011.
As private investment boom has receded and the impact of fiscal austerity bites, growth has now fallen to around 2.3 per cent per year.
Over the last 12 months, growth has flattened out and the Australian economy is now stuck in a stagnant below trend growth state, which is insufficient to keep unemployment from slowly rising.
Real GDP growth and hours worked
One of the puzzles over the last several years or so has been the sharp dislocation between what is happening in the labour market and what the National Accounts data has been telling us.
Employment growth and hours worked has been virtually flat over the period while annual real GDP growth has been around 2.4 to 2.6 per cent. Today’s data suggests dislocation is continuing. Even though growth is slowing, it remains around the 2.4 per cent per annum mark). But there is no employment dividend of any significant amount forthcoming.
The following graph presents quarterly growth rates in trend GDP and hours worked using the National Accounts data for the last five years to the September-quarter 2013.
You can see the major dislocation between the two measures that appeared in the middle of 2011 persisted into the first-quarter 2013. Hours worked increased in the June-quarter 2012 more in line with what we would expect but then collapsed again.
In the last two quarters, the correspondence between hours-worked and real GDP growth is more typical and implies that labour productivity has fallen.
Just in case you think the labour force data is suspect, the hours worked computed from that data is very similar to that computed from the National Accounts.
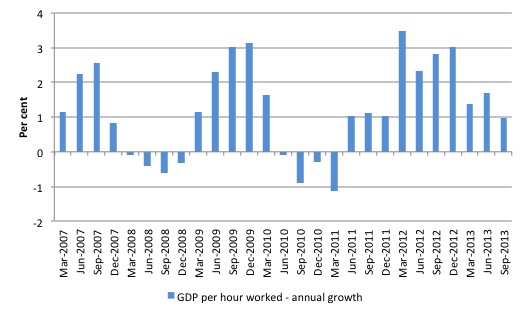
To see the above graph from a different perspective, the next graph shows the annual growth in GDP per hour worked (so a measure of labour productivity) from the March 2007 quarter to the September-quarter 2013.
The relatively strong growth in labour productivity in 2012 helps explain why employment growth has been lagging given the real GDP growth. Growth in labour productivity means that for each output level less labour is required.
In the recent three quarters, the growth has slowed which suggests that the cycle associated with the investment boom is over and real GDP growth and employment growth will start to converge back to more typical proportions (at a lower overall real GDP growth rate).
Contributions to growth
What components of expenditure added to and subtracted from real GDP growth in the September-quarter 2013?
The ABS tell us that:
In seasonally adjusted terms, the contributors to expenditure on GDP were Public gross fixed capital formation (1.3 percentage points), Net Exports (0.7 percentage points) and Final consumption expenditure (0.4 percentage points). The detractors were Private gross fixed capital formation (-1.4 percentage points) and Changes in inventories (-0.5 percentage points).
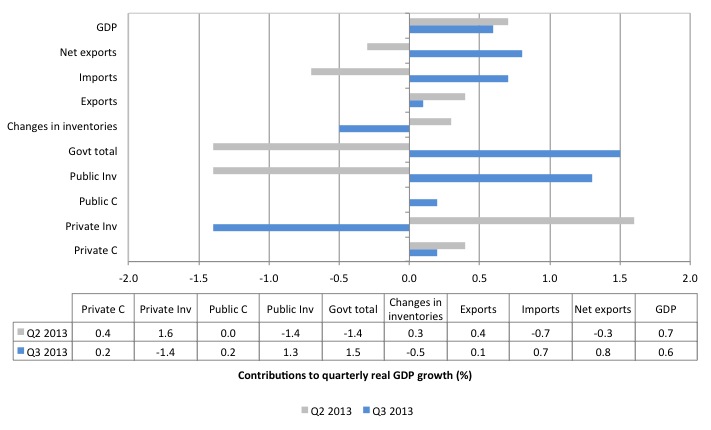
The following bar graph shows the contributions to real GDP growth (in percentage points) for the main expenditure categories. It compares the September-quarter 2013 contributions (blue bars) with the June-quarter 2013 (grey bars).
The overall contribution of investment is negative (-0.1 percentage points) given that the sharp contraction for private capital formation (-1.4 percentage points) was nearly offset by the dramatic surge in public investment (1.3 percentage points).
Note that the strong contribution from net exports in the September-quarter 2013 (0.8 percentage points). This is driven by a small contribution from exports (0.1 points) and a massive drop in imports (0.7 points), the latter the result of sluggish growth and declining Real net national disposable income.
Private consumption is weakening (see evidence of a sharp rise in the household saving ratio later in the report).
The public sector contribution (1.5 percentage points) is the major reason real GDP has continued to growth reversing the fiscal contraction in the June-quarter 2013.
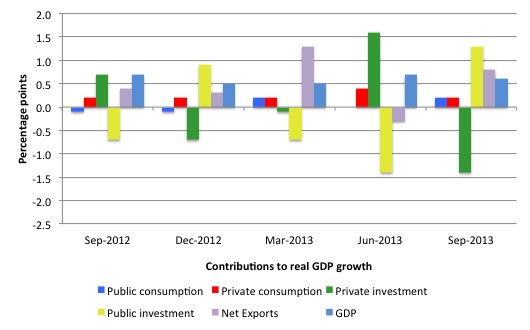
The next graph shows the contributions to real GDP growth of the major expenditure aggregates since September-quarter 2012 (in percentage points). The total real GDP growth (in per cent) is also included as a reference.
The data suggests that household consumption (and public consumption) is weak. The private investment boom associated with the mining sector is also in decline as the record terms of trade moderates.
The stand-out result is the surge in public capital formation.
Household saving ratio jumps to 11.1 per cent
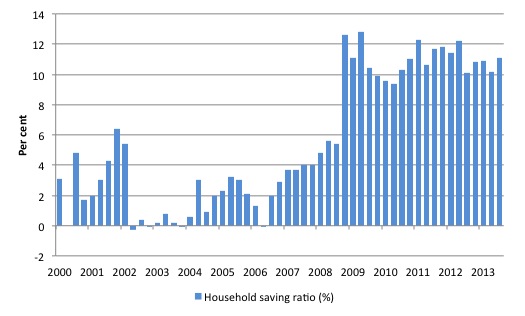
The following graph shows the household saving ratio (% of disposable income) from 2000 to the current period. The household sector is now behaving very differently since the GFC rendered its balance sheet very precarious. Prior to the crisis, households maintained very robust spending (including housing) by accumulating record levels of debt. As the crisis hit, it was only because the central bank reduced interest rates quickly, that there were not mass bankruptcies.
The household saving ratio was 11.1 per cent of disposable household income in the September-quarter 2013, up from 10.2 per cent in the June-quarter 2013.
For the economy to continue to grow strongly while households are maintaining this higher levels of saving (from disposable income), public spending, private investment and/or net exports has to increase.
Clearly, the contribution from private investment is now fading (and was negative in the September-quarter) and the net exports contribution in the current quarter is largely being driven by falling import demand.
Which means that continued growth will require a much stronger contribution from the government sector. The 1.1 per cent contribution from the State and Local government public corporations is an outlier and will not endure.
The problem is that if incomes start to drop and the households continue to pursue this saving proportion aggregate demand will decline even further.
The household sector is now carrying record levels of debt as a result of the credit binge leading up to the crisis and we are unlikely to see a return to the low saving ratios that were evident in the period 2000 to 2005.
That means that government surpluses which were associated with the credit binge, and only were made possible by the unsustainable credit binge are untenable in this new (old) climate. The Government needs to learn about these macroeconomic connections.
A return to higher saving ratios is surely signalling a need for a return to more or less continuous budget deficits, depending on what happens to the external sector.
That is what the overall real GDP growth slowdown is telling us – very clearly. So clearly that the neo-liberals fail to see it!
Conclusion
Today’s National Accounts data indicates that the economy has slowed a little and has converged for the time being around a below-trend growth path as the investment phase of the mining boom slows.
The economy is probably slowing faster than the data suggests given the sharp spike in public investment which will not be sustained in the current political environment.
Remember that the National Accounts tells us what was happening in 3-6 months ago. The most recent evidence suggests that net exports will not contribute as much in the next 6 months given that the consumption component of imports has not shifted much recently.
But the terms of trade fell by around 3.3 per cent in the last quarter and 3.6 per cent in the 12 months.
It is clear that private consumption growth is modest and declining. Taken together and exports are not growing strongly.
I think today’s national accounts data paints a fairly gloomy overall picture for the Australian economy. Gloomy without being disastrous.
However, if the new federal government (after Saturday) start hacking into public spending to flex their conservative muscles then the outlook will shift very quickly from gloomy to disastrous and we will follow Europe down the sink hole.
That is enough for today!
(c) Copyright 2013 Bill Mitchell. All Rights Reserved.

Given the neo-liberal ideology of the Australian government, will we soon witnessing the announcement of draconian cuts to expenditures?
Perhaps even following the idiotic and cruel English model.
State pension age to be raised to 70