Today (April 18, 2024), the Australian Bureau of Statistics released the latest - Labour Force,…
Australian Labour Force data – the economy continues to deteriorate
Today’s release of the – Labour Force data – for January 2014 by the Australian Bureau of Statistics recorded a second consecutive month of negative employment growth and the unemployment rate rose to 6 per cent with participation constant. Full-time employment continued to contract. The data confirms that there needs to be a major rethink in the macroeconomic policy settings in favour of stimulus. Employment growth has been around zero for nearly two years and there is an upward bias in unemployment. The situation will worsen unless the Government shows some leadership and increases its net spending and targets employment creation. The problem is that the Government is becoming obsessed with ideological pettiness (attacking unions, welfare recipients, refugees etc) and failing to meet the challenges that it faces in an appropriate manner. It has even been caught out lying in recent weeks about the reasons that the SPC Cannery is now struggling and Toyota are to close car manufacturing. Moreover, it is now being urged by the IMF to cut the government deficit in the upcoming May fiscal policy statement (aka ‘The Budget’). Neither the Government nor the IMF seem to be grounded on this planet at the moment.
The summary ABS Labour Force (seasonally adjusted) estimates for January 2014 are:
- Employment decreased 3,700 (0.0 per cent) with full-time employment falling by 7,100 and part-time employment rising by 3,400.
- Unemployment increased by 16,600 (2.3 per cent) to 728,600.
- The official unemployment rate rose to 6.0 per cent (from 5.8 per cent).
- The participation rate was unchanged at 64.6 per cent but is well below its November 2010 peak (recent) of 65.9 per cent.
- Aggregate monthly hours worked increased by 20.5 million hours (1.27 per cent).
- The quarterly ABS broad labour underutilisation estimate (the sum of unemployment and underemployment) were published for the November-quarter in last month’s release and showed that underemployment fell by 0.2 percentage points to 7.6 per cent. The total labour underutilisation rate fell from 13.7 per cent in the August-quarter to 13.4 per cent in November. There were 941 thousand persons underemployed. The February release will update these estimates
Employment growth – continues to be negative
The January 2014 data shows that employment decreased by 3,700 (close enough to 0.0 per cent) with full-time employment falling by 7,100 and part-time employment rising by 3,400.
Over the last 24 months or so we have seen the labour market data switching back and forth regularly between negative employment growth and positive growth spikes.
This pattern has consolidated and indicates the current policy settings are wrong and a stimulus is required.
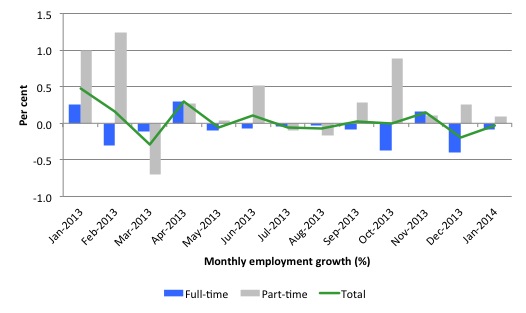
There have been considerable fluctuations in the full-time/part-time growth over the last year with regular crossings of the zero growth line.
The following graph shows the month by month growth in full-time (blue columns), part-time (grey columns) and total employment (green line) for the 12 months to January 2014 using seasonally adjusted data.
Today’s results just repeat the topsy-turvy nature of the data over the period shown although there have now been two consecutive months of negative employment growth.
While full-time and part-time employment growth are fluctuating around the zero line, total employment growth is still well below the growth that was boosted by the fiscal-stimulus in the middle of 2010.
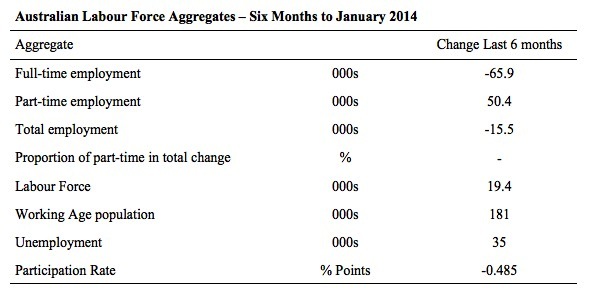
The following table provides an accounting summary of the labour market performance over the last six months. The monthly data is highly variable so this Table provides a longer view which allows for a better assessment of the trends. WAP is working age population (above 15 year olds).
The conclusion – overall there have 15.5 thousand jobs (net) lost in Australia over the last six months – an appalling outcome. Worse still is that fact that over the same period, full-time employment has fallen by 65.9 thousand jobs (net) while part-time work has risen by 50.4 thousand jobs.
The Working Age Population has risen by 171 thousand in the same period while the labour force has risen by 19.4 thousand. The participation rate has fallen substantially (0.5 percentage points) over the last six months.
This has had the effect of attenuating the rise in unemployment (see later).
The weak employment growth has thus not been able to keep pace with the underlying population growth and unemployment has risen by 35 thousand as a result.
The rise in unemployment would have been much worse had the participation rate not dropped.
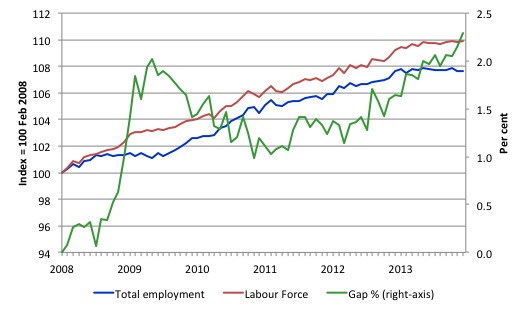
To put the recent data in perspective, the following graph shows the movement in the labour force and total employment since the low-point unemployment rate month in the last cycle (February 2008) to January 2014. The two series are indexed to 100 at that month. The green line (right-axis) is the gap (plotted against the right-axis) between the two aggregates and measures the change in the unemployment rate since the low-point of the last cycle (when it stood at 4 per cent).
You can see that the labour force index has largely levelled off yet the divergence between it and employment growth has risen sharply (in spurts) over the last several months.
The Gap series gives you a good impression of the asymmetry in unemployment rate responses even when the economy experiences a mild downturn (such as the case in Australia). The unemployment rate jumps quickly but declines slowly.
It also highlights the fact that the recovery is still not strong enough to bring the unemployment rate back down to its pre-crisis low. You can see clearly that the unemployment rate fell in late 2009 and then has hovered at the same level for some months before rising again over the last several months.
The Gap shows that the labour market is now in worse shape than it was at the peak of the financial crisis in 2009. After the government prematurely terminated the fiscal stimulus the situation has progressively deteriorated.
In fact, in January 2014, the Gap (2.3 percentage points) exceeded the levels that appeared in May and June 2009 when the Australian economy was enduring the impact of the crisis. All the gains made since then have thus disappeared due to poorly crafted fiscal policy not responding appropriately to non-government spending changes.
Full-time and Part-time employment in recovery
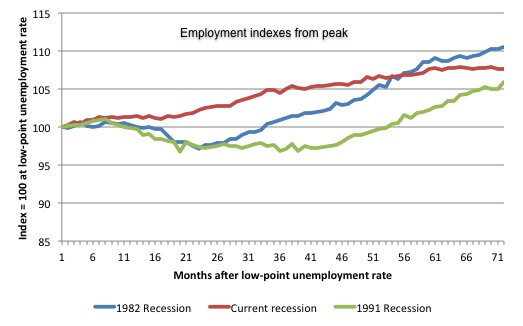
The following graph shows employment indexes for the last 3 recessions and allows us to see how the trajectory of total employment after each peak prior to the three major recessions in recent history: 1982, 1991 and 2009 (the latter to capture the current episode).
The peak is defined as the month of the low-point unemployment rate in the relevant cycle and total employment was indexed at 100 in each case and then indexed to that base for each of the months as the recession unfolded.
I have plotted the 3 episodes for 71 months after the low-point unemployment rate was reached in each cycle. The current episode is now in its 71th month.
The initial employment decline was similar for the 1982 and 1991 recessions but the 1991 recovery was delayed by many month and the return to growth much slower than the 1982 recession.
The current episode is distinguished by the lack of a major slump in total employment, which reflects the success of the large fiscal stimulus in 2008 and 2009.
However, the recovery spawned by the stimulus clearly dissipated once the fiscal position was reversed and the economy is now producing very subdued employment outcomes.
Moreover, the current episode is also different to the last two major recessions in the sense that the recovery is over and the economy is deteriorating again.
The next 3-panel graph decomposes the previous graph into full-time and part-time employment. The vertical scales are common to allow a comparison between the three episodes.
First, after the peak is reached, part-time employment continues to increase as firms convert full-time jobs into fractional jobs.
Second, recoveries are dominated by growth in part-time employment as firms are reluctant to commit to more permanent arrangements with workers while there is uncertainty of the future course in aggregate demand.
Third, the current recovery is clearly mediocre by comparison, with both very subdued growth in full-time and part-time work.
Teenage labour market – slight improvement
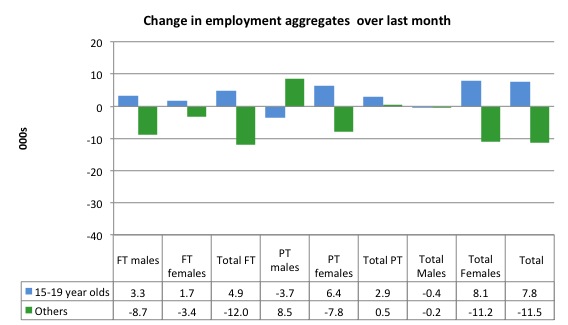
Full-time employment for teenagers rose by 4.9 thousand in January 2014 while part-time employment rose by 2.9 thousand. Overall, teenage employment rose by 7.8 thousand in January 2014.
The following graph shows the distribution of net employment creation in the last month by full-time/part-time status and age/gender category (15-19 year olds and the rest)
If you take a longer view you see how poor the situation is.
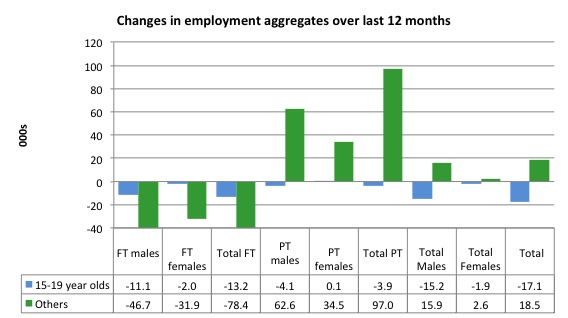
Over the last 12 months, teenagers have lost 17.1 thousand jobs while the rest of the labour force have gained 18.5 thousand net jobs. Remember that the overall result represents a very poor annual growth in employment.
Even more disturbing is the attrition of full-time jobs among teenagers – losing 13.2 thousand over the last year.
The teenage segment of the labour market is being particularly dragged down by the sluggish employment growth, which is hardly surprising given that the least experienced and/or most disadvantaged (those with disabilities etc) are rationed to the back of the queue by the employers.
The following graph shows the change in aggregates over the last 12 months.
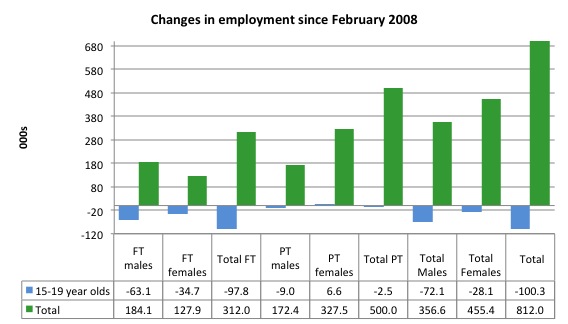
To further emphasise the plight of our teenagers, I compiled the following graph that extends the time period from the February 2008, which was the month when the unemployment rate was at its low point in the last cycle, to the present month (January 2014). So it includes the period of downturn and then the so-called “recovery” period. Note the change in vertical scale compared to the previous two graphs.
Since February 2008, there have been only 812 thousand (net) jobs added to the Australian economy but teenagers have lost a staggering 100.3 thousand over the same period. It is even more stark when you consider that 97.8 thousand full-time teenager jobs have been lost in net terms.
Even in the traditionally, concentrated teenage segment – part-time employment, 2.5 thousand jobs (net) have been lost even though 500 thousand part-time jobs have been added overall.
Overall, the total employment increase is modest. Further, around 62 per cent of the total (net) jobs added since February 2008 have been part-time, which raises questions about the quality of work that is being generated overall.
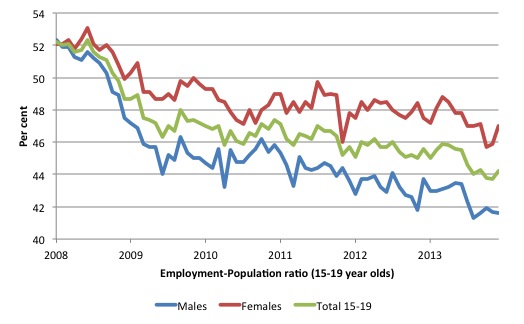
To put the teenage employment situation in a scale context the following graph shows the Employment-Population ratios for males, females and total 15-19 year olds since February 2008 (the month which coincided with the low-point unemployment rate of the last cycle).
You can interpret this graph as depicting the loss of employment relative to the underlying population of each cohort. We would expect (at least) that this ratio should be constant if not rising somewhat (depending on school participation rates).
The facts are that the absolute loss of jobs reported above is depicting a disastrous situation for our teenagers. Males, in particular, have lost out severely as a result of the economy being deliberately stifled by austerity policy positions.
The male ratio has fallen by 10.7 percentage points since February 2008, the female by 5.1 percentage points and the overall teenage employment-population ratio has fallen by 8 percentage points.
Overall, the performance of the teenage labour market continues to be deeply disturbing. It doesn’t rate much priority in the policy debate, which is surprising given that this is our future workforce in an ageing population. Future productivity growth will determine whether the ageing population enjoys a higher standard of living than now or goes backwards.
The longer-run consequences of this teenage “lock out” will be very damaging.
The problem is that in the modest growth period that the Australian labour market enjoyed as a result of the fiscal stimulus and mining investment, teenagers failed to participate in the gains – they went backwards.
Now, with the economy entering a new period of slowdown, these losses will be added too given that teenagers are among the first in line to be shown the door by employers seeking to reduce staff levels in the face of declining aggregate sales.
The previous Government’s response was to push this cohort into endless training initiatives (supply-side approach) without significant benefits. The research shows overwhelmingly that job-specific skills development should be done within a paid-work environment.
I would recommend that the new Australian government immediately announce a major public sector job creation program aimed at employing all the unemployed 15-19 year olds, who are not in full-time education or a credible apprenticeship program.
It is clear that the Australian labour market continues to fail our 15-19 year olds. At a time when we keep emphasising the future challenges facing the nation in terms of an ageing population and rising dependency ratios the economy still fails to provide enough work (and on-the-job experience) for our teenagers who are our future workforce.
Unemployment – rises sharply
The unemployment rate increased to 6 per cent in January 2014, up from 5.8 per cent in November. Official unemployment increased by 16,600 (2.3 per cent) to 728,600.
Overall, the labour market still has significant excess capacity available in most areas and what growth there is is not making any major inroads into the idle pools of labour.
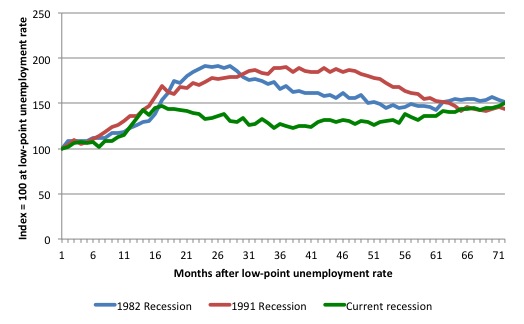
The following graph updates my 3-recessions graph which depicts how quickly the unemployment rose in Australia during each of the three major recessions in recent history: 1982, 1991 and 2009 (the latter to capture the 2008-2010 episode). The unemployment rate was indexed at 100 at its lowest rate before the recession in each case (January 1981; January 1989; April 2008, respectively) and then indexed to that base for each of the months as the recession unfolded.
I have plotted the 3 episodes for 71 months after the low-point unemployment rate was reached in each cycle. The current episode is now in its 71th month (0 being February 2008). For 1991, the peak unemployment which was achieved some 38 months after the downturn began and the resulting recovery was painfully slow. While the 1982 recession was severe the economy and the labour market was recovering by the 26th month. The pace of recovery for the 1982 once it began was faster than the recovery in the current period.
It is significant that the current situation while significantly less severe than the previous recessions is dragging on which is a reflection of the lack of private spending growth and declining public spending growth.
Moreover, the current episode is also different to the last two major recessions in the sense that the recovery is over and the economy is deteriorating again.
The graph provides a graphical depiction of the speed at which the recession unfolded (which tells you something about each episode) and the length of time that the labour market deteriorated (expressed in terms of the unemployment rate).
From the start of the downturn to the 71-month point (to January 2014), the official unemployment rate has risen from a base index value of 100 to a value 150.4 – the previous peak being 147.5 after 17 months. After falling steadily as the fiscal stimulus pushed growth along (it reached 122.8 after 35 months – in January 2010), it has been slowly trending up for some months now. Unlike the other episodes, the current trend, at this stage of the cycle, is upwards.
It is now above the peak that was reached just before the introduction of the fiscal stimulus. In other words, the gains that emerged in the recovery as a result of the fiscal stimulus in 2009-10 have now been lost.
At 71 months, 1982 index stood at 152 while the 1991 index was at 144.2. It is clear that at an equivalent point in the “recovery cycle” the current period is more sluggish than our recent two major downturns and trending upwards while the trend in the earlier episodes was moderately downwards.
It now appears that the recoveries have converging, which tells us that the current policy has failed to take advantage of the fact that the latest economic downturn was much more mild than the previous recessions. In other words, the policy failure is locking the economy into a higher unemployment rate than is desirable and otherwise attainable.
Note that these are index numbers and only tell us about the speed of decay rather than levels of unemployment. Clearly the 5.8 per cent at this stage of the downturn is lower that the unemployment rate was in the previous recessions at a comparable point in the cycle although we have to consider the broader measures of labour underutilisation (which include underemployment) before we draw any clear conclusions.
The notable aspect of the current situation is that the recovery is very slow.
Broader labour underutilisation
The ABS published its quarterly broad labour underutilisation measures in the November release.
In the November-quarterly release, total underemployment fell by 0.2 percentage points to 7.6 per cent and the ABS broad labour underutilisation rate fell by 0.3 points to 13.4 per cent (the sum of unemployment and underemployment).
| There were 941 thousand persons underemployed. Overall, there are 1.7 million workers either unemployed or underemployed. |
The next update will be in the February Labour Force data release.
Aggregate participation rate constant
The January 2014 participation rate was unchanged at 64.6 per cent (after plunging in December from 64.8 per cent). It remains substantially down on the most recent peak in November 2010 of 65.9 per cent when the labour market was still recovering courtesy of the fiscal stimulus.
What would the unemployment rate be if the participation rate was at that November 2010 peak level?
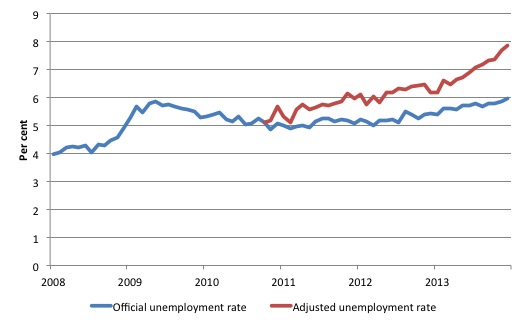
The following graph tells us what would have happened if the participation rate had been constant over the period November 2010 to January 2014. The blue line is the official unemployment since its most recent low-point of 4 per cent in February 2008.
The red line starts at November 2010 (the peak participation month). It is computed by adding the workers that left the labour force as employment growth faltered (and the participation rate fell) back into the labour force and assuming they would have been unemployed. At present, this cohort is likely to comprise a component of the hidden unemployed (or discouraged workers).
Total official unemployment in January 2014 was estimated to be 728.6 thousand. However, if participation had not have fallen there would be 976.1 thousand workers unemployed given growth in population and employment since November 2010.
| The unemployment rate would now be 7.8 per cent if the participation had not fallen below its November 2010 peak of 65.9 per cent. |
The difference between the two numbers mostly reflects the change in hidden unemployment (discouraged workers) since November 2010. These workers would take a job immediately if offered one but have given up looking because there are not enough jobs and as a consequence the ABS classifies them as being Not in the Labour Force.
Note, the gap between the blue and red lines doesn’t sum to total hidden unemployment unless November 2010 was a full employment peak, which it clearly was not. The interpretation of the gap is that it shows the extra hidden unemployed since that time.
As the participation rate dropped over the period, the gap rose.
This is quite a different picture to that portrayed by the official summary statistics.
Hours worked – rise in January 2014
Aggregate monthly hours worked rose by 20.5 million hours (1.3 per cent) in seasonally adjusted terms. The rise in hours worked this month was larger than previous rises and given the loss of employment (in persons) we can conclude that intensity is rising (longer hours worked per person). This signals that firms are probably reluctant to take on new workers given the uncertainty at present and are meeting the holiday sales increases by extending the hours of the existing employed labour force.
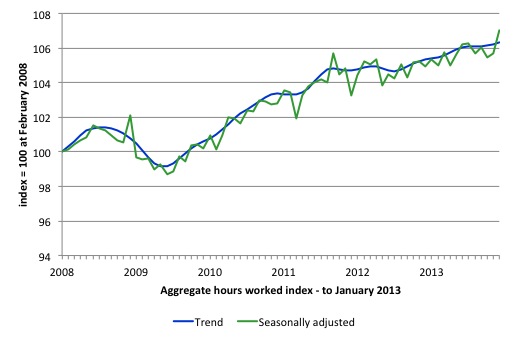
The following graph shows the trend and seasonally adjusted aggregate hours worked indexed to 100 at the peak in February 2008 (which was the low-point unemployment rate in the previous cycle).
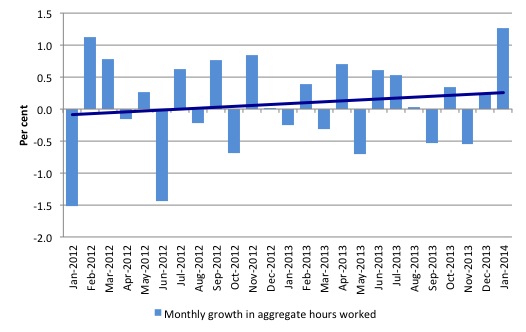
The next graph shows the monthly growth (in per cent) over the last 24 months. The dark linear line is a simple regression trend – which depicts a slightly upward trend but that result is skewed by this month’s data. You can see the pattern in working hours that is also portrayed in the employment graph – zig-zagging across the zero growth line.
Conclusion
In general, we always have to be careful interpreting month to month movements given the way the Labour Force Survey is constructed and implemented.
Overall, today’s data shows that the Australian labour market remains stuck in a stagnant state with employment growth continuing to lag behind population growth. The trend is biased downwards now.
Despite the monthly variations that we need to be cautious about, we have now had more than two years of weak-to-zero employment growth and deteriorating or suppressed participation. It is clear that the consistently weak employment growth relative to the underlying population growth is slowly but surely pushing the unemployment rate upwards.
The of labour wastage is now at least 13.6 per cent. Add to this the impacts of the falling participation rate over the last two years and the figure is approaching 15.5 per cent.
The most striking aspect of a sad picture remains the appalling performance of the teenage labour market. Employment has collapsed for that cohort since 2008. I consider it a matter of policy urgency for the Government to introduce an employment guarantee to ensure we do not continue undermining our potential workforce.
The data certainly shows that the new government has to reverse the contractionary bias and that means only one thing – more fiscal stimulus is definitely needed.
It is time for the conservatives to abandon their free market/anti-government biases and do some public sector job creation, which will arrest the current decline and stimulate private sector activity and employment!
However, at least one politician will claim in the next week or so that we are near full employment and the government deficit needs to be cut. That is the appalling state that we find ourselves in.
That is enough for today!
(c) Copyright 2013 Bill Mitchell. All Rights Reserved.

Bill,
From your analysis it would appear the timescale for the current recession has reduced so instead of 71 months roughly 30 seems appropriate. Reviewing 71+ months for previous recessions may provide a guide to future events if you believe history provides some insight?
The UK flood and storm crisis illustrates the political facts that relate to employment, unemployment and equity. When the needs of poor people and unemployed people are the issue then money is an object. We have austerity. When the needs of propertied people become involved (floods inundate land and houses owned by propertied people) then suddenly, to quote David Cameron, “money is no object”. When there is an emergency that affects the propertied class and the re-election chances of a right-wing government we find suddenly that “money is no object”.
Could there be any clearer example of the correctness of MMT principles in this context? The government is not money limited, it is only real resource limited and politically limited. A government can do anything that the people permit (or require) and that real resources and the laws of physics permit. Cameron’s words were literally correct in economic, scientific and philsophical terms. “Money is no object.” Money is not an object, it is not physical, it is merely notional. Of course, the irony is that the intellectual-midget Cameron has no idea how literally true his words were.
Nevertheless, the neoliberal or neoclassical backpedalling has started almost immediately. Whenever a true statement is vouchsafed it has to be retracted as soon as possible. “.. only hours after his “I’m in control” press conference, ministers were insisting there was “no blank cheque” – IBT
“I don’t think it’s a blank cheque. What the prime minister was making very clear is that we are going to use every resource of the government and money is not the issue while we are in this relief job, in the first instance, of trying to bring relief to those communities that are affected,” – Transport Secretary Patrick McLaughlin.
The other plain fact is that climate change is now driving extreme events. Recent research shows that Australia’s 2012 (IIRC) heat could be achieved in only 1 of 13,000 runs of advanced climate models which excluded human input (forcing). It seems clear that there is a high probability that US East Coast weather and Britain’s storm weather (related and driven by the same jet stream patterns) are as severe as they because of global warming. IMO, and in the opinion of a considerable number of climate scientists, the earth’s climate is beginning to destabilise from its Holocence pattern of relative stability and benignity. The implications are dire. It was the Holocence climate pattern which essentially facilitated the rise of agriculture and the rise of civilization.
Final Note: While I accept the near term validity and facility of MMT to assist us, we have to go much further. We have to end capitalism and institute a low environmental impact, steady state socialist economy. However, since the current system is entrenched, sclerotic and maladaptive, change can only come after a series of widespread salutary disasters provide incontrovertible proof of the maladaptiveness and indeed the doomed nature of the entire current system. Even then the future is only viable if we react cooperatively rather than competitively to this looming series of crises.
The Australian statistics for unemployment levels among the young are obviously creating as much concern as those here in Europe. That suggests that the problem is not confined to one nation but is more likely to be a world-wide phenomenon. If that is the case, is the call for a boost to employment prospects by government stimulus anything more than a temporary palliative. In other words, is there something fundamental going on in western economies that may have long term effects on the labour market. Some of these labour market developments may have micro origins and remedies. The question then arises as to how far you thrust government into a morass that may only lead to obfuscation and interminable wrangling. If the outcome involves loss of government credibility and huge expenditure, what is the political cost. As you can see from the following web-site (chosen at random) the question of education is fundamental to this issue, and it can elicit a range of powerful responses. http://www.theguardian.com/commentisfree/2013/nov/14/youth-unemployment-wreck-europe-economic-recovery
Dear Gogs (at 2014/02/14 at 22:45)
When there are not enough jobs the least advantaged/skilled/experienced get shuffled to the back of the jobless queue.
There is a world-wide shortage of jobs – hence the youth unemployment problem is world-wide. Every time, in history, employment grows faster than the underlying population growth, the long-term unemployed, youth, disabled, indigenous etc eventually start to get employed as firms compete for the ever more scarce labour.
It is no mystery. It is simple.
best wishes
bill
Dear Bill,
Are you saying that the simple answer is to expand the economies of the west creating initially whatever jobs we can. That these will be accepted even if they pay less than was previously the going rate (possibly enhanced by income support). I pose this question because it is possible that some of the higher skilled jobs of previous generations may not longer be available, having been exported to Eastern nations.
This is a genuine concern to me because productivity levels in UK (and possibly elsewhere) are falling but no explanation as yet has been forthcoming. I am also concerned how much Governments can do to solve such a problem without creating a lot of unrest. We are already seeing a growing resentment to the entitlements of an ageing population by a hard pressed younger generation
Thank you
All governments and their Central Banks need do is put full employment at the top of their to do list.
it’s that simple.
“This is a genuine concern to me because productivity levels in UK (and possibly elsewhere) are falling but no explanation as yet has been forthcoming.”
The explanation is very straightforward. The UK didn’t sack as many people during the recession as the neo-liberal theory said firms should. But because there was a drop in demand, the firms didn’t produce as much. Therefore productivity appeared to drop – because the firms had more people on staff than they strictly needed. But because those wages were being paid, demand didn’t drop further, therefore validating the decision not to let the staff go.
So in the UK we didn’t see the unemployment or the drop in the participation rate seen in other countries. But we did see an effect due to an apparent decline in productivity.
The reason you never see an explanation is because that would require those making the explanation to abandon their marginal productivity religion.
You get the same blank-eyed look when you ask the religious to explain famine as the act of a loving God.
“I am also concerned how much Governments can do to solve such a problem without creating a lot of unrest. We are already seeing a growing resentment to the entitlements of an ageing population by a hard pressed younger generation”
Only government can solve the problem. It is irrational for the private sector to create many more jobs than it requires, which means as it mechanises and requires less people you hit a paradox. Nobody has any money to buy the output of the machines.
You can only correct that so far by employing people in all the non-jobs in marketing, PR and finance.
The Job Guarantee effectively pays the state pension to any citizen who wants it, and in return requires those receiving it to work on socially acceptable projects – unless they are considered exempt by reason of age or infirmity.
What the socially acceptable projects are and what age and level of infirmity gives you an exemption are determined politically by the rest of us – as a means of diffusing the feeling of resentment sufficiently to allow the scheme to actually stay in place long term.
So you can choose to be on the Job Guarantee, thereby removing the resentment that somebody else is getting something you can’t have.
You have to do work on the Job Guarantee that your peers consider acceptable for the wage, thereby removing the resentment from others that you are getting something for nothing.
And the payment of the Job Guarantee keeps the demand up in the economy ensuring that all those private sector machines can whirr away producing goods that will then be purchased.
Printing more money to fund job guarantees reduces unemployment but increases inflation. Tolerating more inflation is solidarity with the unemployed. The unemployed will become your customers or your employer’s customers so it’s actually an act of self-interest to get them work.
Dear Benson Njonjo Ndehi (at 2014/02/15 at 18:11)
You asserted:
That is a wrong conclusion. As long as Job Guarantee pays a minimum wage and doesn’t compete for labour it cannot increase inflation irrespective of how the scheme is funded in an operational sense.
You are falling into the Monetarist trap about central banks expanding liquidity which was proven wrong years ago.
best wishes
bill
We have been conned for the past century or so into the idea that unrestrained compounding is “normal” and possible for everyone. This is the natural definition of cancer! The sudden concentration of wealth by a very few has led to intractable global outcomes that can only happen through a lack of personal compassion by those who are most aqusitive accompanied by a massive misinformation campaign to convince everyone else that this is not happening. Your optimism that a government can be put in place that will do the right thing is highly suspect! Paul Krugman’s statement that crypto currencies are dangerous because they are not backed by guns displays a level of intellectual bankruptcy that defies imagination.
We need to figure out how to empower very local and very small scale proactivity! If it needs to be done for the good of some facet of the whole the activity should only have to be described and open to review in order for it to be funded. Our environmental catastrophe is now driven by senseless economic activity that destroys the basis of all life! Your discussion is of crucial importance but lacks a cohesive underpinning of how to figure out what should be done as all productivity is automated.
Bill –
Two problems with that:
1) By paying a minimum wage, wouldn’t it compete for labour with other employers paying a minimum wage?
2) More importantly, as more people would have money, more money would be spent. Isn’t that inflationary?
1. The job guarantee wage is the minimum.
2. You seem to have neglected that more will be produced.
As long as it is possible to increase production, more spending does not cause inflation.
Producers are themselfs in competition against other producers. If they try to increase prices customers will go away. So they will respond to increased demand by producing more, because that also increases profits.
So out of two possible ways to increase profits, increasing prices and increasing production, only latter works.
“1) By paying a minimum wage, wouldn’t it compete for labour with other employers paying a minimum wage?”
‘Compete’ in Bill’s quote means raise its offering to stop others bidding staff away.
PZ –
Your argument, like many mainstream economic arguments, depends on perfect competition, which unfortunately we don’t have.
“Your argument, like many mainstream economic arguments, depends on perfect competition, which unfortunately we don’t have.”
It’s not a mainstream economic argument. It’s the market share argument, which Post Keynesians make all the time.
And it is also true in pretty much every industry I’ve operated in – all of which use markup pricing.
The hairdresser does not close the shop and increase their prices when there is a queue. Instead they work late to produce more output and service the customers – driving more profit and income out of their fixed costs.
Very few businesses, if any, operates at anywhere near maximum operational capacity. There is always something in hand – even if it is as simple as pulling a few hours overtime.
Niefl Wilson –
They don’t immediately increase their prices, but they’re more likely to increase their prices when demand is high than when demand is low.
And in most cases there always will be something in hand, as they put up prices long before they’d reach capacity.
Neil is correct in the market share argument. Individual firms will always expand quantity rather than be the first to raise prices and risk losing regular customers, which is death and they know it. Firms without individual marketing power cannot safe;u raise prices unless they all do so pretty much simultaneously., which is pretty much what gas (petrol) stations do in the US – unless there is a price war on that corner. Price wars among adjacent stations actually used to be rather common years ago but they are pretty rare now. Prices are industry wide in a particular region, although there are some exceptions, like cash only, or Costco, which is always a bit below the market, but only member can purchase there and membership comes at a cost.
Where one sees the price differentials is in sales and special promotions. Firms rarely compete wrt to final goods sales by changing the regular price.
Read a standard economics book on how prices are set and compare to a marketing book on pricing. There is no comparison. There is no mention of supply and demand in the marketing book. It’s all about the lifetime worth of customers, attracting new customers and keeping old ones, increasing market share, increasing market power, e.g., by branding, moving unwanted inventory without cutting prices publicly, etc. – in short, about administered pricing.
I had a friend who operated a retail store who told me one time how it works and how he has to always be using gimmicks to increase sales at the highest profit margin overall, which involves loss leaders, etc. He said he hated it and would like to just price by supply and demand, which is simple and easy, but that’s not how retail works now. It’s a dog eat dog game and one has to outcompete or at least stay even in the marketing game. I also had a friend who had a chain of specialty stores and he had mastered the game.
The regular retail price and the suggested manufacturer’s price are “anchor” prices. See cognitive biases-anchoring. Sales, advertising and marketing have been about applied psych and using cognitive bias since Edward Bernays, who happened to be the nephew of Sigmund Freud. The use of psych was prevalent by the Fifties in the US.
Tom, you’re making the mistake of assuming all busineses behave the same way. But they don’t. Grocery retail is very price competitive, but the price of some groceries keeps rising.
Aidan, see the extensive posting on administered price by Lord Keynes at Social Democracy for the 21st Century. It accords with what I have observed anecdotally.
In administered pricing, firms set price and adjust quantity rather than setting quantity and adjusting price. The details of how this is done vary somewhat by industry and the context of prevailing strategy and tactics, which are in flux aiming at competitive advantages. But the general principles are the same.
BTW, in the US the grocery business is structured relative to class with different stores delivering the essentially the same merchandise to different strata of society at different prices based on positioning. Classes pretty much go to the stores they are “supposed” to go to from what I have determined from observation of the phenomenon.
I’ve talked to people, too, and this is pretty conscious, at least among some. People the to queue up on class lines.