Today (April 18, 2024), the Australian Bureau of Statistics released the latest - Labour Force,…
Today’s mantra – 13.4 per cent wasted labour
Today’s ABS Labour Force data confirms one thing. Whatever else the commentators say about the figures are not as bad as expected or that employment is still growing or whatever – there are 13.4 per cent of the willing and available labour resources not being fully utilised by this economy. Around 657 thousand have no jobs at all and another 866 thousand have a job but want more hours and cannot find the work. 1.5 million wasted workers is an appalling state that demands urgent action – like direct public sector job creation. Each day that we waste the capacity of those workers is another day of income and opportunity lost down the drain. It should be the absolute number one policy priority. And what it tells me is that the budget deficit is way to low as a percentage of GDP at present.
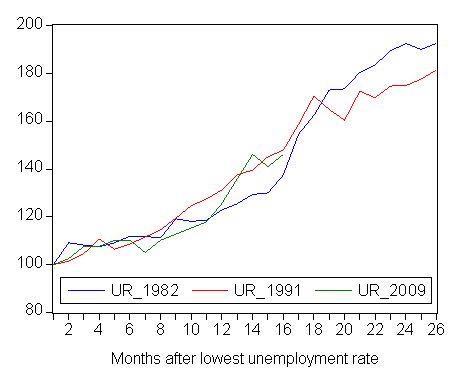
To put things in perspective I have updated my 3-recessions graph. The following graph depicts how quickly the unemployment rose in Australia during each of the three major recessions in recent history: 1982, 1991 and now 2009. The unemployment rate was indexed at 100 at its lowest rate before the recession in each case (June 1981; November 1989; February 2008, respectively) and then indexed to that base for each of the months until it peaked. So you get a graphical illustration of the speed at which the recession unfolded (which tells you something about each episode) and the length of time that the labour market deteriorated (expressed only in terms of the unemployment rate).
So while there is semi-euphoria about the “good result” (I actually think 5.7 per cent or 654,900 persons unemployed is appalling), the sharp rise in the official unemployment rate since February 2008 is matching the rate of deterioration that we saw in 1991 although the level is still below that of 1991. Take note though – underemployment has risen very sharply which makes no virtue of the fact that unemployment is lower at a similar stage of the cycle this time than in 1991 – see below for more analysis.
While the unemployment rate has risen as has the broad labour underutilisation rate it is worth noting that total employment fell in net terms by only 1200 or 0.1 per cent. The ABS Labour Force publication says that “Full-time employment decreased by 26,200 to 7,643,100 and part-time employment increased by 24,500 to 3,150,000.” So this is not a major contraction of jobs but certainly when the underemployment estimates are taken into account it does represent a major contraction of hours of work on offer.
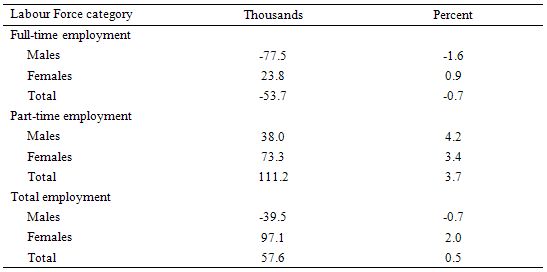
The following table shows that since the unemployment rate started to rise from February 2008, total employment has actually risen by 0.5 per cent (57.6 thousand) with part-time employment growing by 3.7 per cent (111.2 thousand) and full-time employment falling by 0.7 per cent (53.7 thousand).
In net terms, 77.5 thousand male full-time jobs have disappeared while female full-time employment has risen. Very strange!
Further, both males (38 thousand) and females (73.3 thousand) have accounted for the rise in part-time employment.
In net terms, total male employment has dropped 39.5 thousand jobs while females have gained 97.1 thousand jobs. This is quite a different pattern to the one that we saw in 1991.
So the economy is shedding full-time workers and replacing the hours with casual and part-time jobs. Most of these job losses will be coming from Manufacturing which is faring very badly at present whereas most of the job gains will be in the retail areas that are benefiting from the fiscal stimulus packages.
Of note, the ABS has published its broader underutilisation estimates – including underemployment – in this month’s data making a break in its previous practice of providing annual estimates.
The Labour Force publication defines labour underutilisation as:
… the extent to which available labour is underutilised – either through unemployment or underemployment. The extent to which available labour is underutilised is of interest from a number of perspectives. From an economic perspective, there is interest in the amount of spare capacity in the labour supply and its potential to contribute to the production of goods and services – there is a strong correlation between movements in unemployment and underemployment over the economic cycle. From a social viewpoint, there is concern that people whose aspirations for work are not being met may suffer financially, personally and/or socially.
In other words, we should be worried about it!
Since the start of the deterioration (February 2008), male underemployment has risen from 269.2 thousand to 399.2 thousand, which in rate terms is a rise from 4.4 per cent to 6.4 per cent (May quarter). Female underemployment has followed a similar path rising from 391.9 thousand (7.7 per cent) to 471.6 thousand (9.1 per cent).
In total there are now 870.8 thousand workers (7.6 per cent of labour force) who report not having enough work.
When underemployment (870.8 thousand) is combined with official unemployment (651 thousand) we get over 1.5 million workers with not enough work or a staggering 13.5 per cent of the available labour. This underestimates the total labour slack because it does not include those who have left the labour force or not entered it because they didn’t see any opportunities.
The data means that labour market is adjusting hours of work on offer more than it is laying off workers at present. This is the typical pattern early in a downturn but the magnitudes involved this time are significant. Over the current cycle and extra 220 thousand employed workers are being forced by lack of economic activity to endure less hours of work that they desire.
The underemployment is also unevenly dispersed across the spatial landscape with the larger states bearing the brunt – NSW (14.2 per cent), Victoria (14.4 per cent), Queensland (12.8 per cent), South Australia (13.6 per cent), Western Australia (11.8 per cent), Tasmania (12.6 per cent), Northern Territory (6.6 per cent) and ACT (8.6 per cent).
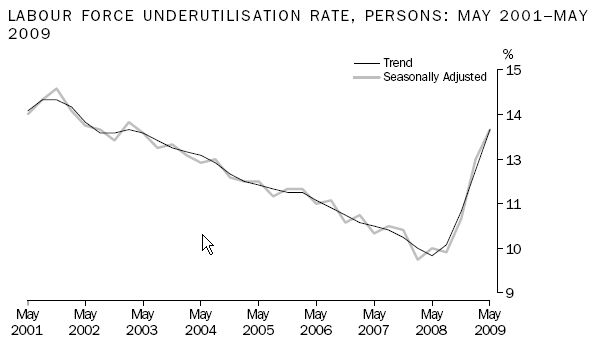
This graph is taken from the ABS Labour Force publication (page 4) and shows the evolution of broad labour underutilisation since May 2001. You can see how sharply the sum of unemployment and underemployment has risen in the last 12 months.
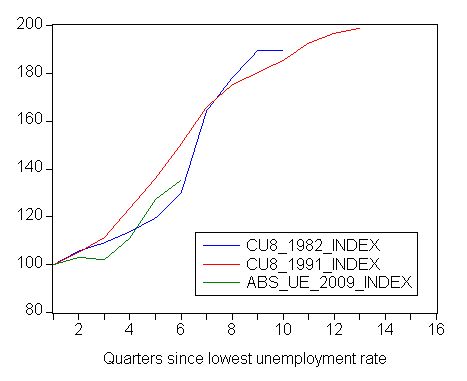
How does this spike in total labour underutilisation compare with previous recessions? The following graph replicates the first unemployment rate index graph but instead uses the CLMI estimates for broad labour underutilisation (except that we have used today’s ABS estimates for 2009 because the CLMI estimates for the current quarter requires data that will not be released until next week). So once again the time series are indexed to 100 at the lowest unemployment rate for the respective quarter.
The green line is the ABS quarterly labour underutilisation series which shows that the rate of overall deterioration in the labour market is somewhere between the 1982 and 1991 recession. Meaning we are not out of the woods yet!
Conclusion
I recorded an interview with Stephen Long today for tonight’s national ABC PM program. I said I thought that two views are possible conclusions one could draw from a detailed examination of the data – that we are witnessing either a huge storm cloud building up and getting ready to burst, or, alternatively, we are witnessing an economy that is sailing on stormy seas and ingesting an early and significant fiscal intervenion, which will help it muddle along and probably make it back to land. The latter scenario is better but both will result in unacceptably high rates of underutilised labour unless more is done by way of direct public sector job creation
If I was pushed to say one way or another I would probably err on thinking the economy is muddling along on the back of the fiscal policy intervention – it was early and fairly significant and is probably providing a floor for demand which means it will provide a floor for the labour market.
But when I recall last week’s national accounts data and the dramatic falling away in business investment then I have a sober view about how fast any recovery will be. With the stimulus to consumption (handouts) running out soon, the economy will rely on growth in public infrastructure investment to keep growing. That will probably give us some time and may (remember those animal spirits) prompt a new burst of private investment.
Overall, in the next 2 years, business investment will have to bounce back quickly or the fiscal stimulus will have be ramped up. I think the labour market is in very bad shape at present – you cannot take any other opinion when 13.4 per cent of your willing labour resources are underutilised. And while net employment is, so far, holding up it is at the low productivity, low pay, low quality end of the spectrum. That doesn’t augur well for any robust recovery.
In my view there is a vital need for more fiscal stimulus to try to bolster the fortunes of the men who have been blasted out of full-time work. But then I am not captive to the debt-deficit hysteria that rules this land at present.
New blog
New Economic Perspectives is a blog which is multi-authored by some mates of mine – Randy Wray, Jan Kregel, Stephanie Keltie and William Black, and published out of University of Missouri-Kansas City. Randy and I are currently working on a macroeconomics text book together.


Bill, I cant see anything in the new blog except the titles of the blog posts. When I click on them, it takes me to the individual blog post but with the title only.
Dear Ramaman
I cannot imagine what is wrong. It is looking fine at this end. Try a total refresh of the page (Ctrl-F5). Please let me know if you are still having troubles.
best wishes
bill
Tried total refresh, using different browsers etc. It may be the case that its a local issue (am writing from India), but I even tried Google Reader, which I would imagine ‘pulls out’ the contents using its servers to display it on its page. Will write to you if doesn’t show up after a few days.
Dear Bill,
I am having the same problem as Ramanan viewing the New Economic Perspectives blogs.
cheers, Alan
If the trend towards employers cutting hours rather than whole jobs continues, we might get the opportunity to witness first hand what happens when a significant percentage of the population takes a pay cut.
Some economist in yesterday’s or the day before’s Australian argued that the run up in private debt was ok because despite arguments to the contrary, Australians remained able to service those debts. I guess he didn’t think about the possibility of mass working hour cuts and casualisation – your income unexpectedly drops and suddenly you can no longer properly service those debts.
Dear Alan and Ramaman
The link to the new site that Randy et al have up seems to be working for me. It is not hosted by my servers so I cannot do anything other than send a message to Randy (I have to telephone him today anyway) and let him know. The site seems to function okay for me.
best wishes
bill
Dear Lefty
Yes, that is a good point. A lot of household economies were based on the boom continuing and the second income earner having casual hours of their choice. That is drastically being changed at the moment and for those with nominal debt commitments that are close to the edge a cut back of casual hours will be as devastating as unemployment. There are a lot of “debt deniers” out there but they never look at the escalating forced mortgage sale data.
best wishes
bill
In such cases I think that the household would be faced with a choice – either default on their debts or slash their consumption spending (many may not even have this choice if their debt-to-income ratio is too high). I’m pretty certain that most of those who do have a choice will choose to reduce their consumption spending. If that becomes a broad trend it will hardly give many employers any incentive to return people to full-time hours of work, which in itslef would act to keep consumption spending depressed – a self-reinforcing cycle.
Forced mortgage sales are certainly occurring in my area. My brother-in-law is a victim of the downturn (I always argued that jobs such as safety course trainers contracting to the big resource industries here would be among the least secure in a downturn). I doubted that they would get what the real estate agent assured them they would get for their house (just under $400 000). It recently went under contract but fell over yesterday. My parents have been trying for quite a while to sell my grandfather’s house. It has been under contract FOUR times and each time has fallen over for lack of ability to secure finance. It finally went unconditional yesterday – for almost $100 000 less than the agent assured them they would get for it.
I think the local bank branches are seeing a big red flashing light over Gladstone: Warning! Credit risk!