Today (March 20, 2025), the Australian Bureau of Statistics released the latest - Labour Force,…
Teenage employment decline in Australia reaching catastrophic proportions
Regular readers will know that for some years we have been documenting the parlous state of the youth labour market in Australia. In an environment where fiscal cuts are being justified as looking after the future as the population ages, the most glaring thing that will undermine our future prosperity is the lack of attention policy makers are giving to the youth unemployment problem. The media has only just started to register that our ‘future’ workers are growing into adults having never worked nor gained the requisite experience to deliver high productivity outcomes. The personal future of this cohort is bleak. Recently, the Brotherhood of St. Laurence as (finally) launched a national campaign My Chance, Our Future to “draw attention to the crisis of youth unemployment in Australia”. Better late than never I suppose but what took them so long.
I last did this sort of analysis in February 2012. Please read my blog – Age discrimination against our teenagers should end – for more discussion, which provides the basis for comparison.
At that point in time, I noted and/or estimated that:
- The decline in the teenage participation rate from January 2008 (the most recent peak) and January 2012 translated into 98.3 thousand teenagers having left the labour force since the crises began (in February 2008) as their employment prospects vanished. That figure has to be added to any hidden unemployment that was present at the peak of the cycle.
- In January 2012, the official teenage unemployment rate was 16.3 per cent
- If you add the 98 thousand back into the official unemployed then the 15-19 unemployment rate rises to 25.3 per cent rather than the 13.5 per cent recorded as the official unemployment rate by the ABS.
- The underemployment rate for 15-24 year olds was 13.5 per cent at that time.
- Add the three sources of teenage labour underutilisation together and the broad labour force underutilisation rate for teenagers was around 38.8 per cent in January 2012.
Since that time, as the teenage labour market has continued to deteriorate, that broad labour underutilisation rate has risen sharply.
Employment falling for 6 years
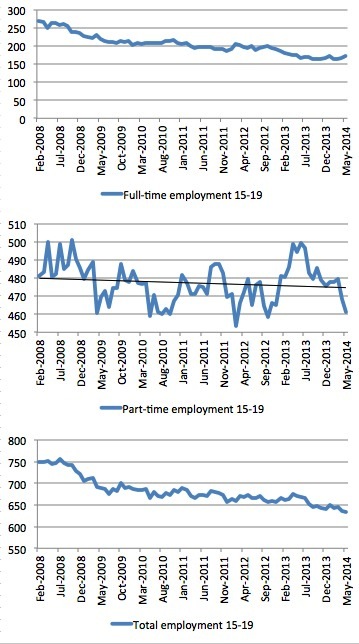
I have already documented the declining employment for teenagers on a monthly basis. Since February 2008, there have been 917 thousand (net) jobs added to the Australian economy but teenagers have lost a staggering 117.3 thousand over the same period. It is even more stark when you consider that 97.2 thousand full-time teenager jobs have been lost in net terms.
Even in the traditionally, concentrated teenage segment – part-time employment, has shed 20.1 thousand jobs (net) even though 521.3 thousand part-time jobs have been added overall.
Overall, the total employment increase is modest. Further, around 54 per cent of the total (net) jobs added since February 2008 have been part-time, which raises questions about the quality of work that is being generated overall.
The following graph shows this sordid history. The black line on the part-time employment graph is a linear trend to make what is happening clearer.
So not even in the part-time area where teenagers have an advantage are they gaining traction.
To put the teenage employment situation in a scale context, we use the Employment-Population ratio. The male ratio has fallen by 11.3 percentage points since February 2008, the female by 7 percentage points and the overall teenage employment-population ratio has fallen by 9.2 percentage points.
These are dramatic shifts.
Youth unemployment rates
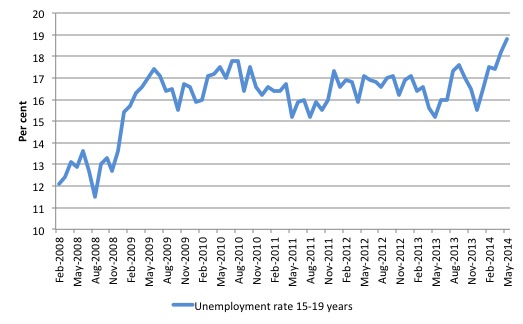
The teenage (15-19) unemployment rate was 12.1 per cent in February 2008, which marked the low-point unemployment of the last cycle nationally (the peak of the output cycle). There was a sharp increase in the unemployment rate as the economy slowed but that was arrested by the fiscal stimulus.
However, the stimulus was not sufficient large or maintained for long enough and the overall economy failed to grow fast enough to reabsorb those 15-19 year olds who lost work during the early period of the slowdown.
Now the economy is slowing again, the unemployment queue for 15-19 year olds is increasing, notwithstanding the plunge in participation and the unemployment rate is now shooting upwards again.
In May 2014 it stood at 18.8 per cent, a 50 per cent deterioration since 2008.
Over the same period, the 20-24 year cohort has seen its unemployment rate rise from 6.6 per cent to 9.9 per cent, again a similar sort of deterioration.
In the April edition of the BLS My Chance, Our Future Report, they note that:
The experience of being young and unemployed is also changing. The inexorable rise in the incidence of youth unemployment has come alongside an increase in the length of unemployment for those aged 15 to 24. In January 2008, the average duration of unemployment for a young person in Australia was slightly above 16 weeks. More than five years later – by February 2014 – the average duration had risen to nearly 29 weeks.
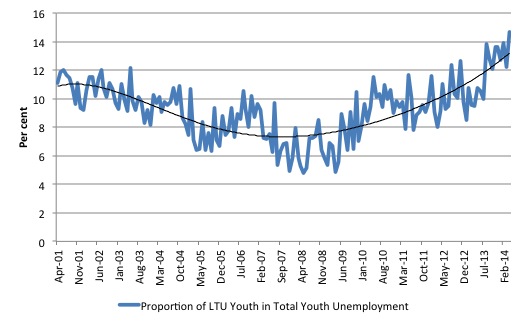
But worse still is that a higher proportion of youth (15-24 years) are now stuck in long-term unemployment (greater than 52 weeks in duration).
The following graph shows the proportion of LTU youth as a percentage of total youth unemployment. The data is original (not seasonally adjusted) so I ran a 5th-order polynomial through it to give the trend (the smooth black line).
The average duration of unemployment for the 15-19 olds was 79 weeks and 101 weeks for the 20-24 year olds.
Participation rate falling sharply
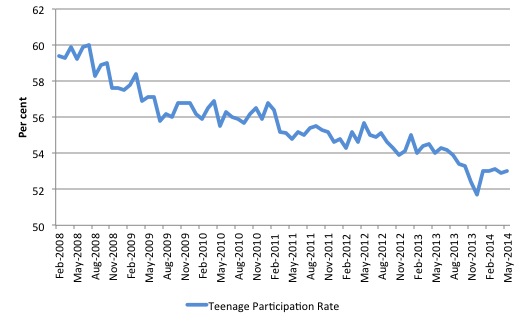
In January 2008, just before the GFC was starting to hit the Australian labour market, the teenage participation rate had peaked at 61.2 per cent. By May 2014, it has fallen to 53 per cent. This is a major decline (see related analysis later of the rising NEET problem).
The following graph shows the decline.
Youth underemployment
The ABS only publish underemployment data for the 15-24 year old cohort on a quarterly basis. In February 2008, that rate was 10.9 per cent.
By the May-quarter 2014, it had risen sharply to 15.4 per cent.
So not only has employment plummetted, unemployment risen sharply, and participation collapsed, but those who have managed to keep part-time employment are now increasingly facing hours rationing below their desired working levels.
The following graph shows the evolution of the youth underemployment rate since Febrauary 2008.
Bringing this all together to estimate the broad labour underutilisation rate for teenagers
In May 2014, we know that:
- Since February 2008, teenagers have lost 117.3 thousand jobs overall and 97.2 thousand full-time jobs
- The official teenage unemployment rate was 18.8 per cent (and rising)
- The participation rate was 53 per cent down on its January 2008 peak of 61.2 per cent. It is thus likely that hidden unemployment has risen dramatically as teenagers have found search futile given the lack of jobs available to them.
- Youth underemployment has risen from 10.9 per cent to 15.4 per cent since February 2008.
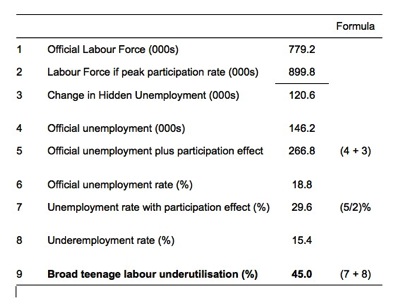
So, what does this all mean for the broad labour underutilisation rate for teenagers? The following Table breakdowns the individual components of the broad rate into official unemployment, the rise in hidden unemployment due to the participation effect, and the underemployment component.
First, the participation rate effect. What does that imply about hidden unemployment for 15-19 year olds? If we consider all the decline in participation rate decline to be the result of a discouraged worker effect (which will not be far off the mark given there has been no major changes in education policy in the meantime), then the 15-19 year old labour force would be around 899.8 thousand in May 2014 rather than 779.2 thousand which was officially recorded.
The decline in the participation rate since January 2008 thus translates into 120.6 thousand teenagers having left the labour force since the crisis began as their employment prospects vanished. That figure has to be added to any hidden unemployment that was present at January 2008 to get a true indication of the extent of hidden unemployment.
We can assume that given the peak participation rate, that hidden unemployment was relatively low at that time. But the strict interpretation of the participation effect estimated here is that it tells us about the change in hidden unemployment since January 2008.
Second, if we add the change in hidden unemployment (120.6 thousand) to the official unemployment (146.2 thousand in May 2014) then we would estimate that some 266.8 thousand 15-19 year olds were either unemployed or near unemployed (the difference is the activity test for participation) in May 2014.
Third, the official unemployment rate of 18.8 per cent would be revised upwards to 29.6 per cent if we added in the participation effect.
So the declining labour force as a result of the falling participation rate means that the official unemployment pool is lower than it would have been had the participation rate remained constant at its January 2008 value.
Fourth, if we then add in the underemployment rate of 15.4 per cent (noting again that this is the 15-24 year old rate and so we are approximating) we get a broad labour force underutilisation rate for teenagers of 45 per cent in May 2014.
In May 2014, we can estimate that:
- The decline in the participation rate to 53 per cent from its January 2008 peak of 61.2 per cent means that 120.6 thousand teenagers have left the labour force since the crisis began as their employment prospects vanished.
- If we add those hidden unemployed teenagers to the official unemployment estimated by the ABS then estimate that some 266.8 thousand 15-19 year olds were either unemployed or near unemployed (the difference is the activity test for participation) in May 2014.
- The adjusted unemployment rate to take into account this participation effect is 29.6 per cent in comparison to the official ABS rate of 18.8 per cent.
- Adding the underemployment rate of 15.4 per cent gives a broad labour force underutilisation rate for teenagers of 45 per cent in May 2014.
NEET rates are rising
One of the disturbing trends in the last 15 years has been the increasing number of young people that are neither in employment, nor in education or training (NEET). This suggests that the systems which provide transitions between education and employment are breaking down.
The main reason is the lack of jobs available.
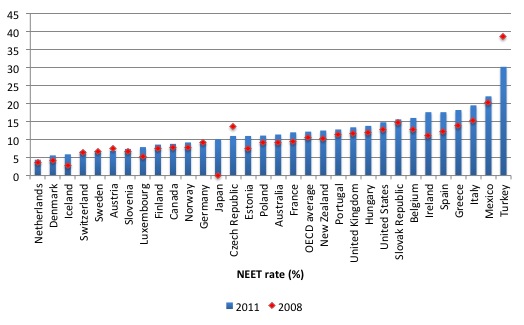
The first graph shows the NEET rate (%) for 2008 (red) and 2011 (blue columns) for the OECD nations. The OECD publish this data on an irregular basis. For most nations, the rate is rising.
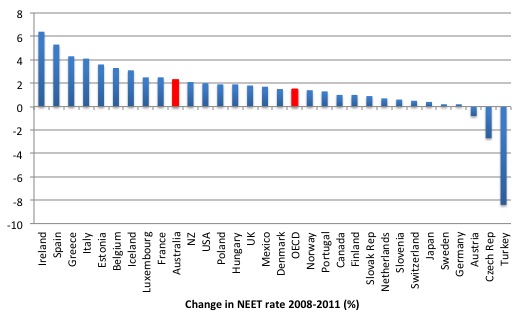
The next graph shows the change (percentage points) in the NEET rate between 2008 and 2011. Australia and the OECD average are shown in red columns. Australia is now one of the above-average nations in terms of an increasing NEET population.
It is anticipated that the NEET rate in Australia will have risen in the period since 2011 given the poor state of the youth labour market over that time.
Conclusion
Whether the politicians want to recognise this or not – figures like these are catastrophic for the current lives of our teenagers and young adults and for the future prosperity of the nation.
Australia has a rising dependency ratio. The challenge that presents relates to the capacity of the economy to produce new goods and services and to generate employment and productivity growth.
A government that issues its own currency clearly always has the capacity to pay – in the sense that it can always buy whatever is for sale in the currency that it issues. There is no sense in which a currency-issuing government can ever ‘run out of money’.
But there is a possibility – one that can be avoided, or at least attenuated through sound economic policy – that an economy will fail to produce sufficient real goods and services commensurate with the expectations (concerning the standard of living) of the population.
It is in this respect that rising dependency ratio presents a challenge that must be met by government. The obsession with budget surpluses that current policy is driven by will actually undermine the future productivity and future provision of real goods and services.
The quality of the future workforce will be a major influence on whether our real standard of living (in material terms) can continue to grow in the face of rising dependency ratios.
Governments should be doing everything that is possible to educate, train and employ our youth so that they will achieve higher levels of productivty into the future and offset the inevitable rises in the dependency ratio.
This requires:
1. That there is significant investment in education – governments should not try to “save” money (as part of some mis-guided fiscal consolidation program) by cutting expenditure to public schools. The recent fiscal statement plans if carried out will severely undermine the quality of our education system.
2. There should be ways to ensure the youth are either in education or work.
The first thing a forward-looking government should do is to introduce a Youth Guarantee – which would ensure that no teenager is without work should they decide to participate in the labour force.
At the other end of the age spectrum, the concern is clear – older workers who are forced to exit the labour market prematurely are not able to bring their considerable experience to bear on developing high productivity workplaces.
The Youth Guarantee should embrace both ends of the age spectrum – the older workers bring their experience to develop skills for the teenagers who cannot find work elsewhere and do not wish to participate in full-time education.
This should be a policy priority. It is now an emergency.
That is enough for today!
(c) Copyright 2014 Bill Mitchell. All Rights Reserved.

Bill, Have you actually proved anywhere that discrimination against youths is taking place which is not justified by the productivity of youths versus prime age employees?
I suspect the reality is that youths just are not all that productive, and that this is not reflected in the wage of youths relative to prime aged workers because of minimum wage laws, trade union imposed wage rates, etc.
The brute reality is that employers look at the productivity of ALL the different types of input (labour, capital equipment, etc) and buy or don’t buy according to what looks like value for money. And it’s near impossible to stop employers doing that. Ergo the best solution is to make the cost employing youths sufficiently attractive (maybe via an employment subsidy) to induce employers to take them on.
Ralph,the jobs are just not there.
Youth unemployment is not a new problem and both Tories and Labor are complicit in ignoring and exacerbating it.
This situation is already causing widespread social problems and this will get worse. Most,if not all young people have a natural desire to fit into society and be useful. Deny them this and they will rebel in self-destructive and socially destructive ways. Economics,after all,is a “social science”.
Meanwhile,to add insult to injury,our Cretins in Charge persist with an insane immigration policy.
There actually were subsidies to employers for trade apprentices, especially in skill shortage areas. These applied both to school leavers and mature age workers who were retraining. The existing programs are being scrapped in order to mirror the loans system for university students – essentially asking new apprentices to go into debt to fund themselves while they accept the low wages and set-up costs of learning a new trade.
This doesn’t necessarily reduce government expenditure for these programs (as the money still gets paid) but raises the barrier to entry and ensures that even those who complete their apprenticeships and attain full time employment are contributing less to aggregate demand as their wages are garnished to pay back the debt.
Bill, would you say the Ageist trend (against our youngest and oldest participating citizens) is as intense as the “classist” trend?
Ralph, I would say that teens and young adults are as productive as any prime aged employee with similar training – and moreso if it’s anything to do with computers. Of course, it doesn’t help that high school, polytechnic college and university aren’t anything remotely like the realities of the working day.
Is Ralph suggesting that once people turn 30yrs old they instantly become more productive regardless of the fact they were unemployed from the age of 16 to 29 ?
Vintage Ralph.
The ‘hype’ of labelling these people as ‘less productive’ and ignoring aggregate cold hard numbers is stupid Ralph.
How ‘productive’ do you have to be at any given job? When does that start? How do you determine the threshold of ‘productivity’ As per usual people making these claims have no idea how business actually functions!
Is there a counterexample where someone enters the job who is instantly more productive than the ‘youth’… essentially the future of Australias workforce and should be working for 40+ years. (pointingout obvious logical flaw in the just ‘lazy’ argument). This only happens when there are by aggregat less jobs!
How ‘productive’ does one need to be in retail, advertising, construction, IT? all very different and at no point do these parameters discriminate by age.
The situation is dire and it has NOTHING to do with youth being ‘lazy’.
Even if you play by the game get an apprenticeship/degree by the time you are skilled up and ready to enter the workforce the ‘skills crisis’ that was exagerated (moronswho cant count or plan) in conjunction with the lack of jobs means the probability of getting a job with qualifications needed are lower anyway.