Today (April 18, 2024), the Australian Bureau of Statistics released the latest - Labour Force,…
The ageing impact on Australian labour force participation rates
Labour force participation rates are falling around the world signalling the slack employment growth that has accompanied the aftermath of the Global Financial Crisis. It is clear that many workers are opting to stop searching for work while there are not enough jobs to go around. As a result, national statistics offices classify these workers as not being in the labour force, which had had the effect of attenuating the official estimates of unemployment and unemployment rates. These discouraged workers are considered to be hidden unemployment. But the participation rates are also influenced by compositional shifts (changing shares) of the different demographic age groups in the working age population. In most nations, the population is shifting towards older workers who have lower participation rates. Thus some of the decline in the total participation rate could simply being an averaging issue – more workers are the average who have a lower participation rate. This blog investigates that issue for Australia as part of a project aiming to get more accurate measures of hidden unemployment.
The Reserve Bank of Australia recently published a speech by the Assistant Governor (Christopher Kent) – Cyclical and Structural Changes in the Labour Market – which was presented to the Labour Market Developments conference, hosted by The Wall Street Journal in Sydney on June 16, 2014.
Among other things, the RBA official said that:
The ageing of the population is not new. By itself, ageing is estimated to have subtracted from the participation rate by between 0.1 and 0.2 percentage points per year over the past decade and a half … However, the effect has picked up a little in recent years as baby boomers have begun to reach the age of 65 years.
This is the so-called structural thesis, which is often used by those who wanted to discourage the use of fiscal policy to redress cyclical shifts in economic activity and behaviour.
The discouraged worker effect relates to one such cyclical effect whereby workers fail the activity test built into the Labour Force Survey and the national statistician (the ABS in this case) excludes the worker from the labour force estimate.
Specifically, the ABS asks the respondents:
1. Did you work for at least one hour in the past week? Yes: counted as Employed. No: more questions are asked.
2. If the answer was No, then the person is asked: (a) Are you willing to work?; and (b) Are you actively seeking work?
If the answers are: Yes, Yes, then the person is counted among the officially Unemployed.
If the answers are: Yes, No, then the person is counted as being Not in the Labour Force (NLF), that is, inactive.
The aggregates are then E + U = the Labour Force (LF).
LF + NLF = Working Age Population (WAP).
LFPR = LF/WAP
UR = U/LF.
The discouraged workers differ from the officially unemployed purely because they have given up active search. The evidence is strongly supportive of the view that they give up looking because there are insufficient jobs to go around and to protect their self-esteem from the multiple rejections they just stop looking and wait for employment growth to improve.
If they were offered a job they would take it and start work immediately. In that sense, they are functionally no different to someone who is unemployed. The discouraged workers are otherwise known as the hidden unemployed for that reason.
The LFPR thus is sensitive to the economic cycle because job search rises when times are good and falls when times are bad.
But the LFPR can also be influenced by trend factors (sometimes called structural factors) and the ‘ageing population’ is one such factor. The other is the gender balance in the WAP.
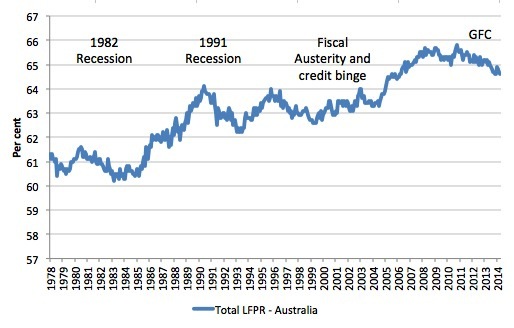
The following graph shows the aggregate (seasonally-adjusted) Labour Force Participation Rate (LFPR) for Australia since February 1978. The cyclical behaviour of the time series is very prominent and the annotions provide some assistance to identify the relevant periods.
The 1982 and 1991 recessions were deep and the LFPR plunged significantly. Upon the resumption of growth the LFPR recovered as the discouraged workers re-entered the labour force in search of the growing employment opportunities.
The period market fiscal austerity and credit binge was the start of the conservative government fiscal surpluses, which initially caused growth to falter and the LFPR to fall but then growth resumed at a modest rate courtesy of the beginning of the private sector credit binge. The later growth was a combination of the credit growth (slowing) and the rising Terms of Trade coming from the mining sector.
The LFPR fell again uring the GFC period as employment growth has flattened out. In Australia, this is not largely due to the effects of the GFC because the Federal Government’s large fiscal stimulus packages in late 2008 and early 2009 stopped the slowdown in its tracks.
Rather, the decline in employment growth and the fall in the LFPR came as the Government was bullied by the neo-liberals into retrenching the fiscal stimulus far too early and the economy has slowed as a result.
The question is: How much of that falling LFPR is due to the cyclical slowdown and how much of it is due to the ageing of the population?
The total participation rate (LFPR) is weighted average of the underlying participation rates of the demographic groups that make up the total Working Age Population (WAP). We will stick to using: three broad groups – young workers 15-24 years old; prime-age workers 25-54 years old; and older workers 55 years and over.
For those who like formulas we can write the total participation rate as:
LFPR(t) = (w1524 x LFPR1524) + (w2554 x LFPR2554) + (wGT55 x LFPRGT55)
In English this just says that the Total LFPR at time t is equal to the weighted sum of the participation rates of the three demographic groups, where the weights are given by the share of each demographic group in the WAP.
The weights are calculated, for example as: w1524 = Total Population of 15-24 year olds divided by Total WAP. And so on for the other two groups.
The following holds: w1524 + w2554 + wGT55 = 1
The weights just proportionately segment the total WAP into the three age groups respective shares.
Like any average, the total is influenced by the LFPR behaviour of the three groups and the weights each group has in the WAP.
For example, we could encounter a situation where the LFPRs for the three groups are unchanged but the total WAP becomes comprised on more of the GT55 group and less of the 1524 groups and if LFPRGT55 < LFPR1524, then the total LFPR will fall just because there are proportionately more people in the WAP who have lower participation rates.
So the LFPR can fall not due to changes in the underlying behaviour but because of shifts in the population age composition.
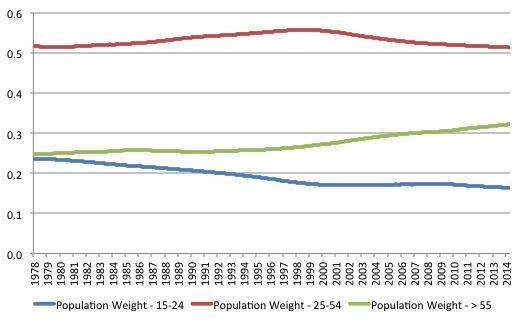
The next graph shows the changing weights of the three groups in the total Working Age Population (WAP) for Australia.
We note that Prime-age demographic (25-54 year olds) peaked as a share of the total WAP in January 1999 and their share has been falling ever since. At that time, the share of older workers (GT55) in the total WAP started to rise steadily as the Prime-age persons moved into that category.
The decline in the Prime-age weight has been less than the rise in the Older workers share because the Prime-age category is experiencing flows at both thresholds - the youth flow in and the older Prime-age workers flow out.

Estimating the effect of ageing on the LFPR
The total LFPR peaked in November 2010 at 65.8 per cent. By May 2014 it was estimated to be 64.6 per cent. The difference given the current WAP is some 228 thousand workers. These workers would have been in the Labour Force if the participation rate had not fallen from its November 2010 peak.
The Treasury claim (which is supported by many commentators) is that a significant proportion of those 228 thousand workers are due to retirement behaviour rather than the poor employment growth.
The Treasury official said:
What has begun to deviate more noticeably from its historical path in recent years is the participation rate among older workers. In the past, rising participation of those people in older age brackets worked to more than offset the effect of an increasing share of older people in the population. That is, while the workforce was ageing, more people were working later into life than was the case in the past. In particular, older women were more likely to participate than was the case for their predecessors. But in recent years this trend increase in the participation of older age groups has slowed, and their participation rates have been flat or even falling a touch.
We can estimate for example, the impact of the shifting demographic composition of the Working Age Population on the Total LFPR from any point in time quite easily.
If we use November 2010 as the demographic benchmark and ask the question: How much of the decline in the total LFPR is due to the ageing of the Working Age Population, then we can calculate the weighted average in the following way.
Instead of using the current weights as in the previous formula:
LFPR(t) = (w1524 x LFPR1524) + (w2554 x LFPR2554) + (wGT55 x LFPRGT55)
We would use so-called fixed weights, where the relevant weights (proportions in the population) are fixed at their November 2010 values. In other words, we are then considering the LFPR behaviour for each group weighted by the share of the WAP as at November 2010. The behaviour of the total weighted average then is not due to the shift in the population shares.
The formula would be (in this case):
LFPR(t)Nov_2010 = (w1524Nov_2010 x LFPR1524) + (w2554Nov_2010 x LFPR2554) + (wGT55Nov_2010 x LFPRGT55)
where the term (for example) w1524Nov_2010 is the share of 15-24 years olds in the WAP as at November 2010.
Then the difference between the two calculations LFPR(t) and LFPR(t)Nov_2010 tells us the change in the participation rate that is due to changes in the age distribution of the Working Age Population since November 2010.
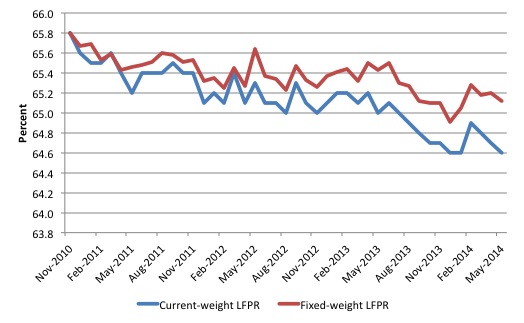
The following graph plots the two times series – the actual LFPR(t) (denoted Current-weight LFPR) and LFPR(t)Nov_2010 (denoted Fixed-weight LFPR).
I seasonally-adjusted the data before I did the calculations and the final result is a little sensitive to the technique I chose (which was standard Census X12 multiplicative).
The results suggest if the age composition of the Working Age Population had have remained at its November 2010 shares then the LFPR at May 2014 would be 65.1 per cent rather than the actual reported LFPR of 64.6 per cent. The November 2010 LFPR was 65.8 per cent.
The actual decline in the LFPR was 1.2 percentage points between November 2010 and May 2014.
We estimate therefore that the shift in the age composition of the working age population accounted for a fall in the LFPR of 0.5 percentage points, which is about 43 per cent of the actual decline.
The remainder is most likely driven by cyclical effects (more analysis is required).
Conclusion
There is some factual basis for the conclusion that the falling participation rate in Australia is an artefact of the ageing population.
There are now more older workers in the WAP and although their participation rate has risen somewhat since the onset of the GFC, the volume effect outweighs the rate effect and the impact on the overal weighted average (the total LFPR) is negative.
It still remains that the dominant factor is most likely to be the lack of employment opportunities in a very flat labour market.
I am still investigating.
That is enough for today!
(c) Copyright 2014 Bill Mitchell. All Rights Reserved.


I will contribute a little human input to this rather technical article.That is not a criticism.
I am retired after 40+ years in the workforce. A lot of that work was physically and mentally demanding. A bit of it involved extreme danger. I am now out of the rat race,at least as far as I can get without pushing up daisies. I have a limited income courtesy of the DVA. I can live within that income.Nothing fancy but not hard either. Because I have managed to save and live frugally I own my residence and have no debt. Others are not so fortunate.
I have no desire or ability to re-enter the workforce. I am sure that there are a lot of Australians of my age or older who feel the same way. Believe it or not,humans wear out.
What amuses me (in a very cynical way) is when the Abbots,Hockeys and their acolytes etc etc ad nauseum urge older Australians to continue in work.Till they drop in harness,apparently. They back up this urging with all sorts of punitive measures aimed at the elderly.
I wonder how many of these magnificent specimens have ever done a hard days physical work in their lives,let alone done it week in,week out for years.
And in spite of rumours to the contrary there are still many jobs which require a lot of physical effort. So this is not something that is confined to that nuisance cohort,the Baby Boomers.
This has been Matt Cowgill’s argument – that the declining participation rate until recently has been almost entirely due to older workers making up a larger percentage of the workforce.
But are they suddenly making up a larger portion of the WAP? (sorry, it’s very early, need more caffiene to fully absorb this article) You would think that there would have needed to have been a sharp slowdown in both the fertility rate and immigration at some point in the past for this to be the case. Or is it simply the case that they have been entering the labour force at a slower rate than the oldies have been leaving because of poor opportunities?