For years, those who want selective access to government spending benefits (like the military-industrial complex…
UK growth not all that it seems
The British Office of National Statistics published the – Gross Domestic Product Preliminary Estimate, Q2 2014 – last Friday (July 25, 2014), which showed that real GDP growth was 0.8 per cent in the second-quarter building on the same result in the first-quarter. It is also the first quarter than the British economy has reached the peak value in March 2008 some 6 years and 1 quarter to get back to square one. On the surface it is a reasonable result but focusing on the headline figure misses some of the salient points that the British government certainly doesn’t want to advertise. The following blog provides some other perspectives some pointing out the deficiencies in just focusing on the headline GDP figure and others looking at other measures. Overall, what growth there is in the UK appears on the surface to being hijacked by high income earners and corporations.
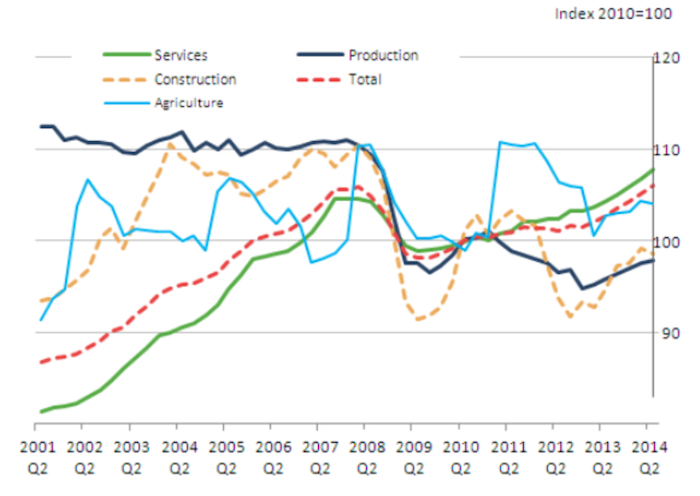
The following graph is a summary GDP Index, produced by the ONS showing the sectoral GDP movements since the first-quarter 2001 to the June-quarter 2014. The base year is 2010 = 100.
The overal real GDP series peaked in March 2008 at 105.8 and in June 2014 it was 106, the first quarter since the crisis that real GDP (the size of the British economy) has returned to the previous peak size.
So 6 years and 1 quarter to get back to square one.
While real GDP rose in Services in the second-quarter 2014 by 1 per cent and in production by 0.4 per cent, it fell in construction by 0.5 per cent and agriculture by 0.2 per cent.
Further examination of the sectors indicates the following:
- Services peaked at 104.6 in March 2008 and is now at 107.7.
- Production peaked at 109.3 in June 2008 and is now still only at 97.9.
- Construction peaked at 110.4 in March 2008 and is now only at 98.6.
- Agriculture peaked at 110.5 in June 2008 and is now at 104.1
So the recovery being driven by the Services sector.
GDP per capita still well below peak
The ONS like all national statistical agencies acknowledges that using GDP as a measure of welfare (well-being) is fraught.
On of the problems is that it needs to be scaled by the population. This ONS publication – Measuring National Well-being: Economic Well-being – published on April 7, 2014 say that “If GDP increases but the population producing it rises by the same percentage, there would be no reason to suppose the well-being of individuals would have increased”.
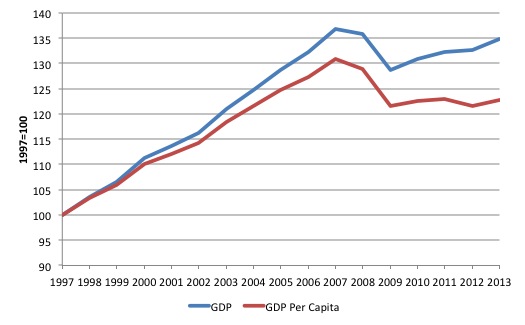
The following graph reports the movement in GDP and GDP per capita for the UK from 1997 to 2013. The growth in the early part of 2014 will not have altered the message much.
It is obvious that while GDP has recovered somewhat, GDP per capita is still well below the peak (some 6 per cent below).
The problem is that “the slow recovery in GDP itself since 2009 had been matched by an increase in population of roughly the same order”.
GDP peaked in 2007 at 136.85 and by the end of 2013 it was at 134.95. As we have seen above, the growth in the first two quarters of 2014 has taken the GDP level to just above the March 2008 peak before the very large collapse.
However, GDP per capita peaked at 128.97 in 2008 and is now at 122.79 in index points.
If GDP per capita continues to grow at its current rate for the next several years then it would pass its 2007 peak in 2020, 13 years of catching up.
But it gets worse than that because the GDP measure includes depreciation – the wearing out of the national productive capital (machines, equipment etc).
In other words, the GDP per capita measure inflates well-being.
If you take the net national product measure (subtracting the depreciation component) then the situation is much worse.
Real Net National Disposable Income (RNNDI) per capita still falling
The ONS publication – Measuring National Well-being: Economic Well-being – reported that:
… unlike the GDP per capita measure which has been broadly flat since 2009, the RNNDI per capita measure has been continuing to fall gently from £21,140 in 2009 to £20,410 at the end of 2013.
ONS says that “Real Net National Disposable Income (RNNDI) results from adjusting NNDI for changes in the price level that income recipients face. RNNDI might be expected to have a close correlation with economic well-being.”
So growth is not improving well-being.
Who is benefiting?
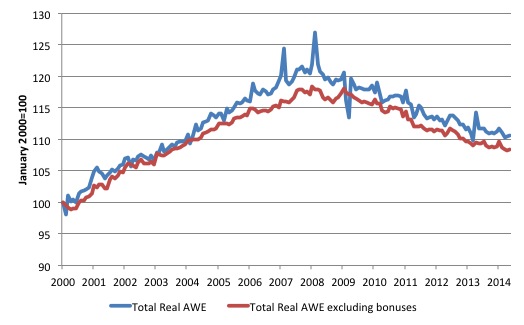
The following two graphs provide some information. The first graph shows real Average Weekly Earnings total (blue) and excluding bonuses (red) from January 2000 to May 2014. The Average Weekly Earnings (AWE) data is seasonally adjusted as is the CPI.
The indexes tell us that in the slow recovery real AWEs have continued to decline. Real AWE (total) are now 12 per cent below their February 2008 peak. Given that productivity growth has been positive (albeit moderate), there has been a substantial redistribution of national income during the crisis to profits.
In the recovery phase, the continued decline in real wages means that the gains are not being captured by average wage earners.
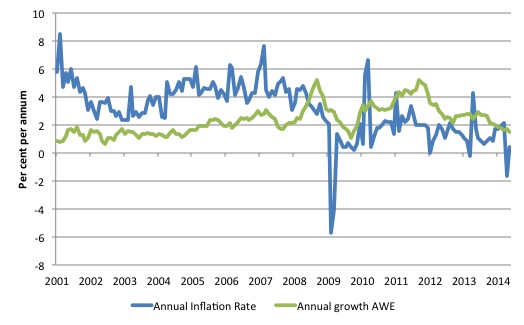
The next graph just presents the information in a different way by showing the annual increase in the CPI inflation rate and total AWE from January 2001 to May 2004.
When the blue line is above the green, real wages are rising and vice versa. The AWE measure shown includes all bonuses.
There is also an increasing use of zero hour contracts, which are typically low pay when there is work available. I am looking into these contracts at present and will write about them when I have more to say. At the moment the blog would be one word – disgusting. That might be an improvement on my daily output anyway!
Fiscal outcomes
A brief note to say that the ONS released the June – Public Finance – data on July 22, 2014.
What we learn is that:
1. Cumulative public sector net borrowing is for fiscal year (UK) 2014/15 is running well above last years figures at a comparable period (by 45 per cent). Net borrowing has risen strongly in the last year compared the previous year, which is the same period that real GDP has resumed growth. No coincidence!
2. “At the end of 2013/14 PSND ex was £1,273.4 billion, an increase of £88.0 billion on the previous year.forecast by £ billion”. So public sector net debt is rising.
3. Central Government net investment remains positive and increased in the June quarter.
4. The central government fiscal balance has fallen slightly over the last year but that has been due to a recovery in revenue as a result of the modest return to growth. The fact is that the current fiscal deficit remains relatively large compared to the history since the late 1990s.
The large deficit helps support growth!
Conclusion
There are many other indicators I could point to which reveal that despite a moderate return to growth, the UK economy has not recovered much as yet and the gains of the modest recovery are not being shared out to the benefit of all workers.
More as I gather information.
That is enough for today!
(c) Copyright 2014 Bill Mitchell. All Rights Reserved.


The UK desperately needs a Job Guarantee not only to halt the decline in real wages, but to eliminate zero hour contracts, internships and involuntary self-employment, and to make some impact on the decline in productivity and business investment.
Neil, you are absolutely right, but a recent piece about Miliband gives no indication that he is even thinking about this sort of innovation. The execrable Stephanie Flanders has said that he has read the first chapter of Piketty’s Capital, but this won’t help him, even should he find the time to read more of it. While the data will show him the bad inequality news, the more theoretical discussion will not lead him in this direction. Add the composition of his team and getting anything useful out of Miliband looks even more intractable.
A version of the Ghostbusters slogan keeps popping up in my mind: Who ya gonna vote for?
Nice to see Aditya Chakrabortty following your lead in the Guardian Bill.
Supine Labour lets the Tories daub lipstick on this pig
Andy, yes but did you take note of the comments that immediately follow the article? Here are the first three. The message isn’t getting through.
Alfresco11
28 July 2014 8:36pm
Austerity was absolutely essential – that’s why the economy is now booming.
You’ve got to balance the books – even a child can see that
Patrician Alfresco11
28 July 2014 8:46pm
You do, but borrowing for Peter to pay Paul, or creating a Ponzi scheme isn’t the best way to go about it.
43bikeguy Alfresco11
28 July 2014 8:47pm
It’s not about whether to follow austerity it’s how. Anyway Osborne isn’t reducing the deficit and he is a one trick pony. Cut taxes for the rich and destroy public services. We the public have taken this country back from the brink.