For years, those who want selective access to government spending benefits (like the military-industrial complex…
UK labour market continues to impoverish its workers
While a lot of focus is given to the necessary reform of the financial sector – like declaring all financial transactions that do not support the real economy (which is about 97 per cent of the total) illegal, there is also a need to make fundamental changes to the labour market to reverse the neo-liberal incursions that have casualised employment and systematically cut real wages. The labour market degradation over the last 2-3 decades have allowed for the massive redistribution of real national income in most nations away from workers towards profits. That redistributed surplus is, in part, the bounty that the financial markets have used to speculate with and further entrench their power as financial capital. It also is how the top 1 per cent (and the 0.01 per cent) of the income and wealth distributions have gained further at the expense of the rest. Yesterday (November 19, 2014), the British Office of National Statistics released two publications – Annual Survey of Hours and Earnings, 2014 and – Low Pay, 2014 – both of which demonstrated how these trends are alive and well in the British labour market. The British trends are representative.
I don’t have much time today as I have a long flight ahead but the following points are interesting.
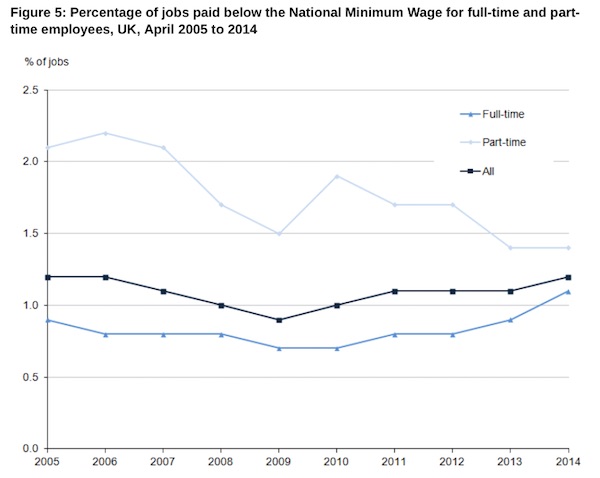
First, the Low Pay, April 2014 data shows that 0.9 per cent of all employees in the UK were paid below the National Minimum Wage (NMW) – this amounted to 236,000 jobs.
The vast majority of these jobs were held by employees who were over 21 years of age.
The number of people not even receiving the legal minimum wage has risen over the last year.
The following graph (Figure 5 from the publication) shows the trends since 2005. Under the current Conservative government (elected in 2010) the trend has been upward, especially for full-time workers.
The ONS colour the rising trend by claiming that:
Over this period the proportion of full-time employees with pay below the NMW has also remained fairly stable, at around 0.8%, with a slight increase in the last two years, to 1.1% in 2014.
Understatement.
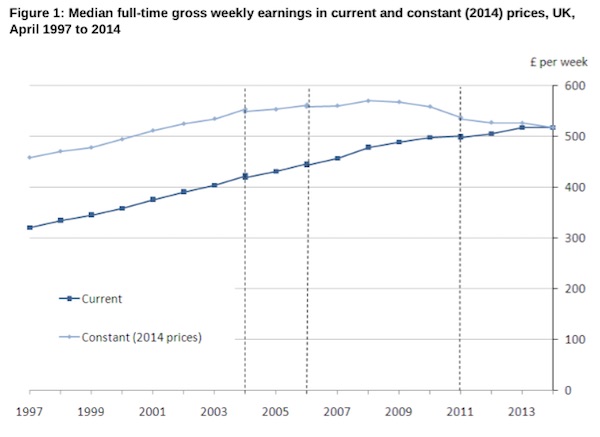
Second, the other document released as part of the Annual Survey of Hours and Earnings, tells us that real wages in the United Kingdom have continued to decline for the 6th successive year.
The ONS say that:
In April 2014 median gross weekly earnings for full-time employees were £518, up 0.1% from £517 in 2013. This is the smallest annual growth since 1997, the first year for which ASHE data are available …
Adjusted for inflation, weekly earnings decreased by 1.6% compared to 2013. The largest decrease was between 2010 and 2011, but inflation-adjusted earnings have continued to decrease every year since 2008, to levels last seen in the early 2000s.
The following graph captures this trend. The lighter blue line is the real wage in 2014 prices whereas the darker line is the nominal or money wage (not adjusted for inflation).
Workers are thus facing systematic cuts in their purchasing power and are faced with either accepting the lower material standard of living, running down their savings to maintain real living standards, borrowing more or selling off assets.
A large number of workers eroded their savings during the crisis and are not asset-rich. So living standards are falling.
Third, the data on hours worked shows that:
Over the long-term, the average number of hours worked per week for full-time employees has decreased from 40.0 in 1997 to 39.2 in 2014. This decrease is particularly notable for men, while women’s hours have remained stable at around 37.5. For men, there was a sharp dip between 2008 and 2009, and hours worked have not returned to the levels seen prior to the economic downturn. Examining the components of hours worked, there is a long-term decrease in overtime, particularly for men.
In other words, even though there has been a fall in unemployment, the degree of labour market underutilisation has not fallen significantly.
The slack is being expressed in the rise in underemployment and the number of workers that have sought incomes via self-employment. The ONS Survey does not tell us anything about the self-employed, which have been rising dramatically since the Conservative government took over in May 2010.
Related data shows that more than 66 per cent of the rise in employment since 2008 is accounted for by the self-employed. Many of these workers are receiving very low incomes if any income. I will be analysing the self-employment problem separately later.
It tells us that the British economy is a long way from recovery.
Fourth, related ONS data on – gross flows, which I will examine in more detail next week are interesting.
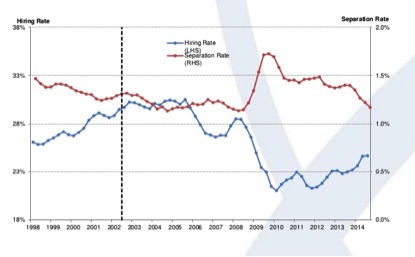
The data shows that the hiring rate (new jobs being created) has barely risen above the trough in 2010 but that the separation rate (workers leaving their jobs and entering unemployment) his now back to the 2008 levels (more or less).
The following graph is provided by the ONS presentation linked above. It show the hiring rate on the left-hand axis and the separation rate on the right-axis.
What does this mean?
Simply, that the falls in unemployment in recent years in Britain are due to the slowdown in workers exiting jobs and entering the unemployment pool, rather than a rapid rise in the rate at which firms recruit unemployed workers from the jobless pool.
That is not a sign of a healthy economy.
The data also examined gender differences (the gap is decreasing but that is due to male earnings being suppressed) and inequality in the earnings distribution is largely unchanged.
I will examine those trends separately when I get more time.
Conclusion
I considered the British real wage trends in more detail in this recent blog – The UK recovery is a false dawn.
The bottom line is that there will be no sustained recovery and return to stability until real wages are allowed to grow in line with labour productivity growth.
This will require government action, the first step being to restore true full employment. A strong labour market makes it hard for employers to resist legitimate wage demands.
Money wages have to grow not only in line with the inflation rate but also in line with the productivity growth rate.
At present, economies are achieving growth with a mix of mini-jobs (Germany), zero hour contracts and fractionalised work (UK), part-time, precarious jobs (just about everywhere) and these labour market developments might suit capital but they undermine the capacity of workers to enjoy real wages growth.
Forcing employers to search for labour in a tight labour market is one of the essential criteria for recovery. That will require a substantial increase in the fiscal deficit in the UK and a concerted increase in public sector employment creation. The private sector has to be pressured to provide better paying and less precarious jobs.
If governments do not take on this task, then the trends that were apparent before the GFC will continue and strengthen and the crisis will repeat itself.
That has to be it today. I will resurface in the cold north sometime tomorrow.
That is enough for today!
(c) Copyright 2014 William Mitchell. All Rights Reserved.
There is a symbiotic relationship between the uk and euroland.(its primary hinterland)
Any increase in UK fiscal spending will simply drag in further euro land mercantile goods and labour.
We would see a continued decline in the basic energy per person.
From a social credit perspective this is a crisis of capitalistic concentration.
Euroland is the region near the event horizon and the UK is the black hole.
Therefore Bills Keynesian drive toward further concentration will simply feed the monster.
His capitalistic growth programme will further erode the purchasing power of the mean UK resident.
Growth is extractive.
“The bottom line is that there will be no sustained recovery and return to stability until real wages are allowed to grow in line with labour productivity growth.”
There’s not a lot of productivity growth in the UK economy at the moment either.
Bill’s opening sentence advocates “declaring all financial transactions that do not support the real economy (which is about 97 per cent of the total) illegal…”. Trying to distinguish between transactions that support the real economy and those that don’t would be a quagmire – apart from some obviously illegal stuff, like robo-signing.
A better distinction to make is between money creation and transfer which is ESSENTIAL for any economy to function, and COMMERCIAL stuff (legal or semi-legal). Under full reserve banking you can put your money into the totally safe half, or take your chances in the commercial half. But if the latter fails, you take a hit, not the taxpayer – just like if you buy shares and they fall in value, you take a hit, not the taxpayer.
The problem with the existing system is that our money supply is issued largely by private banks, and that appears as a liability on private bank balance sheets, while on the asset side, are various assets ranging from responsible loans to semi-criminal NINJA mortgages etc. And when that collapses, the money supply partly or wholly disappears – unless taxpayers come to the rescue.
The British parliament, for the first time in 170 years, is debating money creation today.
Could one not massively reduce “financial transactions that do not support the real economy” by introducing something like a Tobin Tax (domestically too, not just on cross-border transactions)?
Ralph:
I would argue that there is no need to experience a quagmire when sorting out the financial transactions / instruments etc. that do no support the real economy.
The regulations should explicitly state what banks / financial institutions can do. For example, banks can only take commercial deposits and extend loans.
As I see it, there is no intrinsic reason to frame it the other way round, stating what they can’t do.
Activity that falls outside of the bank’s explicit mandate is unambiguously illegal.
Net inward migration into the UK was +243,000 per year ending march 2014.
The problem obviously orbits the increased scale of banking operations inside and outside the EU market state.
According to the trading economics website Ireland experienced a+100,000 in net migration in Y2010 .
This during the greatest depression in Ireland since the 1820s
This would be something of the order of one and a half million net inward migration per year into the UK…………
How much can data like this scream before touchy feely liberals sense the complete and utter two faced bollox of their position.
This contrasts with the depression movement of Irish people(chiefly to London) during the 80s depression.
Net migration in Ireland peaked in Y1990 at MINUS 150,000…………
Again net migration data says it all.
Time to scale down bank scarcity engines ?
Again despite what bills says the eurozone is showing all the signs of engaging in a full scale (consumer) war economy.
From a economic rather then social perspective there is little difference between ww1&2 soldiers flooding into dear old England and today’s present consumer roboten.
So today they arrive in a Airbus 320 rather then the Memphis Belle.
My question is what is the eessential difference between this banking concentration experiment and the last.
Obviously we are seeing rationing of basic consumption again but who benefits?
The King Goshamks of course,