It was only a matter of time I suppose but the IMF is now focusing…
Alleged Greek growth could be an illusion
It seems that Greece is still in trouble with the Athens Stock Exchange share prices tumbling rather abruptly in recent weeks. In the last 6 days or so the Athens Stock Exchange Composite Index has plunged by around 19 per cent on the back of growing political tension and the strong likelihood that the pro-austerity, Troika surrender monkeys in power at present will be tossed out and a new dialogue with Europe will begin. The snap election call has spooked the markets it seems. But I have also been puzzling about (read: been deeply suspicious of) the growth narrative that is being peddled about Greece by the European Commission and the IMF. There remain unsolved puzzles about the third-quarter 2014 Greek national accounts data, which is another way of saying they don’t quite add up. It may be that the alleged real GDP growth of 0.7 per cent was a statistical artifact – the case of incomes falling less slowly than prices. The evidence certainly suggests that is the case. That is what this blog is about.
0n September 19, 2007, when the Athens Stock Exchange Composite Index peaked at 5118.51 points. As the crisis set in, the Index plunged to a low of 476.36 on June 5, 2012, a decline of 91 per cent. A lot of wealth wiped out in that decline.
The Index then recovered a little reaching the next peak of 1035.08 on December 9, 2014. Six days later it is back down to 836.41, a decline of 19.2 per cent – that is, a major collapse.
Here is a graph of the Index since May 18, 2005. The inset is the movement in the Index from November 3, 2014 to December 15, 2014. You can access the data from – Euroinvestor.
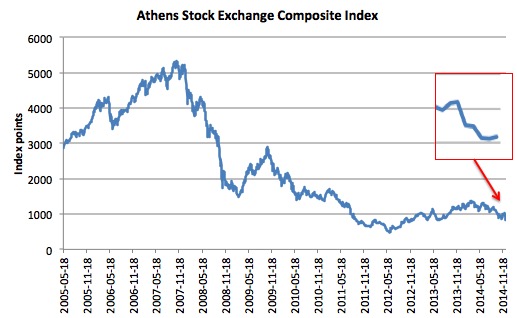
The reasons advanced for the crash include the suddent decision on December 8, 2014 by the Greek Prime Minister to call a national election to ratify further austerity cuts demanded by the Troika as part of the bailout loan process.
We will see how the election unfolds. I am hoping the anti-austerity forces win power and force Germany and other nations to kick Greece out of the Eurozone. Then we would see Greece return to prosperity as long as it simultaneously jettisoned its neo-liberal policy slant.
But now to the puzzle about the national accounts.
When Eurostat announced the third-quarter – National Accounts – estimates for the Eurozone on December 5, 2014, we saw that Greece had grown in volume terms (that is, real terms) by 0.7 per cent for the quarter. The data claimed that over the last year the Greek economy had grown in real terms by 1.6 per cent. Both estimates were seasonally adjusted, which is not the issue here.
The volume estimates are provided by way of so-called chain-linked time series, which I will explain soon.
If you go to the Greek government national statistics office, the – Hellenic Statistical Authority – or EL.STAT to get access to the raw data that is fed to Eurostat, then you find out some additional facts about these third-quarter 2014 estimates.
First, the EL.STAT data confirms the volume estimates.
Second, the EL.STAT data reports that current-price GDP (which I will explain soon) grew by 1 per cent in the third-quarter 2014 but fell by 0.59 per cent in the year leading up to the third-quarter 2014.
To be consistent, that means that the inflation rate in the third-quarter should be 0.3 per cent and over the year to September 2014 it should have been -2.2 per cent (that is, deflation). I will explain soon.
Third, the Consumer Price Index for Greece published by EL.STAT tells us that the quarterly inflation rate in the third-quarter was -1.21 per cent and over the year to September-quarter 2014 -0.6 per cent.
Consulting the GDP deflators (an alternative measure of inflation – I will explain soon) we see that the deflation rate was -2.30 in 2013. The more recent data is not yet available.
On both measures, one derived from a survey (CPI) and the other derived from the National Accounting procedure, there appears to be sharp deflation continuing in Greece since around 2012. The CPI measure tells us that deflation continued at a pace throughout 2014 including the third-quarter 2014.
Conclusion: the real growth narrative doesn’t square with the data.
Why is this important?
In National Accounting parlance (be prepared to be bored) there are a number of concepts that are interlinked in an accounting sense. To learn more you might consult the document – 5216.0 – Australian System of National Accounts: Concepts, Sources and Methods – which is consistent with international standards that apply throughout the world.
Three concepts are worth understanding (among others):
1. Nominal or current-price Gross Domestic Product (GDP).
2. Volume measures of GDP.
3. The implicit GDP deflator.
Nominal or current-price Gross Domestic Product (GDP) is defined as the:
GDP derives from the concept of value added. Gross value added is the difference between output and intermediate consumption. GDP is the sum of gross value added of all resident producer units plus taxes on products less subsidies on products. This derivation is referred to as GDP measured by the Production Approach (GDP(P)).
GDP(P) = Output – Intermediate Use + Taxes on Products – Subsidies on Products
GDP is also equal to the sum of the final uses of goods and services (all uses except intermediate consumption) measured at purchasers’ prices, less the value of imports of goods and services. This derivation is referred to as GDP measured by the Expenditure Approach (GDP(E)).
GDP(E) = Final Consumption Expenditure by Households (C) and Government (G) + Gross Capital Formation + Exports of goods and services (X) – Imports of goods and services (M)
Finally, GDP is also equal to the sum of primary incomes distributed by resident producer units. This derivation is referred to as GDP measured by the Income Approach (GDP(I)).
GDP(I) = Compensation of Employees (COE) + Gross Operating Surplus (GOS) + Gross Mixed Income (GMI) + (Taxes on Production and Imports – Subsidies on Production and Imports (NT))
There are thus various ways to compute the same outcome – the so-called production approach, income approach and the expenditure approach. They all focus on a particular aspect of economic activity in a period but essentially arrive at the same number. You should read the document above if you are keen to dig further.
So it is a measure of all the goods and services produced in some year valued at the prices they sell at and aggregated into a single monetary measure of overall economic activity.
Depending on one’s purpose, the measure is flawed because it only includes ‘production’ that is sold in the market place. The classic example of the problem is when one works within their own home(providing child care services, cooking, cleaning, maintenance etc) relative to when one hires someone to perform exactly the same tasks. The former will not be counted while the latter will.
The other problem is that it doesn’t discriminate between goods and services offered. So a nation’s economy could be growing at 3 per cent a year by building weapons of mass destruction while the vast majority of the population is starving and be compared favourably with another nation growing at the same pace but doing so by providing public education, hospitals and mass transport systems with zero poverty.
Others criticise the measure for excluding things like environmental well-being, which may be significantly reduced by production but not counted against that production. Broadening further the GDP measure does not take in to account happiness or spiritual concepts so may be a highly misleading indicator of progress.
For our purposes here, note that the valuation technique above generates the current-price measure of GDP by using the prices of goods and services that prevail in each period. Hence the current-price term. Economists use the term nominal to indicate the same concept.
The ABS note that:
In the Australian economy, millions of economic transactions take place every day involving the production and sale of goods and services (products). The monetary value of each of these transactions is a product of the quantity produced or sold and the unit price. In a particular period, the total value of all transactions taking place in an economy is simply the sum of the individual transaction values in that period. This is referred to as the current price value.
Further, we learn that:
Each of these transactions has two components: a price and a quantity. From one period to another the quantities and prices comprising the transactions change. This means that when the current price value of an aggregate, such as GDP, in one period is compared with the current price value in another period, the difference between them usually reflects both changes in quantity and changes in price of the constituent transactions. In order to estimate by how much the ‘volume’ of GDP has changed between the two periods we need to measure the value of GDP in each period using the same unit prices.
The ABS document also conclude that:
It is desirable to measure the aggregates in volume terms so that the price effect is eliminated and thereby obtain a real change from one period to another. However, some aggregates, such as income, are not able to be measured in volume terms as they cannot be broken down into a quantity and a price component.
In other words, let’s say that current-price GDP increases over a year by 3 per cent, but over that same period prices have risen by 3 per cent.
So total production was say $100 and grew to $103 but all the change would in this case be due to the rise in the price level – that is, a pure valuation effect. The total real quantity of goods and services produced would not have changed, just their monetary value due to inflation.
The ABS use the following example:
In period 1, 20 kilos of beef are sold at $1.00 per kilo for a value of $20.00 and 10 kilos of chicken are sold at $2.00 per kilo for a value of $20.00. Total sales of meat are valued at $40.00.
In period 2, 18 kilos of beef are sold at $1.10 per kilo for a value of $19.80 and 12 kilos of chicken are sold at $2.00 per kilo for a value of $24.00. Total sales of meat are valued at $43.80.
… Total sales of meat have increased from $40.00 in period 1 to $43.80 in period 2, but what is the growth in volume terms? One way of answering this question is to hold prices constant in the two periods, at say period 1 prices. The total value of sales in period 2 at period 1 prices is $42.00 (18 kilos of beef @ $1.00 plus 12 kilos of chicken @ $2.00). At period 1 prices, the total value of meat sales has increased from $40.00 to $42.00, which is an increase of 5%.
There are other ways of deriving the constant-price or volume estimates. Please see the document if you are interested. Historically, real or volume based measures have been obtained ” by holding prices constant in a particular base year”.
But that method also gives problems, which are explained in this simple to read – Chain volume or ‘real’ GDP.
The problem is that as time passes “price relativities change and when estimating volume growth from one period to another it is best to use prices at or about the current period”. In other words, the base year becomes a poor reflection of what is being produced and the relative prices of the goods and services being produced now.
The solution, adopted by all nations, in the late 1990s, was to use so-called “Chain volume measures” to estimate real GDP.
The method used to calculate this chain-linked measures is relatively straightforward and are derived from the previous constant-price method which uses the base year price to compute the real or volume change in the subsequent period.
The major difference or innovation is that the chain-linked measures use the prices from the immediate past period to measure the change in the next period. So the base year constant price is continuously updated. Each successive year set of prices becomes the base year for the next year – hence the ‘chain-linking’ terminology. It is a little more complicated than this but essentially this is what happens.
So for our purposes, real GDP (or chain volume measures) purge the impact of current price changes (from the last period) and tell us how much real production has increased in the period under scrutiny.
So we might think that real GDP plus the inflation rate (however measured) should be equal (more or less) to nominal or current-price GDP, if the accounting structures are sound.
The final part of the story then is to understand deflators. The ABS compute various measures of price change. Within the national accounts structure, one measure is the so-called implicit price deflator or GDP deflator, which is:
… a measure of the level of prices of all new, domestically produced, final goods and services in an economy.
The GDP deflator is equal to the Nominal GDP/Real GDP multiplied by 100 (to express it in percentage terms).
This builds on our understanding that the difference between the Nominal or Current-Price GDP and real or volume-based GDP is the change in prices in the current period.
The GDP deflator is different to the Consumer Price Index (CPI) because the latter is based on a fixed basket of goods. Please read my blog – Chained-CPI COLAs – another conservative smokescreen – for more discussion on this point.
Further, the methods used to derive them are different.
But they both provide indicators of the percentage change in prices over a given period.
So how does this relate to the Greek national accounts data?
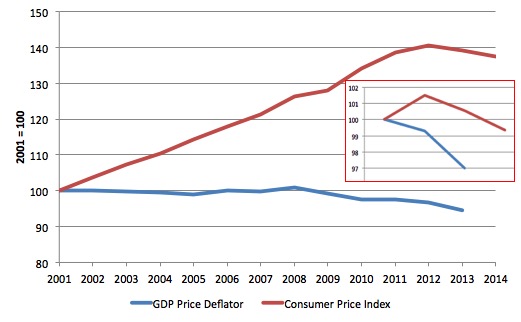
For Greece, the GDP deflator and the CPI have behaved in the following manner since 2001. The red line is the CPI measure, which is less comprehensive than the blue line, which is the GDP deflator.
The insert is the behaviour of the series since 2011. There is thus deflation being signalled by both indices (negative inflation rates).
The issue
If the current Greek inflation rate for the third-quarter 2014 as indicated by the CPI measure is -1.21 and real GDP was measured at 0.7 then we have the following sum available which will approximately give us nominal or current-price GDP in percentage growth terms:
% growth in Nominal (current-price) GDP = % growth in real GDP plus the % inflation rate
Putting the numbers we know into the equation we get:
% growth in Nominal (current-price) GDP = 0.7 + (-1.21) = 0.7 – 1.21 = -0.51 per cent.
In other words, Greece’s nominal GDP didn’t grow at all in the third-quarter 2014 – it went backwards again.
How does that square with EL.STAT measures that are used by Eurostat who claim current-price GDP increased by 1 per cent in the September-quarter?
Given the inflation measures are all pointing to deflation, I suspect the national account numbers.
For the year to September-quarter, EL.STAT estimated that real GDP grew by 1.6 per cent and nominal GDP fell by 0.59 per cent as noted above. The rate of deflation was -0.60 per cent.
Using our accouting formula and the CPI inflation rate we would get:
% growth in Nominal (current-price) GDP over the year to September = 1.6 + (-0.6) = 1 per cent.
Which is a long way of -0.59 per cent, but sharing the bias toward overestimated nominal growth.
What does this mean?
It means that if nominal GDP growth was negative in the third-quarter 2014 despite claims otherwise, then the real GDP increase may not be an increase at all.
What?
One could get the same result by noting that if the current-price GDP falls more slowly than the rate of deflation (which appears to be the case in Greece for the third-quarter 2014), real GDP will be estimated to have risen.
Noting again:
Real GDP = Nominal GDP/Inflation Rate
So it can rise if the numerator (Nominal GDP) is falling but more slowly than the denominator (the Inflation rate).
You cannot get a real GDP growth rate of 0.7 per cent and a nominal GDP growth rate of 1 per cent if there is deflation over the same period! Impossible.
This analysis suggests that the much heralded return to growth in Greece may be a statistical chimera. Incomes are still falling by prices are falling faster.
Certainly the consistent message coming from the inflation measures (whichever one you care to use) is that deflation is well established.
Conclusion
Tomorrow I will consider arguments that think that dropping money into the economy to buy real things such as “herds of Texas Longhorn cattle” are not fiscal operations and any growth that emerges from such activities signify that differences in fiscal policies are not responsible for differences between say the US growth recovery and the Eurozone malaise.
Finally – Where the hell is the Ukraine?
It appears that the Ukraine (you know that place we thought was near Russia) could be in Australia (the arid centre) but also could be in Africa, South America or a number of other places including Alaska somewhere.
WTF?
The Washington Post article () – The less Americans know about Ukraine’s location, the more they want U.S. to intervene – recounts some research that some US academics have done in the US to gauge geograpical awareness among Americans and how strongly they feel about foreign policy choices against how good their geography is.
The results are amazing.
The following map from the article records where the “Survey respondents identified Ukraine” as being located. 16 per cent were correct (within its borders). The “median respondent was about 1,800 miles off – roughly the distance from Chicago to Los Angeles – locating Ukraine somewhere in an area bordered by Portugal on the west, Sudan on the south, Kazakhstan on the east, and Finland on the north”.
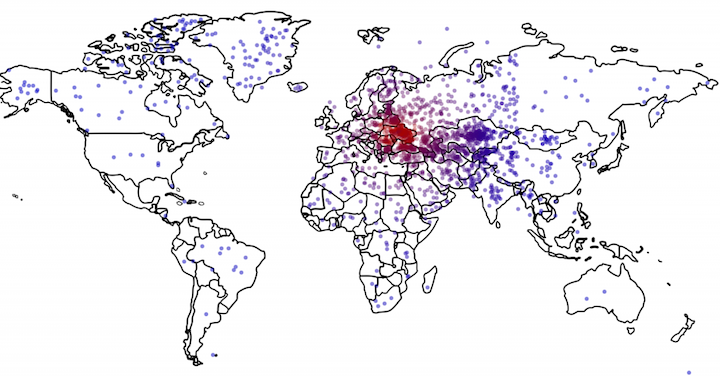
The researchers then computed the inaccuracy in distance terms and used that measure in statistical analysis to relate it to answers to the “questions about what they thought about the current situation on the ground, and what they wanted the United States to do”.
The conclusion was that the:
… the further our respondents thought that Ukraine was from its actual location, the more they wanted the U.S. to intervene militarily.
Phew! Some basic failure in the public education system going on there.
That is enough for today!
(c) Copyright 2014 William Mitchell. All Rights Reserved.
“Some basic failure in the public education system going on there”
What makes you think that “there” as in the USA is much different to what happens here in Australia ?
Rather typical off with the pixies attitude. Next thing you will be telling us that the Martin Place lunatic had nothing to do with the Islamic mindset.
Oh,sorry,you have already done that.
Pordagus – just because he did something that in his mind was in the name of Islam doesn’t make it a terrorist act. This guy was clearly unhinged in a very different way to your standard religious zealot.
Thanks Bill
That was a good exercise to follow you through the GDP mechanic.
I guess the moral is never trustgreeks bearing Eurostat GDP data 😉
Here is what the guardian says about the left Syriza government:
http://www.bbc.com/news/world-europe-30481307
Im sure there will be plenty of conservatives riling about their prescious ‘market’. For ordinary greeks it has long been disjoint from bringing them any share of prosperity, growth, employment or stability anyway.
Think about Breivik, just because he did something that in his mind was in the name of extreme right-wing ideology doesn’t make it a terrorist act. This guy was clearly unhinged in a very different way to your standard fascist zealot.
Regarding Ukraine the Americans and the Saudis have intervened economically in the way which led to capital flight in Russia. The Russians lost the plot trying to stem the outflow of hard currency and imposed sanctions (austerity) on their own economy, jacking up the interest rate to 17%
Also:
“On Monday, business daily Vedomosti reported citing its sources that in 2015 the government will cut budget spending by 10%.” source TASS, “Russia to cut aircraft industry spending by 2% in 2016-2017”
The Russians may have managed to sent camouflaged troops and mercenaries to Ukraine (they know where it is) but their economic ignorance is assuring. It appears that again There Is No Alternative to the US (except for China).
The education system in America seems to consist of a huge dose of Fox News. I had a guy tell me one time that he was upset about all of the Mexicans coming in here (NC) from overseas. I can’t agree more. I am sorry about offending any Fox viewers.
A well known comedian in Canada once said ” If the Americans ever decide to attack us, all we have to do is take our name off the map and they’ll never find us”.
The lack of geographic and other knowledge key to critical thinking about economic and geopolitical issues is truly astounding. That said, daily encounters prove the general populations elsewhere, though a bit more aware of geography, are little better equipped to understand those issues either. The propaganda being circulated around the globe makes us question our understanding of even basic truths.
How can teachers compete with mass media?
Quite frankly, Bill, I don’t get your point. We measure nominal GDP growth, we measure the inflation rate and then we calculate real GDP growth, right? So if El.Stat measures that nominal GDP grew by 1 per cent in the third-quarter 2014 and that the quarterly inflation rate in this period was -1.21 (=deflation) per cent, then we should get a growth in real GDP of 2,21 per cent (2,21 + (-1,21) = 1). But this would mean that real GDP growth is underestimated, but not overestimated: It’s 2,21 per cent instead the officially given 0,7 percent!
Best wishes – Catharina
Both the economy growing in England and Greek are equal illusions. In England income tax receipts are not growing with more employment, because the jobs are too low waged, so the benefit bill goes up for the even more working poor, who are now the bulk of the poor going to food banks.
The centre of Athens is as much a ghost town as most English town centres, with empty shops that remain closed down for years.
In England, the high street could be full of even more shoppers, if the UK government had paid out the state pension at 60 from last year, that denied 7 years payout to a couple, from the ring fenced and full National Insurance Fund holding £30 billion of denied state pension, being called wrongly a surplus, that has not needed a top up from tax for decades.
Paying out money to basic earners is far better for local community businesses, than even more money for those already rich who just hoard the money.
England faces a future with totally penniless pensioners of women born from 1953 and men born from 1951 who face NIL STATE PENSION FOR LIFE, that for so many is sole food and fuel money in old age.
https://you.38degrees.org.uk/petitions/state-pension-at-60-now
I bet many of my fellow Canucks could not identify Ecuador on a globe!!! (Ukraine they might have less trouble with, given how many Ukrainian Canadians there are.)
Quick, name 15 Mexican states!
It seems to be a good year for tourist activity.
Looking at the IEA s jet kerosene data it points to higher activity then at any time since 2011.
Of course exporting goods or importing tourists while the country is in a war economy / rationing results in a further decline in the standard of living but a increase in GDP.
This seems to be a general theme of most euro periphery countries in 2014 with Ireland no exception as it exported more of its wealth in return for token carrying tourists in 2014.
The current monetary system is designed so that people find it impossible to return to village life and thus therefore do something constructive.
Bill, I wonder if you would want to comment on some of the claims made in this paper?
“Perfect storm – Energy, finance and the end of growth” by Dr Tim Morgan, Global Head of Research, Tullet Prebon.
http://ftalphaville.ft.com/files/2013/01/Perfect-Storm-LR.pdf
I understand from other sources that Dr Tim Morgan is no longer at Tullet Prebon. I am not implying it is related to this paper. Also, aspects of his views come through which lead one to be concerned that he is somewhat neoliberal. However, put that aside. Also, put aside at least for this topichis claims about limits to growth .
What I really want to point to are his claims that official modern economic data are badly skewed. In particular he makes claims that inflation data and growth data are unreliable due to new techniqus. He holds that (at least for the USA) true inflation is undermeasured in particular because of hedonic techniques and that GDP is over-measured because of imputation techniques. He holds that the data indicates that the USA economy has not grown at all since about 2000 if these fallacious effects are removed.
I must admit that I am extremely suspicious of Australia’s low measured inflation for similar and other reasons. I think for example our inflation basket is dishonestly and politically manipulated and often has not enough relation to what those on median income and below actually purchase.
Adam K, was Breivik part of an organised terror group? Did a whole bunch of people coordinate that horrendous situation?
By your definition, school shootings in the US by disgruntled students are also acts of terrorism.
Sorry @TB from the top i got bored quickly and finished up reversed at 19,round,bi,plunged,composed,dazed,last,weak,recent,in,abrupt,tumbling,sharing,exchanged,stocked,athletic,troubled,still,greased.
Thanks Bill U-crane
Dear Catharina Schuster (at 2014/12/18 at 0:58)
I am glad someone raised that point. Obviously you can do the sums the other ways around starting with Nominal GDP then subtracting inflation to get the volume estimate, as you did.
I didn’t do that because a quarterly growth rate for Greece of 2.21 per cent is preposterous given the dynamics of the labour market over the same period and the fact that deflation is accelerating.
If Greece was really growing that strongly in volume terms, then there would be nothing for the share markets to be worried about really.
But thanks for completing the circle.
best wishes
bill