It's Wednesday, and as usual I scout around various issues that I have been thinking…
Inequality and growth and well-being – revolutions have occurred for less
Canberra is Australia’s capital city – a created city located in the Australian Capital Territory (ACT) to house the federal government and its bureaucracy. Official – data – shows that in 2013, the ACT has the highest household incomes of any state/territory, the highest household net average net worth and is heavily dependent on its wage and salary income. It is now a focus of federal government employment cuts which are forcing thousands of workers onto the unemployment queue, with little prospect of alternative employment at this stage given the general state of the economy. Over the weekend, I saw a news segment which documented the increased access of Canberrans for emergency food relief over the last 12 months. More than 10 per cent of the population in one of the highest income per capita cities in the world are below the poverty line. How can that be?
The Australian Senate commissioned an inquiry via the Community Affairs References Committee on the – Extent of income inequality in Australia. The final report – Bridging our growing divide: inequality in Australia (3 mb) – was tabled in Parliament on December 3, 2014.
Overseas readers should note that the Australian parliament comprises two houses: the lower House of Representatives (elected by popular vote across electorates with the majority party(ies) forming the government and the upper house or Senate, which was designed to safeguard the States’ interests once they agreed to federate. The Senate is comprised of members from each state, popularly elected according to per capita quotas.
The upper house, which conducted this inquiry is currently not controlled by members of the governing conservative coalition which dominates the lower house and is implementing harsh austerity measures consistent with their neo-liberal leanings and favouritism towards the top-end-of-town.
In the Final Report, we learn that:
- “Income inequality … has increased in Australia since the mid-1980s” as has wealth inequality.
- Gini coefficients (closer to zero indicates increased equality) show that in the early 1980s, Australia recorded values around 0.27 to the current state of around 0.32.
- The ABS data for 2011-12 (latest) shows that the mean household net worth was $728,000 while the median was $434,000, which tells you how skewed the distribution is. A “relatively small number of households had high net worth and a relatively large number had low net worth”.
- Of the 33 OECD nations, “only eight … had a higher Gini coefficient than Australia – Chile, Mexico, Italy, Turkey, Israel, Portugal, the United States and the United Kingdom”.
- “In terms of relative income poverty, in 2000, 12.2 per cent of the Australian population population had an income that was less than 50 per cent of national median income”. By 2012, this figure had risen to 13.8 per cent and despite Australia being one of the highest income per capita nations in the OECD bloc, our poverty rate is significantly higher than the OECD average.
Our capital, Canberra with the so-called highest standard of living in Australia and with “one of the highest standards of living in the world” (Source)
now has at least 10 per cent of its households living in poverty due to unemployment and low incomes.
As an aside and in relation to the suppression of wages growth in Australia over the last several years, I did an interview on Thursday with Fairfax economics editor Peter Martin, which was published on Saturday (December 20, 2014) – Economy a victim of the war on wages?.
It is worth reading and reveals the hypocrisy (and dimwittedness) of the Australian national government.
The rising inequality in Australia is replicated in Canberra as the increasing proportion of low income households have to contend with local prices driven up by the coincident location of very high-income households.
The TV segment was reporting the rising homelessness in our National Capital and the increasing food poverty – the emphasis was on what will happen on Xmas day but it beggars belief that in a national as wealthy (overall) as Australia anyone should be poor in terms of food and housing.
The fact that our most well-off city is now replicating what is going on in other cities is testament to the pervasiveness of the neo-liberal inroads, that have resumed with vigor after being temporarily interrupted by the Global Financial Crisis.
It is as if the neo-liberals systems of redistribution are getting back to normal with the added accelerator of fiscal austerity on top.
There was an interesting academic research effort recently published and summarised on the Voxeu site (November 29, 2014) – Inequality is bad for income growth of the poor (but not for that of the rich) – which helps to explain why the neo-liberal system survives despite its obvious failure to satisfy the needs of the majority.
The research work investigates the “impact of inequality on growth for different groups across the income distribution”.
The conclusion – is no surprise although it has been denied by mainstream economists for years – “Inequality toward the lower end of the distribution hinders growth for the poor, but not for the rich”.
Please read my recent blog – Trickle down economics – the evidence is damning – for more discussion on this point.
They motivate their study empirically by examining how US “state-level inequality among the poor and the rich in a given year affect the state-wide growth rates of disposable income of the poor, middle class and the rich”.
They use official data from the US Census Bureau for the period 1960-2000, which was a period of “substantial transformation of America’s economy and society”.
They identify two very important economic development periods within that overall sample with:
US per capita growth rate decelerated significantly, and growth moved from being pro-poor (with growth rates higher among the poor than among the rich) to being pro-rich (the reverse).
The findings are summarised by this graph (their Figure 1), which shows the real income growth rates in the US states at different points of the income distribution. They are decennial averages.
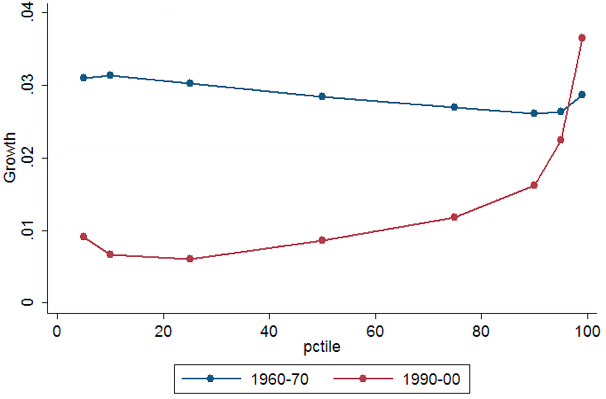
The blue line (1960-70) demonstrates that “pro-poor” period where the growth in real income was higher for all groups except the richest 1 per cent of the income distribution. But the lower income groups enjoyed the greatest benefit and inequality fell overall.
They also found that when inequality rises, there is:
… a strong negative effect on the growth rate of the poor and an almost equally strong positive effect on the growth rate of the rich …
The red line shows that with much higher levels of income inequality (1990-00), growth falls for every group except the highest income earners.
The results are stark and counter the nonsense peddled by the IMF and most mainstream economists for years about the benefits of trickle down on the back of rising inequality.
They conclude that:
… the rich, when inequality is high and their incomes are significantly greater than the incomes of the middle classes, prefer not to invest in public goods like education, health and infrastructure, but to consume them privately. This is the type of behavior observed among the rich in developing countries, most notably in Brazil … However, the public goods that the rich are not interested to invest in are crucial for real income growth of the poor.
So the more advanced nations are starting to replicate the societal dynamics of the poorer nations as inequality increases. The other point is that the growth shifted from pro-poor to pro-rich in the 1980s as the neo-liberal economic agenda became dominant.
The political implications of their research are clear:
If the current economic processes generating high inequality also help increase the future income growth of the rich, the questions may be asked: Why would the rich accept a policy that would slow their future income growth and thereby reduce their share of the pie?
And that is one of the puzzles that have to be addressed – how to break the power that high incomes and the high wealth that flows from it has on public policy.
The problem that this research identifies will have worsened since 2000 (the end date of their analysis).
Another example of this deliberate strategy to undermine the capacity of policy frameworks to advance human welfare is the topic of a comment published in The Lancet Global Health on December 22, 2014 – The International Monetary Fund and the Ebola outbreak – by several British-based academics ask whether:
… the IMF had contributed to the circumstances that enabled the crisis to arise in the first place
Full Reference: Kentikelenis, A., L. King, M. McKee, and D. Stuckler (2014) ‘The International Monetary Fund and the Ebola Outbreak’, The Lancet Global Health.
This claim has been one of my themes over the course of the crisis – see the blog – Friday lay day.
Here the authors implicate the multilateral institutional structure in the problem.
In the Lancet article, the claim is that:
A major reason why the outbreak spread so rapidly was the weakness of health systems in the region … Since 1990, the IMF has provided support to Guinea, Liberia, and Sierra Leone, for 21, 7, and 19 years, respectively, and at the time that Ebola emerged, all three countries were under IMF programmes. However, IMF lending comes with strings attached-so-called “conditionalities”-that require recipient governments to adopt policies that have been criticised for prioritising short-term economic objectives over investment in health and education … Indeed, it is not even clear that they have strengthened economic performance.
They are referring to the Structural Adjustment Programs (SAP) which have actually made the poor nations poorer. Please read my blog – IMF agreements pro-cyclical in low income countries – for more discussion on this point.
The authors list the problems that the IMF have brought to the poorer nations:
1. The “economic reform programmes by the IMF have required reductions in government spending, prioritisation of debt service, and bolstering of foreign exchange reserves. Such policies have often been extremely strict … absorbing funds that could be directed to meeting pressing health challenges.”
2. The result has been that many nations under SAPs have “failed to meet targets for social spending” (including health spending) because of restrictions placed by the IMF on government spending.
3. To “keep government spending low, the IMF often requires caps on the public-sector wage bil l- and thus funds to hire or adequately remunerate doctors, nurses, and other health-care professionals.” These limits are usually arbitrarily imposed “without consideration of the impact on expenditures in priority areas” and have led to health professionals leaving the nations in search of work elsewhere.
They cite the example of Sierra Leone (an ebola hotspot) where the IMF forced a reduction in public employment by 28 per cent between 1995 and 1996 and wages growth was limited until 2000. The “WHO reported a reduction of community health workers from 0·11 per 1000 population in 2004 to 0·02 in 2008”.
When Sierra Leone launched a new “Free Health Care Initiative” in 2010, the IMF demanded a slower introduction for fiscal reasons.
4. The “IMF has long advocated decentralisation of health-care systems” in privatised form. But the authors show how this makes “it difficult to mobilise coordinated, central responses to disease outbreaks”.
The conclusion:
All these effects are cumulative, contributing to the lack of preparedness of health systems to cope with infectious disease outbreaks and other emergencies.
George Monbiot’s article recently (December 8, 2014) – Taming corporate power: the key political issue of our age – helps to explain what has been going on.
He argued that the desires of the population are rarely evident in policy and the left is seemingly “incapable of offering effective opposition to market fundamentalism, let alone proposing coherent alternatives” because we are all living under an “enemy occupation” where the enemy is “corporate power”.
He argues that corporations who gain more power and income when governments privatise health and education systems, out-source public services, fail to regulate or oversee financial markets, fail to introduce environmental protections (taxes etc) coerce the political system through the funding regimes in place which permit:
… big business and multimillionaires in effect to buy political parties. Once a party is obliged to them, it needs little reminder of where its interests lie. Fear and favour rule.
The corruption also works because “Ministers and civil servants know that if they keep faith with corporations in office they will be assured of lucrative directorships in retirement”.
I will deal with his proposals for political funding reform at a later date but the essential point is that corporations should not be able to fund political parties and “all lobbying should be transparent”.
He goes further – in directions I support – such as making the CEO’s pay for corporate failure.
I go further still. I would force politicians and department heads (such as those in the European Commission) and central bank heads to have their salaries tied to the national unemployment rate and the underemployment rates.
Sharp cuts in their pay would occur if these rates deviated from full employment for any period of time. I would speculate that schemes like the Job Guarantee would follow soon after such legislation was introduced.
Conclusion
As we approach the festive season there is a lot of talk about taking care of people and all the rest of the narrative that capitalism uses to foster spending to boost profits.
But the underlying economic system that has evolved under neo-liberalism is sick to the core and getting worse.
My hope that the GFC would create a dynamic for major change is looking pretty wan at this stage.
It is as if the elites blinked, then got on with the task of further reinforcing their position at the top.
Revolutions have occurred for less.
That is enough for today!
(c) Copyright 2014 William Mitchell. All Rights Reserved.
No doubt there are economic reasons for this latest Ebola outbreak. There have been many in the past but none of this severity.
But it is not as simple as that even though economists think that their “discipline” is the centre of the World.
There has been a massive attack on the tropical forests of West Africa (for economic reasons – aka greed).This has forced many animals,like bats, to seek sustenance in settled areas. These areas are ever expanding due to population “growth” – yes, that cherished word in the economists lexicon.
This has increased the chances of transmission to Homo Saps,who also like their bush meat. How many Australians would eat flying fox (fruit bat) knowing that they are carriers of the Hendra and Lyssa virus.
Throw in some very questionable burial rites and you have a fine prospect for an epidemic. Remember that the Ebola virus is very infectious but not very contagious. The influenza virus leaves it for dead in the latter case.
As for revolutions,they won’t happen until we go much further down the shit chute.The proles are very stupid,amnesic and patient.
https://www.youtube.com/watch?v=0BmcrzzKrxc
A very graphic picture of income disparity before 1980 and after 1980 can be seen at about the 3 minute mark in this video.
Dear Bill
People can support slower growth of the pie if their own slices grow faster. Compare 2 situations. In A, 9 people have an income 0f 20,000 and 1 has an income of 120,000. The incomes of the 9 are stagnant but the income of the richest person grows by 25%. That is a total growth of 10%. In situation B, people start with the same income distribution. The 9 poorest enjoy income growth of 20% and the richest one sees his income go up by 10%. Total growth is now 16%. There is faster overall growth, but the slice of the richest person is now smaller than in A. From a purely selfish point of view, the richest person should prefer situation A to B.
The point to remember is that aggregates and averages are only statistics. Nobody consumes the whole pie or the average slice. We consume only our own slice. If people behave selfishly, as neoliberals think they should, then they will be guided only by the size of their own slice, not by the size of the pie.
Regards. James
£30 billion is sitting pretty in the ring fenced and full National Insurance Fund in the UK and being called a surplus by the government Tories and Labour alike, when it is the non paid state pension since 2013 to women born from 1953 and men born from 1951.
By the rise in retirement age, some men in fact cannot retire til in their 70s under new benefit rules.
What is more this age group onwards face NIL STATE PENSION FOR LIFE
and actually for the rest, by all the small print, actually getting far less not more state pension
than the current lowest state pension of all rich nations bar poor Mexico.
As the poor spend all the income they get, this money is being denied into the economy and the lowest income peoples’ cost of living crisis in the UK.
James, those are interesting examples and perhaps some people think like these neoliberals but we are also told that people’s happiness does not increase linearly with income or wealth. The marginal increase in happiness drops off as income increases. I would argue that most people are concerned with their own welfare first but are also favourably inclined towards others’. If you optimise the total welfare using the non-linear utility function for individuals, the conclusions are different.
The Economist did a special report on income inequality, and the end of work — 47% of American jobs will disappear in a decade. Truck drivers, taxis, and loads of medical jobs, including radiologists, anesthetists, the list was frightening. 7 billion unhappy breeders, a couple thousand billionaires, and dead forests, oceans and rivers.
I vote Giraffes – not Africans. I vote middle class, not billionaires. I vote oceans, not fishermen.
Misanthrope on the left hates people with large carbon footprints… misanthrope on the right hates everybody else. We are in for some very bloody population reduction… and not a moment too soon. I won’t miss one of the casualties.
Tying politicians and technocrats salary to unemployment…genius!
I have just read “The Endless Crisis” by John Bellamy Foster and Robert W. McChesney. The subtitle is “How Monopoly-Finance Capital Produces Stagnation and Upheaval from the USA to China.”
The basic thesis of the book is that capitalism is on the throes of a long-run stagnation crisis from about 1970 to the present and this will be ongoing if nothing is changed. The crisis is one of capital overaccumulation. In simplistic everyday terms, this means too much capital at the top and too little money and wages at the bottom. In other words, the biggest oligarchs and the biggest transnational corporations have accumulated too much capital in all of the forms of fixed capital, money capital and stocks and bonds etc. At the bottom, the masses have too little money, mostly from factors like unemployment, wages being depressed and cuts in welfare. The masses can’t spend, can’t drive aggregate demand and economic capacity cannot be used. A proportions of industrial plant and people are idle.
Because capital cannot find enough places to profitably invest in production, the size of the financial economy and speculation have much increased, creating huge asset bubbles of various kinds. The GFC started with an asset bubble in US housing and toxic derivatives and other dodgy financial instruments. Foster and McChesney provide data in the form of basic graphs and tables which show; a long-run decline in world economic growth rate from about 1970 to the present; wages have not kept up with productivity gains and have indeed stagnated or regressed in recent decades; capital is concentrating in fewer and fewer big conglomerates and transnational corporations. The monopolisation or oligopolisation of the economy means genuine competition happens less and less being replaced by collusion, cartel-like behaviour and price-following.
The authors also discuss labour arbitrage or the move to manfufacturing and assembly in poor, developing countries. There is egregious exploitation of workers in those countries like China and there is a still a pool of 1 billion to 2 billion peasants in the entire third world to be utilised for this process. This of course allows wages to be pressured down in developed countries.
My opinion is that the monopoly-finance capitalists are nearing the peak of their power. There will be no end to their power while other factors remain unchanged. They will not willingly give up wealth and power nor stop exploiting the poor and the weak. Conditions so far do not look conducive to revolution, the only event which could change this set-up. If matters are to change, there will at some point have to be a peaceful revolution of democracy and education so that people have the power and knowledge to change things. Failing this, matters can only end in violence, wars, revolution and possibly reaction.
Again my additional opinion, Limits to Growth will put pressures on the economy to move from material growth to material steady state. This will put additional stress on the entire system and exacerbate the plight of the poor and the weak. We are in for turbulent times although the final crisis could be 20 to 50 years in the future.
twas,
“The greatest flight that cause has seen,
as red as a smug set of pinstripes on an undercarriage flight to no-where and the highest record of under-employment since a record”,the cleaners said to the defense force and the com’s public sector’s as the words read to a scripted dot,”Don’t join the union at the ‘Aggregate Demand’,there’s 21 tonnes of benefit aboard,now with that and all the ‘Exit’ sign’s had to be recovered in quick re-shuffle to ‘liberal’,this flight’s got buckets of shame-pain,writ large for a rug-man and there packed in like sets of handle-less rakes and broken vacuums to a ‘Fasten your seat belts’ sign that looks that convincing that even Harvey Norman had to turn it down at 91.1,with David Jones and Myer still on stand-by with the boxes,saying it’s just a poster in waiting…and so it was
As Hockey tightened his belt to board the downward spiral,revenues short, in a hope they headed-off to the pitch of greener cuts for a game of soccer,cos that’s where the money’s gone..not to everyone that’s not got a job…thinking if
This liberalism was an oyster eating apple,even the worms at the heart of it’s core,would and should be worried about it’s seedless growth in fallen to a now trodden..PK
I say it’s hard to shake a commitment to good leads…where at least something took-off and landed.
Thanks too P.M and captain Mitchell for the Fairfax.
Twas fun at my age..
Icarus said: “Tying politicians and technocrats salary to unemployment…genius!”
Well, not really. Better to tie the salaries of politicians and technocrats to unempayment. The reality is that modern technology (computers, robots, etc) has made much of traditional employment unnecessary. One solution is to cut working hours, another is to broaden the definition of employment, another is to redistribute economic rent. But however it is done, it all boils down to ensuring that the average citizen receives adequate payment to allow him/her to purchase the necessities of life and anything additional to that which the economy will allow.
Dear Tonyv
I quite agree with you that there is diminishing marginal utility of income. This implies that the total utility of a population will the greatest when income is more or less equally distributed. However, if people are principally concerned with their own utility, then what matters to them is not total utility but their own. In other words, they care about the size of their own slice, not the size of the pie.
The traditional view is of course that the slices should be more or less equal, but that the difference between the slices should be big enough to preserve incentives and allow the pie to grow. After all, it is better to have a less than equal slice of a big pie than to have an equal slice of a very small pie. Equal misery for all cannot be a policy goal. Even conservatives pay lip service to equality when they argue that income tax cuts for the rich will make all of us better off. I don’t think that they are really sincere, but at least they recognize that policies that are aimed to make the rich richer are a tough sell in a democracy.
Conservative like to talk about aggregates and averages. That way they don’t have to take distribution into account. Let’s take 2 groups of 10 people again. In group A, 9 people earn 25,000 per year and 1 earns 75,000, for a total of 300,000 and an average of 30,000. In group B, 9 people earn 20,000 per year and 1 earns 180,000, for a total of 360,000 and an average of 36,000. In group B, the average is 20% higher than in group A, but obviously, group A is to be preferred because in group A, 90% of the people are better off than in group B by 20%. If you think that group B has the more desirable outcome because it has the higher average, then you qualify for membership in the Republican Party.
Regards. James
James, I don’t believe I think like the archetypical republican 🙂 but I am not American anyhow. I agree with you and understand the arithmetic except that I think the average is more likely to be higher when there is lower inequality. When a population has a large number of poor with low education, training and capital to work with, the country’s productivity is reduced and the total pie is smaller. This is a good reason to reduce unemployment even before adding arguments about morality and fairness.
Cheers, Tony
Dear Tony
I think that you are making a valid point about the correlation between extreme inequality and low productivity. If we put the Gini coefficient on the horizontal axis and GDP on the vertical axis, then we may get something like the (in)famous Laffer curve, that is, an inverted U. If the Gini coefficient is close to 0, GDP will be low, but if it is close to 1, it will also be low. Inbetween, it will be higher.
Best wishes. James
2 facts seem to emerge:
1. capitalism could be threatened if demand of the middle class is not strengthened
2. The wealthy need to have their lives improved through higher taxes. The game of who dies with the most wealth is an old game – Carnegie, Rockefeller, Vanderbilt, and of course the poor guy in the group, JP Morgan – resulting in economic cycles. If the game is enjoying one’s money a better economy results, whatever that means.
Two other things need doing:
1. Wall Street must adopt the medical theme: do no harm.
2. Estate taxes are opportunity taxes for someone else than the children of the original wealth producers who generally should start new businesses in the same garage as their fathers and mothers instead of wasting valuable national resources.