It was only a matter of time I suppose but the IMF is now focusing…
Friday lay day – more snake oil from Brussels
Its my Friday lay day blog. I am in Sri Lanka at present and will have some reports about that over the next 14 odd days. I was amazed overnight by the comments from IMF boss Lagarde who made overt political statements in an upcoming election year by claiming that David Cameron had shown “eloquent and convincing” leadership in the global recovery. She said they were a model for the European Union. When asked why the IMF had criticised Britain in 2012 for “playing with fire” by invoking fiscal austerity, she said the IMF had “got it wrong” (Source). Hmm. No recognition that Britain cannot be a model for most of the EU nations, given the latter surrendered their currency sovereignty, imposed fiscal rules that prevent growth, and have a central bank that will not act as a responsible currency issuer. Further, it was a false admission of failure. In fact, the IMF got it right and Britain didn’t implement the austerity that it had initially planned and has kept a relative large fiscal deficit that has helped support growth.
But I wanted to comment today on a throwaway line on Page 32 of the recently released – EU Employment and Social Situation, December 2014 – (5.9 mb), which said the following:
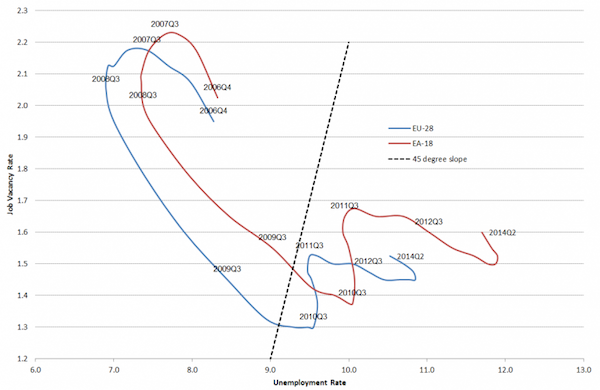
The upward shift in the EU Beveridge curve, which has occurred in the EU since 2008 (with a higher indicator for labour shortage for a given unemployment rate) suggests increasing mismatches in the EU labour markets. Recent data suggest both positive and negative developments in relation to the labour market matching process in the EU. The recent developments of lower unemployment and higher labour shortage are equivalent to the usual move along the Beveridge curve and confirm the recent improvements in the job vacancy rate. At the same time and up to the start of 2010, the Beveridge curve has shifted upwards relative to its general position, suggesting a structurally worse matching process in the EU (Chart 39).
The Chart 39 in question is reproduced here, although I use the data available in the special Eurostat page – Job vacancy and unemployment rates – Beveridge curve.
The EU’s explanation of the recent data observations as shifts in the curve run along the conventional lines, which lead to the claims that the mass unemployment is structural in cause and therefore needs a different policy solution – not an increase in aggregate demand but more training, income support cuts etc.
Economists have long used the unemployment-vacancy (UV) relationship, the so-called Beveridge curve, which plots the unemployment rate on the horizontal axis and the vacancy rate on the vertical axis to investigate these sorts of questions.
The Beveridge curve is named after the British economist William Beveridge who was influential in defining the full employment agenda in the Post World War 2 period in the UK (and, arguably in most advanced nations).
The following diagram is the usual depiction of the UV relationship with vacancies on the vertical axis and unemployment on the horizontal axis. The red line is a UV curve at some point in time.

The logic is that movements along the curve are cyclical events and shifts in the curve are alleged to be structural events. So a movement “down along the red curve” to the south-east suggests a decline in the number of jobs available due to an aggregate demand failure, while a movement “up along the red curve” indicates improved aggregate demand and lower unemployment.
If unemployment rises in an economy where there are movements along the UV curve it is referred to as “Keynesian” or “cyclical” unemployment – that is, arising from a deficiency in aggregate demand.
However, the notion that there is a neat decomposition between shifts in and movements along the curve is highly contested and has not been reliably established in the empirical or theoretical literature.
One of my earliest papers, which came from my PhD work was published in 1987 – ‘The NAIRU, Structural Imbalance and the Macroequilibrium Unemployment Rate’, Australian Economic Papers, 26(48), pages 101-118 – showed that structural imbalances (supply constraints) can be the result of cyclical variations and can be resolved, in part, by attenuating the amplitude of the downturns using fiscal policy.
In other words, there is no decomposition as the mainstream would like us believe.
This is reinforced by work I did a decade ago where it is clearly shown that where the UV curve shifts, almost always the shifts were associated with major recessions which generated structural-like changes in the labour market. In other words, the shifts are driven by cyclical downturns (aggregate demand failures) rather than any changes in autonomous supply side behaviour (like worker attitudes changing, or welfare policy introducing distortions to incentives, etc). More about which later.
The mainstream search literature (for which Nobel Prizes have been awarded) claims that ‘shifts in the curve’ (out or in) indicated non-cyclical (structural) factors were causing the rising falling unemployment. The prize winners claimed this meant that if the UV curve was shifting out then the labour market was becoming less efficient in matching labour supply and labour demand and vice versa for shifts inwards.
The factors that allegedly “cause” increasing inefficiency are the usual neo-liberal targets – the provision of income assistance to the unemployed (dole); other welfare payments, trade unions, minimum wages, changing preferences of the workers (poor attitudes to work, laziness, preference for leisure, etc).
The outward shift in the EU UV curve is clearly evident. These outward shifts are common in many nations when deep recessions occur.
The architects of the OECD Jobs Study – LSE economists Layard, Nickell and Jackman – [Reference: Layard, R., Nickell, S. and Jackman, R. (1991) Unemployment, Macroeconomic Performance and the Labour Market, Oxford University Press: Oxford] were instrumental in misleading the public (and policy makers) about these shifts.
They argued (Pages 4, 38) that these shifts are due to a failure of the unemployed to seek work as effectively as before. They explained the outward shift in the European Beveridge curve by:
… a fall in the search effectiveness … among the unemployed.
They later claimed that (Page 268) that the UV shift were due to “the rise in long-term unemployment, which reduces search effectiveness …”
What does this mean?
LNJ (Page 38) offered the following explanation:
Either the workers have become more choosey in taking jobs, or firms become more choosey in filling vacancies (owing for example to discrimination against the long-term unemployed or to employment protection legislation.
They suggested that the first reason dominates.
There was always what economists call an ‘observational equivalence problem’ in attempting to test for this. This sort of problem arises when movements in the data are consistent with competing theoretical explanations.
In this case, job search time will lengthen when there are large cyclical downturns and the probability of gaining a job decreases.
But with high UV ratios (at the time), it becomes a fallacy of composition to conclude that if all individuals reduced their reservation wage to the minimum (to maximise supply-side search effectiveness) that unemployment would significantly fall (given the small estimated real balance effects in most studies).
Further, unless growth in labour requirements is symmetrical and labour force growth steady on both sides of the business cycle, the pool of unemployed can rise and remain persistently high.
While it is impossible to directly test changes in the motivation of individuals independent of the hypothesis that the shifts are collateral damage of severe recessions the dates when the UV curve shift should give you a good idea of what is going on.
It is no surprise that these shifts or periods of instability occurred during major demand-side recessions. That is, they are driven by cyclical downturns (macroeconomic events) rather than any autonomous supply-side shifts.
At these times, there was no major shift in any policies which the neo-liberals have identified as ‘structural impediments’ to search-effectiveness. The notion that the shifts in the UV curve are due to some policy-induced structural deterioration in search effectiveness beggars belief.
To advance the view that the workers suddenly choose this sharp rise in unemployment and then to design policies which hack into unemployment benefits and other protections to stop reduce the “incentives” for the unemployed to remain that way also beggars belief.
However, undaunted by some empirical evidence, the work of LNJ provided much of the “academic” justification for the OECD Jobs Study agenda, which was released in 1994.
The Jobs Study, exploited the misinformation about the shifts in the UV curve and set out the blueprint for labour market deregulation which has dominated the last 15 or so years. Governments around the world started to implement the OECD agenda – the so-called labour market activism – with more or less vigour.
The OECD constantly pressured governments to abandon the hard-won labour protections which provide job security and fair pay and working conditions for citizens.
Their solution? Cut benefits, toughen activity tests, eliminate trade union influence, abandon minimum wages and reduce any subsidies that prolong the search propensity by workers.
The result? Even before the crisis, unemployment remained well above the full employment levels in most nations; real GDP growth was muted relative to the past; real wages growth has been suppressed relative to productivity growth – leading to a massive redistribution of real income to profits; private gross capital formation has been lower than in the past.
Most economies failed to provide enough employment relative to the preferences of the labour force and persistent demand-deficient unemployment was accompanied by rising underemployment in many countries.
In the past I have used so-called phase diagrams to provide further understanding on interpreting shifts in UV curves.
I first started using phase analysis in this 2001 paper – Exploring labour market shocks in Australia, Japan and the USA, which has since been published but you can get the free working paper version at the link provided. You will find reference in that paper to other relevant material if you are interested.
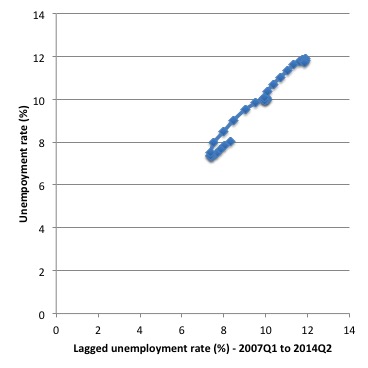
The following two phase diagrams show the current values of the respective time series plotted on the y-axis against the lagged value of the same series on the x-axis. The annual data is from 1966 to 2013 (so the graphs are for 1967 to 2012 given the lagged values).
These scatter plots are helpful in four distinct ways:
- The charts provide information on whether cycles are present in the data.
- The presence of “attractor points” can be determined. The points might loosely be construed as the middle of each of the traced-out ellipses.
- The magnitude of the cycles can be inferred by the size of the cyclical ellipses around the attractor points.
- The persistence (strength) of the attractor point can be determined by examining the extent to which it disciplines the cyclical observations following a shock. Weak attractors will not dominate a shock and the relationship will shift until a new attractor point exerts itself.
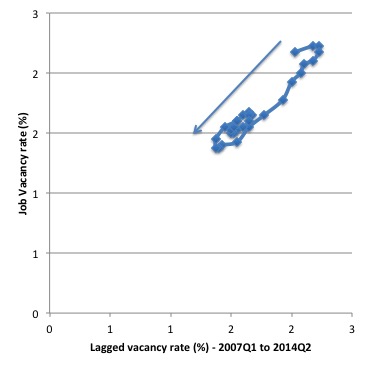
The first graph shows the phase diagram for the Eurozone (18 nations) unemployment rate while the second graph shows the phase diagram for the vacancy rate.
During the period (2007Q1 to 2014Q2), the unemployment phase relationship shifted out (the most recent observations are those further from the origin).
There is no evidence yet that a new attractor has been established. The history of the UR relationship is clearly explained by the massive jobs shortage driven by the private spending collapse associated with the GFC and then the subsequent fiscal austerity.
What about the vacancy phase relationship? The GFC and fiscal austerity has clearly pushed the vacancy rate relationship towards the origin and again it is hard discern whether the consolidation in recent quarters is a new attractor point or not.
The important point is that the shift in the likely vacancy rate attractor has been downwards. The most recent observations are those closer to the origin.
The supply-side analysis – rehearsed yet again in the EU Employment and Social Situation for December 2014 – and interprets the unemployment shift (and outward movements in the UV curve above) as indicative of a decline in labour market efficiency. The cure – structural adjustment aka labour market deregulation.
But using the same logic, we would interpret the inward shift in the vacancy relationship as a sign of increasing efficiency in the process that matches labour supply and labour demand (less unfilled vacancies are present at any time).
Clearly, both states cannot hold. The unemployment behaviour cannot be indicating a deteriorating structural efficiency while the vacancy relationship is depicting the opposite.
A consistent interpretation for both movements can be found in the view that the European economy has been demand constrained as a result of the GFC and the subsequent fiscal austerity that emerged in 2010 and after.
It is more likely that the shift in the UV is the result of the increasing dominance of neo-liberal and fiscal austerity. The same findings can be found for other nations with the same explanation.
The rapid rise in unemployment in 2009 in Europe was so large that subsequent (lower) growth with on-going labour force and productivity growth has not been able to reverse the stockpile of unemployed.
Whatever endogenous supply effects that may have occurred in skill atrophy and work attitudes were not causal but reactive.
The phase diagram analysis suggests that to restore full employment, the economy needs a major positive shock of a sufficient magnitude to shift the current attractor point downwards.
It is almost definite from the earlier analysis and related empirical work reported in my 2008 book with Joan Muysken – Full Employment abandoned – that this shock has to be aggregate and focused on the demand side.
That is, large-scale job creation is required.
This is, of-course, consistent with our assessment that a Job Guarantee would not only be the most efficient inflation anchor available but would also be sufficient to shift the attractor down to levels consistent with full employment.
So more snake oil from the European bureaucrats in Brussels as the labour market disaster continues for the 7th year.
An American who is ashamed to be so!
Speaking of snake oil, this interview was broadcast on the Australian Radio National network on the September 9, 2014. It is with the journalist and photographer Michael Katakis, who recent book – A Thousand Shards of Glass: There is another America (published by Simon and Shuster) is a scathing reflection on an America that has lost its way.
He thinks the obsession with religion and patriotism is fraudulent – just for appearances and that America violates the basis principles of democracy and justice. He thinks corporate America is full of snake oil sales persons (mostly men).
The book is a salutary tale about what the last three or so decades of neo-liberalism have done and the way the US has led the way in perverting things we value and promoting hate, inequality and global insecurity.
The – full interview – is worth listening to.
Labour Market data
I did a segment for the ABC Radio national current affairs program PM, yesterday (January 15, 2015) – Jobless rate drops in December in sign of improving economy.
Locations
Here is my view this morning from where I am currently staying in the ‘Fort’ (city centre) of Colombo. The view first shows the Indian Ocean (I ran along the seaside for several kilometers early this morning).

The next picture is the central bank (Bank of Ceylon), which I am overlooking as I type. This is the building that was involved in the – Colombo Central Bank bombing – in 1996 when 91 people were killed and around 1,400 others were injured.
I wonder what the officials in the Bank of Ceylon will do today after the Indian central bank made a major move yesterday by lowering rates to stimulate growth and avert deflation.
The speculation is that the SL central bank will have to follow suit. I will find out on Monday when I meet up with some economists.
Of course, nothing will be as major as the decision by the SNB (Swiss National Bank) to break the cap on the Swiss Franc against the euro, which saw it appreciate around 40 per cent (an historically record shift) against the failing euro.
I will be following that in the days to come because it might start to signal a push by Germany to clear up the Greek uncertainty.

Saturday Quiz
The Saturday Quiz will be back again tomorrow. It will be of an appropriate order of difficulty (-:
That is enough for today!
(c) Copyright 2015 Bill Mitchell. All Rights Reserved.
Hello Bill
Curious to see your reading on SNB’s move ? why do you think they did this ? what could be the consequences ? Many thx
Antoine
Again I am but a Dork but the observational evidence within the eurozone is as clear as it gets.
Forming a Critical mass of anything but cars is impossible within the eurozone.
It function is to grow outwards much like a tumour but it has no beating heart.
The old city of Cork will be abandoned soon.
Given it hard money characteristics even Dorks who despise modernity will be pushed into the burbs so as to consume useless and inferior products of German discount stores.
The amount of energy wasted chasing scarce money is epic.
The energy remaining for personnel and social consumption will soon reach Victorian lows for many.
Almost all energy consumption is of a conduit nature no matter how efficient the consumption may be.
There seems to be rather a lot of surprise over the revaluation of the swiss franc. (CHF)
The Swiss were running a 16% of GDP trade surplus. What is the point of that? So unless the Swiss PDS are saving huge amounts even a moderate budget surplus is likely to represent quite loose fiscal policy. Swiss unemployment is reportedly at about 3% which would tend to support that view.
I doubt the Swiss will let their currency float that freely. They will still manipulate it downwards to maintain an export surplus. Imports are a net benefit, Exports are a net cost to any economy. The Swiss economy included. Maybe the Gnomes of Zurich have been reading Bill Mitchell and Warren Mosler!