The IMF and the World Bank are in Washington this week for their 6 monthly…
Australian inflation trending down – lower oil prices and subdued economy
Despite missing out on the recession associated with the GFC, Australia is now following the rest of the world down the decelerating inflation route. Yesterday, the Australian Bureau of Statistics released the Consumer Price Index, Australia – data for the December-quarter 2014 yesterday. The December-quarter inflation rate was 0.2 per cent which translated into an annual inflation rate of 1.7 per cent. Recall that the September-quarter inflation rate was 0.5 per cent and the annual rate was 2.3 per cent. The Reserve Bank of Australia’s preferred core inflation measures – the Weighted Median and Trimmed Mean – are now at the bottom end of their inflation targetting range (2 to 3 per cent) and are trending down. Various measures of inflationary expectations are also flat or falling, including the longer-term, market-based forecasts. This suggests that the RBA may consider that the major problem in the economy is declining growth and rising unemployment, especially in the context of China’s deliberate slowdown. The benign inflation outlook provides plenty of room for further fiscal stimulus.
The summary results for the December-quarter 2014 are as follows:
- The All Groups CPI rose by 0.2 per cent compared with a rise of 0.5 per cent in the September-quarter 2014.
- The All Groups CPI rose by 1.7 per cent over the 12 months to the December 2014, compared to the annualised rise of 2.2 per cent over the 12 months to September-quarter 2014.
- The Trimmed mean series rose by 0.7 per cent in the December-quarter 2014 and by 2.2 per cent over the previous year (down from 2.4 per cent for the 12 months to September 2014).
- The Weighted median series rose by 0.7 per cent in the December-quarter 2014 and by 2.3 per cent over the previous year (down from 2.6 per cent for the 12 months to September 2014).
- The significant price rises this quarter were for domestic holiday travel and accommodation (+5.8 per cent), tobacco (+4.8 per cent) and new dwelling purchase by owner-occupiers (+1.1% per cent).
- The most significant offsetting price falls this quarter were for automotive fuel (-6.8 per cent), audio, visual and computing equipment (-5.2 per cent) and audio, visual and computing media and services (-3.8 per cent)
The ABS commented that:
Automotive fuel fell in December (-8.4%) and November (-4.2%), rose in October (+1.2%), fell in September (-1.7%) and August (-4.0%). Global oil markets continue to experience oversupply, which resulted in continued falls in oil prices. In Australia, unleaded petrol prices reached a low of $1.17 per litre in December 2014, the lowest recorded average daily price since February 2009.
They provided this graph of the “pattern of the average daily prices for unleaded petrol for the eight capital cities over the last fifteen months”.
Trends in inflation
The headline inflation rate increased by 0.2 per cent in the December-quarter 2014 translating into an annualised increase of 1.6 per cent for the year to December 2014 which a significant reduction on the September-quarter 2014 result of 2.2 per cent.
The following graph shows the annual headline inflation rate since the first-quarter 2002. The black line is a simple regression trend line depicting the general tendency. The shaded area is the RBA’s so-called targetting range (but read below for an interpretation).
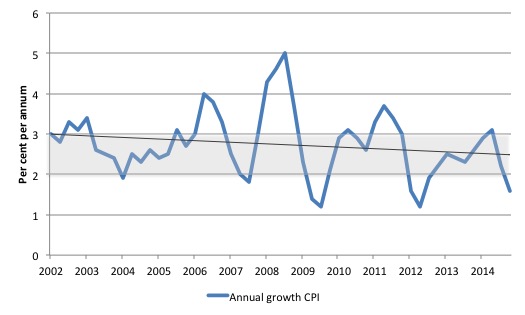
As noted above, the December-quarter decline in inflation is mostly the result of falling petrol prices although the overall moderation in economic activity has also been a source of lower inflation.
The rise in tobacco prices is down to excise price rises (a deliberate policy decision).
Implications for monetary policy
What does it mean for monetary policy? The RBA will well understand that the fuel price declines are outliers in the overall trend which is for a moderation of inflation.
The Consumer Price Index (CPI) is designed to reflect a broad basket of goods and services (the ‘regimen’) which are representative of the cost of living. You can learn more about the CPI regimen HERE.
The ABS say that:
The CPI is a temporal price index for consumption goods and services acquired by Australian resident households. It is an important economic indicator, providing a general measure of price change … The principal purpose of the Australian CPI is to measure inflation faced by consumers to support macroeconomic policy decision making. This is achieved by providing a measure of household consumer inflation by the acquisitions approach.
There are various ways of assessing the general movement in prices depending on the purpose that the measure is being used for.
The document I linked to above details some of the approaches. One of these approaches – the “acquisitions approach” – attempts to measure “household consumer inflation” and defines the basket of goods and services as “consisting of all consumer goods and services actually acquired by households during the base period.”
The ABS use “market prices for goods and services” (including taxes etc) and make no imputations for “non-monetary transactions” (such as imputed rents). They also exclude “interest rate payments”.
So is a headline rate of CPI increase of 0.2 per cent for the December-quarter significant for monetary policy decisions? To examine its lasting significance we have to dig deeper and sort out underlying structural inflation pressures and ephemeral price factors.
The RBA’s formal inflation targeting rule aims to keep annual inflation rate (measured by the consumer price index) between 2 and 3 per cent over the medium term. Their so-called ‘forward-looking’ agenda is not clear – what time period etc – so it is difficult to be precise in relating the ABS data to the RBA thinking.
What we do know is that they do not rely on the ‘headline’ inflation rate. Instead, they use two measures of underlying inflation which attempt to net out the most volatile price movements. How much of today’s estimates are driven by volatility?
To understand the difference between the headline rate and other non-volatile measures of inflation, you might like to read the March 2010 RBA Bulletin which contains an interesting article – Measures of Underlying Inflation. That article explains the different inflation measures the RBA considers and the logic behind them.
The concept of underlying inflation is an attempt to separate the trend (“the persistent component of inflation) from the short-term fluctuations in prices. The main source of short-term ‘noise’ comes from “fluctuations in commodity markets and agricultural conditions, policy changes, or seasonal or infrequent price resetting”.
The RBA uses several different measures of underlying inflation which are generally categorised as ‘exclusion-based measures’ and ‘trimmed-mean measures’.
So, you can exclude “a particular set of volatile items – namely fruit, vegetables and automotive fuel” to get a better picture of the “persistent inflation pressures in the economy”. The main weaknesses with this method is that there can be “large temporary movements in components of the CPI that are not excluded” and volatile components can still be trending up (as in energy prices) or down.
The alternative trimmed-mean measures are popular among central bankers.
The authors say:
The trimmed-mean rate of inflation is defined as the average rate of inflation after “trimming” away a certain percentage of the distribution of price changes at both ends of that distribution. These measures are calculated by ordering the seasonally adjusted price changes for all CPI components in any period from lowest to highest, trimming away those that lie at the two outer edges of the distribution of price changes for that period, and then calculating an average inflation rate from the remaining set of price changes.
So you get some measure of central tendency not by exclusion but by giving lower weighting to volatile elements. Two trimmed measures are used by the RBA: (a) “the 15 per cent trimmed mean (which trims away the 15 per cent of items with both the smallest and largest price changes)”; and (b) “the weighted median (which is the price change at the 50th percentile by weight of the distribution of price changes)”.
While the literature suggests that trimmed-mean estimates have “a higher signal-to-noise ratio than the CPI or some exclusion-based measures” they also “can be affected by the presence of expenditure items with very large weights in the CPI basket”.
The authors say that in the RBA’s forecasting models used “to explain inflation use some measure of underlying inflation (often 15 per cent trimmed-mean inflation) as the dependent variable”.
The special measures that the RBA uses as part of its deliberations each month about interest rate rises – the trimmed mean and the weighted median – also showed moderating price pressures.
So what has been happening with these different measures?
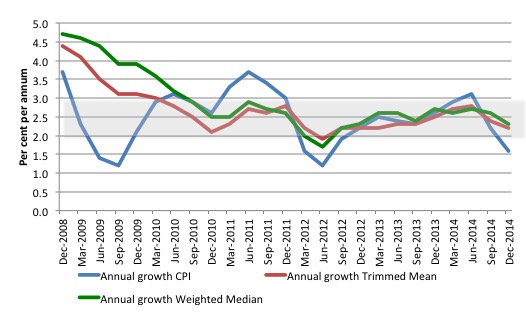
The following graph shows the three main inflation series published by the ABS over the last 24 quarters – the annual percentage change in the all items CPI (blue line); the annual changes in the weighted median (green line) and the trimmed mean (red line). The RBAs inflation targetting band is 2 to 3 per cent (shaded area).
The data is seasonally-adjusted.
The CPI measure of inflation (at 1.6 per cent down from 2.2 per cent in the September-quarter 2014) is now well below the target band, while the RBAs preferred measures – the Trimmed Mean (2.2 per cent down from 2.4 per cent) and the Weighted Median (2.3 per cent up down from 2.6 per cent) – are now approaching the lower bound of the RBAs targetting range of 2 to 3 per cent.
But if we dig a little deeper we can understand the current result a bit better.
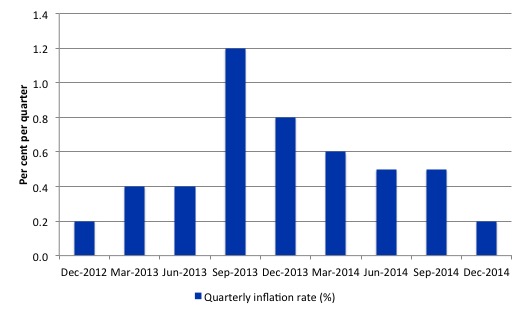
Annualised growth calculations are affected by two things: (a) the current value, and (b) the value four-quarters ago (the base quarter). If there is an unusually low observation in the base quarter then the current annual inflation rate will appear higher than it might otherwise be once we take the influence of the unusually low base quarter.
It turns out that the September-quarter 2013 result (1.2 per cent) was such a quarter (check it in the graph below). This strong quarterly result distorted the annualised inflation calculation for the next three quarters. That impact has now been out of the annualised estimates since the September-quarter 2014. The trend over the last year is now firmly downward.
How to we assess these results?
First, there is clearly a downward trend in all of the measures. The “core” measures used by the RBA have been benign for many quarters even with a relatively large fiscal deficit and record low interest rates. They are now trending down.
Second, it is clear that the RBA-preferred measures are now at the bottom of the inflation-targeting band. The RBA might wait for further indication that the petrol price declines are likely to persist for some time.
I think we will see petrol prices cheaper for an extended period. It is going to take a little while for the OPEC nations to drive out the more expensive oil mining operations in Russia and North America. The current crude oil price is below the profitable range for those producers but still above the break-even level for the Saudi producers.
The RBA will also be mindful that real GDP growth is well below trend and the labour market is weak.
The other factor they will consider is the downward movement in the exchange rate, which is driving slightly higher import price rises. This is not currently driving much movement in the overall CPI.
I suspect they will hold the rates constant at the February meeting while the wait for another month’s labour market data.
What is driving inflation in Australia?
The following bar chart compares the contributions to the quarterly change in the CPI for the December-quarter 2014 (blue bars) compared to the September-quarter 2014 (red bars).
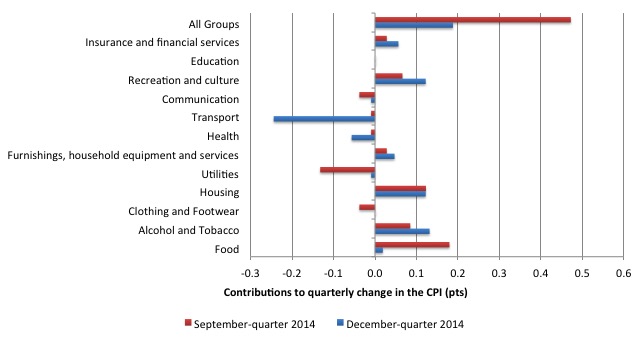
The ABS say that:
The most significant price rises this quarter were for domestic holiday travel and accommodation (+5.8 per cent), tobacco (+4.8 per cent) and new dwelling purchase by owner-occupiers (+1.1 per cent).
The most significant offsetting price falls this quarter were for automotive fuel (-6.8 per cent), audio, visual and computing equipment (-5.2 per cent) and audio, visual and computing media and services (-3.8 per cent).
The next bar chart provides shows the contributions in points to the annual inflation rate by the various components.
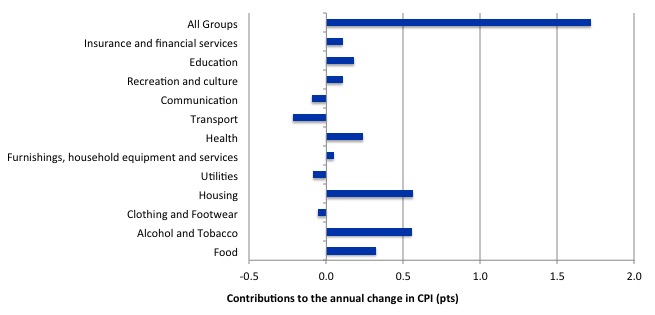
In the twelve months to June 2014, the major drivers of inflation were food, health, housing, and alcohol and tobacco prices. The tobacco and health price rises largely reflect government policy.
Inflation and Expected Inflation
The fear of inflation, in part, drives this mis-placed faith in monetary policy over fiscal policy.
If we went back to 2009 and examined all of the commentary from the so-called experts we would find an overwhelming emphasis on the so-called inflation risk arising from the fiscal stimulus. The predictions of rising inflation and interest rates dominated the policy discussions.
The fact is that there was no basis for those predictions in 2009 and five years later inflation is benign or falling other than where some cartel controls the supply-price.
Right around the world, these sort of predictions came to nought because they were made by people who didn’t really understand how the macroeconomy works.
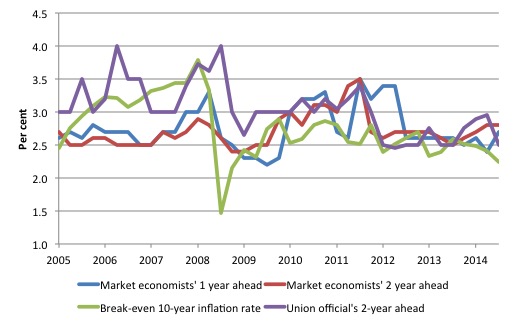
The following graph shows four measures of expected inflation expectations produced by the RBA – Inflation Expectations – G3 – from the June-quarter 2005 to the December-quarter 2014.
The four measures are:
1. Market economists’ inflation expectations – 1-year ahead.
2. Market economists’ inflation expectations – 2-year ahead – so what they think inflation will be in 2 years time.
3. Break-even 10-year inflation rate – The average annual inflation rate implied by the difference between 10-year nominal bond yield and 10-year inflation indexed bond yield. This is a measure of the market sentiment to inflation risk.
4. Union officials’ inflation expectations – 2-year ahead.
Notwithstanding the systematic errors in the forecasts, the price expectations (as measured by these series) are stable in Australia, which will influence a host of other nominal aggregates such as wage demands and price margins.
The market economists’ two-year ahead is well above the Break-even 10-year inflation rate while the Union officials seem to have a more realistic outlook.
Conclusion
Inflation in Australia is now trending downwards despite the occasional spike. On an annualised basis, inflation is now below the lower-bound of the RBA’s inflation targetting range.
The RBA-preferred measures are also trending downwards and are at the lower end of the inflation-targetting range.
While the oil price reductions have been significant, the downward trend was in place before the major reduction in energy prices.
The earlier trend was due to the subdued nature of the national economy and the excessively tight fiscal policy setting exacerbating moderating private spending.
Look out for my commentary on the ABC PM program tonight (Australian time).
That is enough for today!
(c) Copyright 2015 Bill Mitchell. All Rights Reserved.
It’s not just in Australia where inflation is trending down. It’s a worldwide phenomenon. See:
https://twitter.com/ReutersJamie/status/559827936509841410/photo/1
This tendency for inflation in different countries to move in unison was pronounced in the 1970s – to an extent that surprised me.
Capitalism has entered its final phase. This phase includes long-run (secular) stagnation, recession and then probably depression and deflation. Bill is right that secular stagnation need not occur now but it would take very different macro-economics and wise, dirigist decisions to prevent this course of events. Capitalism unfettered is not capable of making the necessary decisions and changes. While we have unfettered capitalism ruling the planet matters will only get worse. Neither will unfettered capitalism do anything significant to meet the challenges of resource limits and global warming.
Thus, capitalism will soon enter its final crisis. It suffers from both internal contradictions (a capital accumulation crisis and the crisis of worker impoverishment vs oligarchic super-wealth) and external contradictions with the natural world. In the latter case, capitalism’s endless growth model and its non-costing of negative externalities mean that the environment is destroyed to support capitalism. However, as the environment supports capitalism and indeed, any economic system, this is of course an unsustainable path.
I’m not so sure that the slowdown in China is deliberate as in do they,the government,have a choice.
China,like India,is a classic example of an unsustainable nation,let alone an economy.
We,Australia,are headed for a crunch.Deflation will likely be a part of that.
Our fearless (as in stupid) leaders can’t see that. How many Australian economists can see that? Probably no more than those who saw the last debacle approaching. You can count them on the fingers of one hand.
One only needs to read Peter Swan’s article in The Australian today to know we are doomed.
If that doesn’t dull your spirits, or worse, if it riles you into wasting your time preparing a lengthy rebuttal, just read the comments that follow. Simply ponder these thoughts of ‘Rob’ and consider how stuffed we are:
Debt forever, people. Debt forever!
Meursault,
When lies are systematically promulgated, there must be a section or class of people benefiting from those lies. This has always been the case in human history. The “one percent” benefit from the current lies extant in (bourgeois) economics. That’s why they promulgate them. And they find willing purveyors for these lies; both shills willing to lie for pay and credulous fools who spread the lies for free. But an economic system based on lies cannot function indefinitely. Sooner or later it will collide with reality. Yes, we are doomed to have that collision with reality. No, we are not totally doomed unless we leave matters far too late.
Mind you, humanity in time might be pushed to a point where a thawed Antarctica and lands inside Arctic Circle will be the only habitable places on earth. That is quite possible.