It's Wednesday and we have discussion on a few topics today. The first relates to…
Spanish labour market – not so dynamic
There was an article published by a Spanish research group (aligned with the University of Navarro) last week (March 14, 2015) – Spain’s Labor Market grows more dynamic – that reports on a special survey (150,000 respondents in 800 Spanish firms) which purports to show that the “labour mobility maintained its upward march to reach 18.8 per cent in the second half of 2014”. That is, within the sample “nearly one in five workers changed jobs during the period”. The results are unable to confirm whether the increased mobility is the result of better “efficiency” in matching workers to jobs or “higher job insecurity or staff turnover linked to lower retention rates and less training for short-term hires”. There is a world of difference between these alternatives. They also find that job creation rates are still low and falling and only 1.5 per cent higher than job destruction rates leading to the conclusion that “job creation remains tenuous”. I decided to look at another source of data which can shed light on the state of the Spanish labour market – the so-called Gross Flows data, which tracks quarterly movements (in Spain’s case) between the major labour force categories – employment, unemployment and inactivity. The results do not suggest that the Spanish labour market has improved much.
At the aggregate level, the Spanish labour market has not been performing very well despite a return to some growth.
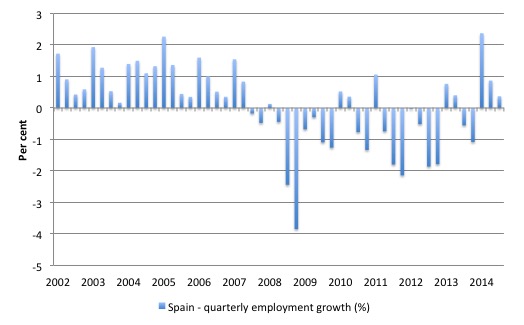
The following graph uses data from the – Instituto Nacional de Estadística – which is the National Statistics Office of Spain and shows quarterly employment growth from the March-quarter 2002 to the December-quarter 2014.
The impact of the financial crisis and subsequent policy austerity is clear.
Further, over the last 6 months of 2014, employment growth slowed again and was heading towards negative territory.
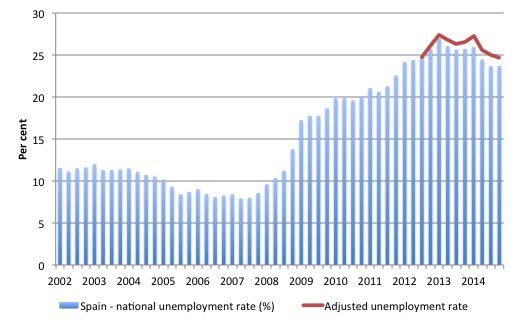
The next graph shows the evolution of the unemployment rate between 2002 and the December-quarter 2014 in blue bars.
The red line is the adjusted unemployment rate to take into account the fact that the participation rate has dropped significantly over 2014 as the unemployment rate fell.
In the September-quarter 2012, the labour force participation rate (proportion of working age population who were either employed or unemployed) was 60.6 per cent, which is low by international standards.
Since that time, the participation rate has fallen to 59.8 per cent, meaning less people are now in the labour force (unemployed or employed) than would have been the case if the participation rate had have remained at that 60.6 per cent peak.
An extra 300 thousand workers have dropped out of the labour force since the September-quarter 2012.
What would the unemployment rate be now if the participation rate had not dropped.
The red line answers that question. The December-quarter 2014 unemployment rate was 23.7 per cent. It would have been 24.7 per cent had the participation rate been at its September-quarter 2012 value of 60.6 per cent.
In other words, all the decline in the unemployment rate since the September-quarter 2012 (when the official unemployment rate was 24.8 per cent) has been due to the decline in the labour force (supply contraction) rather than stronger employment growth.
That is quite a different story that is typically peddled by those who are promoting Spain as an example of austerity that works!
That analysis is background but should warn you against believing in an Iberian miracle.
What do the gross flows data tell us?
You might like to read this blog from 2009 – What can the gross flows tell us? – which explains in some detail the concept and use of gross labour market flows data.
The Spanish Statistical Office (INES) publishes excellent – Statistics on the Flows of the Economically Active Population – up to the December-quarter 2014 (published on January 22, 2015).
They have – Earlier data from 1996 to 2012 – based on the 2001 Population benchmarks. The more recent data on updated benchmarks starts in the March-quarter 2005, which means we get a good view of what was happening before the crisis.
Gross flows analysis allows us to trace flows of workers between different labour market states (employment; unemployment; and non-participation) between months. So we can see the size of the flows in and out of the labour force more easily and into the respective labour force states (employment and unemployment).
Each period there are a large number of workers that flow between the labour market states – employment (E), unemployment (U) and not in the labour force (N). The stock measure of each state indicates the level at some point in time, while the flows measure the transitions between the states over two periods (for example, between two months).
National statisticians measure these flows in their monthly labour force surveys. The various stocks and flows are denoted as follows (single letters denote stocks, dual letters are flows between the stocks):
- E = employment, with subscript t = now, t+1 the next period
- U = unemployment
- N = not in the labour force
- EE = flow from employment to employment (that is, the number of people who were employed last period who remain employment this period)
- UU = flow of unemployment to unemployment (that is, the number of people who were unemployed last period who remain unemployed this period)
- NN = flow of those not in the labour force last period who remain in that state this period
- EU = flow from employment to unemployment
- EN = flow from employment to not in the labour force
- UE = flow from unemployment to employment
- UN = flow from unemployment to not in the labour force
- NE = flow from not in the labour force to employment
- NU = flow from not in the labour force to unemployment
The following Matrix Table provides a schematic description of the flows that can occur between the three labour force framework states.
Labour Market Flows Matrix

Transition Probabilities
The various inflows and outflows between the labour force categories are expressed in terms of numbers of persons (in thousands) which can then be converted into so-called transition probabilities – the probabilities that transitions (changes of state) occur.
We can then answer questions like:
1. What is the probability that a person who is unemployed now will enter employment next period?
2. What is the probabilituy that a person who is not in the labour force will enter employment in the next period or unemployment?
3. What is the probability of an employed person losing his/her job?
It is clear that answers to these questions provide vital information about the state of the labour market above that which can be obtained by a cursive examination of the above graphs.
To interpret the transition probabilities, we might, for example, find that the probability of an employed worker last period transitioning to unemployment this period is 0.05. This means that a worker who is currently employed has a 5 per cent chance of becoming unemployed in the next period. If this probability fell to 0.01 then we would say that the labour market is improving (only a 1 per cent chance of making this transition).
From the table above – sometimes called a Gross Flows Matrix – we can deduce the gross flows. For example, the element EE tells you how many people who were in employment in the previous month remain in employment in the current month and so on.
Similarly the element EU tells you how many people who were in employment in the previous month are now unemployed in the current month. And so on. This allows you to trace all inflows and outflows from a given state during the month in question.
The transition probabilities are computed by dividing the flow element in the matrix by the initial state. For example, if you want the probability of a worker remaining unemployed between the two months you would divide the flow (UU) by the initial stock of unemployment. If you wanted to compute the probability that a worker would make the transition from employment to unemployment you would divide the flow (EU) by the initial stock of employment. And so on.
So the 3 Labour Force states in the Matrix Table above allow us to compute 9 transition probabilities reflecting the inflows and outflows from each of the combinations.
Analysing movements in these probabilities over time provides a different insight into how the labour market is performing dynamically by way of flows of workers.
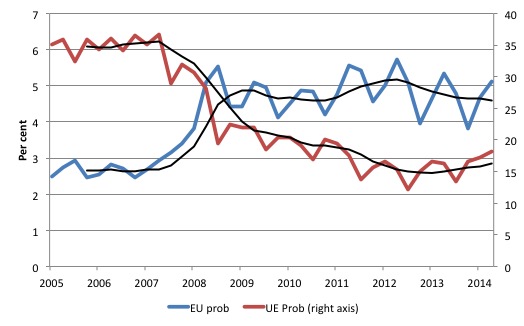
The next graph shows the transitions for EU and UE from the March-quarter 2005 to the December-quarter 2014. The probability of an employed worker losing their job (denoted ‘EU prob’ and not to be confused with the Gross Flow from employment to unemployment ‘EU’) is plotted on the left-hand axis (blue line).
The black smoother lines are 4-quarter moving averages to give you a better view of the underlying trend movement in the unadjusted data (gross flows data is very erratic).
The probability of an American (in general) losing their job if employed (blue line) rose sharply throughout 2008 and 2009 and finally peaked at 5.7 per cent in the December-quarter 2012. In the scheme of things, that sort of transition probability for EU transitions is very high. At its worst, the corresponding transition probability for the US was 2 per cent.
The likelihood of an employed person losing their job remains at 5.1 per cent and is still nowhere near the pre-crisis values.
One would conclude that there hasn’t been much improvement since the early days of the crisis from this view.
In the December-quarter 2007, the chance of an unemployed Spanish worker gaining employment (‘UE prob’) was 36.7 per cent. This probability fell to a low of 12.2 per cent in the March-quarter 2013 and remains at 18.3 per cent in the December-quarter 2014. Only modest improvement in other words.
This data tells us that the Spanish labour market is not proving to be very dynamic in terms of recovery. These crucial transitions are inertia prone and remain close to the crisis levels.
The next graph (or 9 separate graphs) shows all the Spanish labour market transition probabilities from the June-quarter 2005 to the December-quarter 2014 – the 9 transition probabilities are read downwards with a particular state (EE prob, EU prob, EN prob, UE prob, UU prob, UN prob, EN prob, UN prob, and NN prob). Note the vertical scales are different (they are optimised for the particular range of probabilities in each.
The black lines are 4-quarter moving averages, again, to depict the underlying trends.
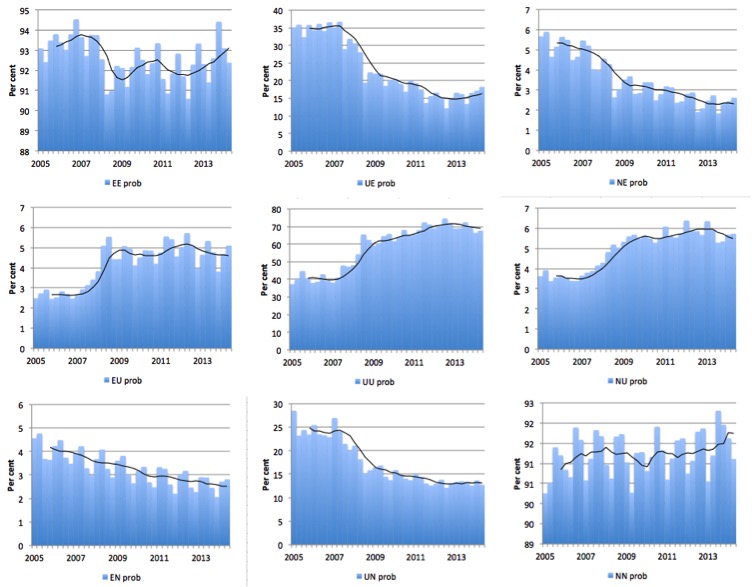
Several points by way of interpretation can be made (noting that care should be taken to recognise the vertical scales are quite different).
First, the data shows that the EE probability is now recovering – that is, the likelihood an employment person will remain employed in the next quarter (not necessarily with the same employer though) – is not far below its value before the crisis. That is a good sign.
Second, the EU probability (employment to unemployment) – see discussion above.
Further, the EN probability has fallen steadily during the crisis indicating that employed workers are now increasingly unlikely to flow out of the labour force once they lose their jobs. This is not a good sign.
Third, the likelihood of a new entrant getting a job (NE prob) plunged sharply during the crisis and remains at depressed levels. The dynamics appear to be that a new entrant is very unlikely to become employed and has to spend time unemployed before they have a chance at getting work. This is not a sign of a very dynamic labour market.
Fourth, the probability of an unemployed worker remaining unemployed (UU prob) remains very high (67.6 per cent in the December-quarter 2014) and has barely shifted since the escalation associated with the crisis. An unemployment worker is more than three times likely to remain that way rather than get a job (UE prob).
Fifth, unemployed workers are more likely to get a job (UE prob) that they are to exit the labour force (UN prob) – in the December-quarter 2014, these probabilities were 18.3 per cent and 12.7 per cent, respectively.
Conclusion
While there are those who want to talk up the Spanish economy, usually so they can conclude that austerity was good for growth prospects etc, the reality is quite different.
The Spanish gross labour flows data as at December 2014 continues to signal that the labour market is weak with some modest improvement. But the transition probabilities are still way out of kilter with respect to their pre-crisis levels.
There is nothing significant to celebrate in this data.
Did he or didn’t he?
The Greek-German tensions continued at the weekend when some footage from a 2013 presentation by the Greek Finance Minister (when he was a Professor of Economics) appeared.
The footage shows him – Flipping the Bird – as he states:
Greece should announce it is defaulting within the euro and stick the finger to Germany and say, well you can solve this problem yourself.
The Greek Finance Minister then issued a categorical – denial – on the German TV program he was appearing on via video link saying:
That video was doctored. I’ve never given the finger, I’ve never given the middle finger ever.
Earlier today, he tweeted what he called the “undoctored” version of the – video.
The bird gets flipped again in the undoctored version (at the 40 minute 30 second mark) and the oral segment is identical.
It is hard to see what has been doctored. The TV program claimed its “wonach verschiedene Medienexperten und Netzforensiker „keinerlei Hinweis auf eine Manipulation oder Fälschung” erkannt hätten und das Video deshalb als authentisch einstufen.” (Its experts found no evidence of tampering or forgery and concluded the video was genuine).
The popular German daily the Bild carried the headline next morning – Hat Varoufakis bei Jauch gelogen? (Did Varoufakis lie on Jauch” – Jauch being the TV program).
They also published another article – „Ich habe größte Zweifel, ob Varoufakis die Wahrheit sagt” – the headline being a quote from the TV show presenter which says “I have serious doubts that Varoufakis told the truth”.
The conference organisers from 2013 wrote a Facebook explanation that there were “two fingers” involved – so it wasn’t technically The Bird and that the Greek Finance Minister was aiming those two middle fingers at the German government rather than the German people.
Okay! But the Finance Minister did speak in the singular (“the finger”) in his presentation, both the so-called “doctored” and genuine versions.
He might have got a bit twitchy and a second middle finger sort of appeared to be part of the deal but WTF!
Quite a storm – in a teacup I should say.
I am not a politician or diplomat, but I would not be backing away from the sentiment expressed in the video, which was in relation to the Greek surrender-monkey government agreeing to the terms forced on them by the Troika in the bailout packages.
The only difference is that I would have referred to the Troika rather than Germany given that it was “The Institutions” that has continued to give the Bird to the millions of unemployed in Greece.
Why deny that? Why not shout it out as loud as you can as often as you can with as many supporting hand gestures as are required to get the message across?
That is enough for today!
(c) Copyright 2015 William Mitchell. All Rights Reserved.
Universidad de Navarra=Opus Dei=hyperconservative.
Let me give you my opinion on the job market based on a conversation with my cousin yesterday. She is “working” for a company that manages social media. Basically 3/4 of her salary is paid by one client, at her own risk, 1/4 is paid by her boss although she dedicates more time to her boss’s other projects. So in the first place the labor law reforms enables fraud at a massive scale. Her contract is terminated at the begining of the summer so she gets no paid vacation. Her salary is pitiful. She is not making any major contributions to the social security so if she is fired or falls sick she will get at best a meager pension or unemployment benefit. Let’s forget about gaining the right to a retirement pension.
She is not alone, this is the lot afforded to her generation. The job market in Spain right now is crap and basically the “brave” reforms mean that long-term contracts are being replace by short-term, part-time (but that doesn’t mean that you work the number of hours you are hired to work) lower paid contracts. This is no way of building a society based on reciprocity. It is also a dumb way of building a skilled workforce (let alone loyal).
But you cannot blame the businesses. They are struggling for lack of demand and access to credit. If they are given the chance to hire people at conditions close to slavery they will also take advantage of that. Also, since a lot of companies are strapped for cash they cannot pay salaries. My spouse is owed six months of salary now, for example.
The whole thing is racket. This is the balance of Mr. Rajoy’s reforms.
From Spain thanks prof. Mitchell for your analysis of our ominous labour market . About Stuart´s commentary I want to clarity one matter : blaming ONLY Rajoy is not fair because he is continuing Zapatero´s work ( former president ) who made the social security reform and the labour reform on 2010 that Stuart mention… and Zapatero was the leader of the socialist and workers party!!!
I agree with Jorge Amar: ZP was the first one to cave in to neoliberal blackmail. Remember the Tritchet letter. I have a post on that: (http://chartalismo.blogspot.com.es/2014/09/el-vertigo-que-podiamos-habernos.html). Going back in time we could also put the blame on Felipe González. Nonetheless, the PM is now Rajoy: that foolish solemnizer of the obvious and spokesperson for conventional wisdom.
Add also that the Socialist party has had a wishy-washy ideology or no ideology at all other than “the solution is more Europe”.
In one interview Mr. Varoufakis described himself as an MMT-fellow traveler. Too bad he had never reached the MMT destination. Too bad for Greece too.
Bill
Great blog.
Have you ever done calculations similar to this post for the U.S.?
would love to see them… My thought is that maybe ten million here are unemployed or under employed on account of too little spending/too little cash in people’s pockets. And I’ve seen charts that show it is prime age workers that are dropping out, not so much those of retirement age.
Would you comment on the relative merit of an employer of last resort policy vs. block grants to those municipalities for infrastructure, triggered when the unemployment rate of the municipality rises above some tbd value?
Also, do you know why mosler’s blog is not responding?
Thanks, john
Also interesting read, in this case about the paradox of flexibility in the Greek labour market: https://rwer.wordpress.com/2015/03/18/greece-and-the-paradox-of-flexibility-two-graphs/