For years, those who want selective access to government spending benefits (like the military-industrial complex…
Employment growth in the UK but of dubious quality
I am always amused when conservative politicians make claims like they created so many thousands or millions of jobs while in government. Typically, in Opposition they will claim that governments do not create any jobs, which justifies them introducing pro-business policies and imposing austerity. That ‘free market’ position soon changes when they are trying to take credit for growth. With an election in the offing in the United Kingdom, the Prime Minister is demonstrating one of these shifts in causality. He told the BBC in an interview (March 30, 2015) – Election 2015: Cameron pledges ‘1,000 jobs a day’ if re-elected – that his government had “created a thousand jobs a day” and would continue to do so if re-elected. But there is clearly more to this claim that a 1000 net jobs per day.
David Cameron told the – BBC Breakfast program – that:
Over the last five years we’ve created a thousand jobs a day, and we commit to continuing that record because we’re going to continue supporting business and industry, continuing to make our country an attractive one to invest in and so we believe we can create those thousand jobs.
The data supports the conclusion that the UK economy has created in net terms around a 1000 jobs every day since the Conservative government was elected.
Of course, many thousands more jobs have been created and destroyed each day in Britain over the period in question. The 1000 jobs a day is just a net figure.
He clearly didn’t think the government was responsible for job creation while in Opposition.
On May 2, 2010, as part of the General Election campaign, the UK Conservative Party leader, now Prime Minister launched the – Contracts for Jobs – strategy.
In the Launch Speech, the British Prime Minister David Cameron said:
And nowhere is that more true than our economy because you all know as business people it”s not Governments that create jobs it is businesses that create jobs.
So government’s do not create jobs! So where have those 1000 net jobs a day come from!
In Australia, the Federal Treasurer (Joe Hockey) regularly makes the same claim, and like the British Prime Minister, his understanding of job creation seems to depend on whether he is in opposition or government.
As Opposition Treasury Shadow he told the ABC – Lateline program on March 4, 2009 that the then Prime Minister (Kevin Rudd):
Kevin Rudd doesn’t understand government doesn’t create jobs, business creates jobs. And if you undermine business confidence, if you undermine consumer confidence, they’re not going to continue to employ people.
Seems clear enough!
Again, while still in opposition, Joe Hockey was interviewed on a TV program (Sunrise) with the actual Treasurer at the time – see Transcript.
There was interchange about the fiscal stimulus packages that the then Government had introduced:
TREASURER: You voted it down in the Senate and you went around and said it wouldn’t create jobs, and we’ve created 500,000 jobs in Australia since the last election.
HOCKEY: Well business creates jobs, governments don’t create jobs.
TREASURER: You went on this program Joe and said that it wouldn’t create jobs. You said it was all about jobs, jobs, jobs and you said our stimulus package wouldn’t create jobs. You said it on this very program.
HOCKEY: And business creates jobs. I stand by that.
And in the leadup to the last Federal election, which his party won he told the press that:
No. I want to see economic growth continue to rise, not continue to fall, as it is at the moment. From my perspective, it is business that creates jobs.
Okay. Any questions? It is clear – he thinks business creates jobs not government.
Then the Liberals were elected to government (September 2013) and Hockey became the Federal Treasurer (much to our loss). As unemployment continued to rise because they maintained the austerity bias in fiscal policy and the private sector contracted as the mining sector declined, the popularity of the government plummetted and they now risk being a one-term government.
What about job creation?
Well it seems that causality has changed.
Last month, the Treasurer gave an – Interview to the Sydney radio station 2GB (February 5, 2015).
He told the journalist in question:
Now, at the same time that we are trying to reduce our expenditure and grow the economy, we are trying to create more jobs, and last year – last year under the Abbott Government, we created 600 new jobs everyday, which was three times the speed of the previous year under Labor.
Hmm, now government is creating jobs, on a daily basis.
The UK facts
Governments and private businesses both create jobs because they both spend. Spending creates a demand for goods and services, which requires labour and other productive resources to produce. In doing that, the spending not only creates employment but also incomes.
The basic macroeconomic process doesn’t discriminate between public and private spending. A dollar spent is a dollar earned.
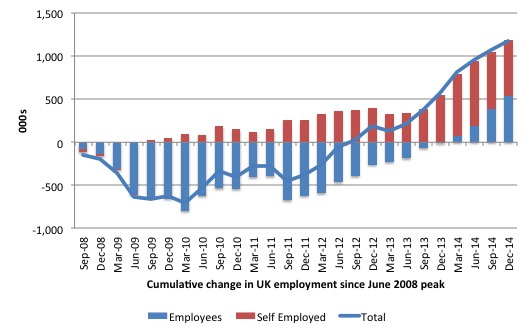
The following graph shows the cumulative change (in 000s) in employment in the UK since the peak in June-quarter 2008. The blue bars are total employees, the red bars are total self employed, and the line is the sum of the two (with minor discrepancies due to the fact that ONS includes Unpaid family workers and those on Government supported training and employment programmes among the total).
Total employment is 1,174 thousand higher than it was at the previous peak before the crisis (June-quarter 2008). 46 per cent of the increase has been among those classified as employees and 54 per cent have been self-employed jobs.
Have we any information about the self-employed? ONS last published their – Self-employed workers in the UK – 2014 – on August 20, 2014.
They noted that:
1. Self-employment was at the highest point in 40 years.
2. At that time, the “Rise in total employment since 2008 predominantly among the self-employed”. In the period since then, that conclusion should be moderated but not altered qualitatively.
3. “Self-employed workers tend to be older than employees and are more likely to work higher (over 45) or lower (8 or less) hours”
4. Men dominate this type of work.
5. “The most common roles are working in construction and taxi driving and in recent years there have been increases in management consultants”.
6. “Average income from self-employment fallen by 22% since 2008/09”.
The top 3 job roles for the self-employed are carpenters and joiners, building trades, and taxi drivers.
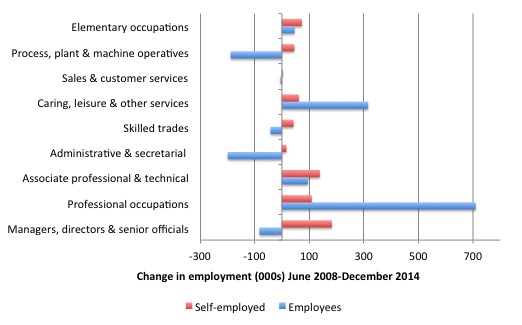
The ONS break the labour force data down into occupations.
The following graph shows the total change in employment by type (employees and self-employed) since the June-quarter 2008 (to the December-quarter 2014).
The largest rises in self-employment have been in the skilled professional, technical and managerial occupations.
ONS also say that the self-employment data might be biased by respondent selectivity – “Due to the nature of self-employment many people manage their own business and will state they are are in a managerial role despite the level of responsibility they have”.
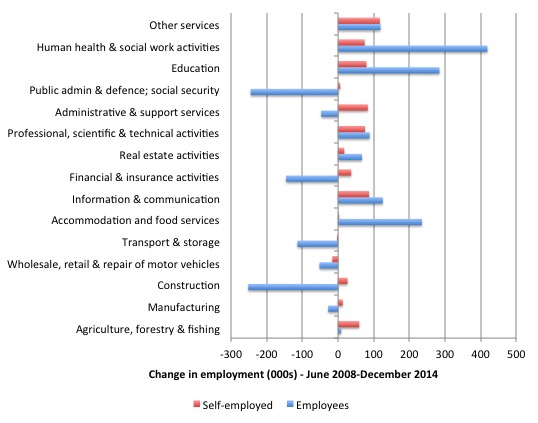
In terms of industry, the following graph shows the total change in employment by type (employees and self-employed) since the June-quarter 2008 (to the December-quarter 2014). Mining is excluded because there were no self-employed working in that sector.
Total employee work has fallen in the ‘production’ sectors (Manufacturing, Construction) and risen in the services area (mostly in Accommodation and food services, Education, and Human health & social work activities).
The self-employed are also creating work for themselves in the services sectors.
Clearly the rise in self-employment is linked to the dearth of jobs being offered to employees both during the downturn and over the period of the Conservative tenure since May 2010.
The ONS say that the “the rise in self-employment is predominately down to fewer people leaving self- employment than in the past” which is consistent with the view that lack of alternatives force people to maintain their incomes by working for themselves.
ONS also found that real incomes have been falling (by 22 per cent) for the self-employed since 2008/09.
So the quality of total work created since the GFC in the UK is dubious.
The other point to note is that while the total jobs (employed or self-employed) tell one story, lying beneath those trends is the phenomenon of zero hour contracts.
You can find out about these contracts in this ONS document – Analysis of Employee Contracts that do not Guarantee a Minimum Number of Hours.
These are jobs that “do not guarantee a minimum number of hours”. But you should read the document to see that the definition is difficult to apply in a survey sense and there are conflicting estimates from the Labour Force survey of individuals and the Business Survey of firms.
On February 25, 2015, the British Office of National Statistics released the latest information on – Contracts with No Guaranteed Hours, Zero Hour Contracts, 2014.
The evidence is clear from the UK.
ONS tell us that of the:
1.8 million contracts that did not guarantee a minimum number of hours where work was carried out in the fortnight beginning 11 August 2014 … 11% of businesses make some use of NGHCs … half of businesses with employment of 250 or more make some use of NGHCs compared with 10% of businesses with employment less than 20.
The larger firms (250 employment or more) dominate the use of NGHCs in the UK.
This would appear to contradict the appeals used by employers to justify the erosion of working standards that small businesses are the engine of jobs growth and need increased flexibility to do their thing.
A person on a zero hours contract works on average “25 hours per week” and around 33 per cent want more hours of work – meaning they are underemployed.
The proportion of zero-hour contract workers underemployed is higher than those in regular employment.
Further, zero-hour contracts accounted for around “2.3 per cent of people in employment” in the December-quarter 2014 and this constituted a rise from 1.9 per cent (although there is uncertainty as to what caused the rise).
The largest category of zero-hour contracts are those who have been in them for less than 12 months.
Most of the zero-hour contracts were in the Accommodation and Food sector and the Education sector.
Interestingly, while there were “1.8 million contracts where work was carried out, there were also 1.4 million contracts where no work was carried out.” The latter category arose for a number of reasons, among them “fluctuating demand” for employers, “no-one had accepted the work”.
ONS tell us that “women make up a bigger proportion of those reporting working on “zero-hours contracts” (55%)”.
The workers are either young or old and 17 per cent only combine work with full-time education.
I considered other aspects of the performance of the British economy in this recent blog – Lacklustre British economy all down to Conservative incompetence.
Conclusion
Overall, I just wanted to come to terms with the detail underpinning the British labour force data today and the comments by the Prime Minister prompted me to do that.
The reality is that the only thing going for the Conservatives at present is the rising employment although clearly the quality of that employment is doubtful.
There are now many ex-employees who are working in insecure self-employed or zero-hour contract jobs. Their incomes are variable and over the last 6 years have declined in real terms on average.
They face serious disadvantage in terms of access to housing mortgages and the difficulty they have managing their lives when they are not sure about how many hours they will work in any given week.
This makes managing family responsibilities such as child care, school holidays and the like nearly impossible.
I would not want to be taking credit for what has emerged in the UK since the GFC. But then there is not much else that the Conservatives can point to, is there?
In general, they reneged on their major promises of austerity because they realised the economy was going to go back into recession.
So the fact that there has been any growth contradicts their major mantra that austerity has been responsible.
No, sustained fiscal deficits have generated this employment growth and the poor quality of the growth is because the deficits have been insufficient.
That is enough for today!
(c) Copyright 2015 William Mitchell. All Rights Reserved.
My calculations from the Q4 national accounts show that the only sector that has increased its ‘debt to GDP’ ratio is the government sector.
So clearly the government sector is doing one thing (propping up activity and encouraging deleveraging) while promising to do another (impose austerity and slash public jobs).
Obviously these are aggregate numbers and hide a multitude of inequality sins.
Bill,
The latest wheeze in the building trade is to use a payroll company to pay workers as selfemployed even though they signed up to work for the building company! The payroll company then charge the worker for their services and even deduct employer as well as employee national insurance – HMG is now “reviewing” this loophole since it became public knowledge.
Dubious indeed.
One only has to look at George Monbiot’s column today “Kleptoremuneration” to see what a mess we are in.
Dear John Doyle,
George Monbiot referred to a study of psychopathy in business and elsewhere. Unfortunately, this study is inherently flawed. While the flaws in the study do not dicredit anything he says, they make the results of the study less than reliable. Monbiot uses the term sociopathy, which is appropriate in the context he is referring to. This mental state is to be distingusihed by what I would call true psychopathy. I distinguish between the two in the following way.
We first have to see this psychiatric condition as a syndrome, that is, comprised of a set of traits, and not as itself a trait. Some of these are excessive narcissism, lack of empathy, lack of remorse, no conscience, lack of insight into thier own behavior, extreme manipulativeness for its own sake and for short-term goals, &c. Some of these traits are more prominent in some psychopaths than others. Now, we can define two ways in which this behavior disorder can be manifested. In what I would term a true psychopath, the traits defining the disorder are exhibited in every situation and with everone with whom the individual interacts, and generally has its origins in early life. A sociopath, on the other hand, exhibits psychopathic traits only in certain situations or only when playing certain social roles, like at work. One could argue that the differences between them are a matter of degree. One thing that may distinguish the true psychopath from the sociopath is that during most of their lives, due to their lack of insight and their excessive narcissism, true psychopaths are immune to treatment, while a sociopath may be treatable.
Of course, when you have to deal with such people, it really doesn’t matter whether you are dealing with a sociopath or a true psychopath. The consequences for the victim are the same. Terrible. In the short term, there are only two remedies, either the victim exits the situation permanently or the socio/psychopath is sacked or side-lined. It used to be the case that such individuals were either sacked or side-lined on the grounds that they didn’t work well with others (in the absence of a diagnosis of psychopathy). Unfortunately, the former is often difficult and the latter unlikely in today’s economic climate.
Better sources of insight into psychopathic behavior than the flawed study to which Monbiot refers can be found here: https://psychopathyawareness.wordpress.com/2011/10/03/the-list-of-psychopathy-symptoms/, based on the work of Hervey Cleckley and Robert Hare, and summarizes the symptomatology, and Cleckley’s own book (5th Ed.), The Mask of Sanity – http://www.quantumfuture.net/store/sanity_1.PdF. Hare’s work is based on Cleckley’s pioneering studies.
As an adjunct here’s another piece on underusing people’s productivity:
http://fistfulofeuros.net/afoe/a-little-model-of-the-labour-market/#comments
Dear John Doyle,
There is a new study (Aug 2014) out on corporate psychopaths that has Babiak and Hare as two of its co-authors. I do not have access to this, PubMed, but in case you may, this is the abstract of the study. It involves a new measure of psychopathy. The standard test, the Hare Psychopathy CheckList-Revised, is intended primarily for physically violent offenders but can be used in other settings and has been, successfully. Nevertheless, this is an attempt at a more accurate assessemnt of psychopathic behavior in corporate settings. Hare noticed some time ago that corporations have been becoming more psychopath-friendly.
Corporate Psychopathy and the Full-Range Leadership Model
Cynthia Mathieu1
Craig Neumann2
Paul Babiak3
Robert D. Hare4
1Universite du Quebec a Trois-Rivieres, Trois-Rivières, Quebec, Canada
2University of North Texas, Denton, TX, USA
3Anubis-Research, Hopewell Junction, NY, USA
4University of British Columbia, and Darkstone Research Group, Vancouver, British Columbia, Canada
Cynthia Mathieu, Business Department, Universite du Quebec a Trois-Rivieres, C.P. 500, Trois-Rivieres, Quebec, Canada G9A 5H7. Email: cynthia.mathieu@uqtr.ca
Abstract
The B-Scan 360 is a relatively new, purpose-built measure of corporate psychopathy that addresses many of the issues inherent in studying psychopathy in organizations. The primary goal of the present study was to measure the relationship between employees’ perception of psychopathic features in their supervisor and their rating of their supervisor on the Full-Range Model of Leadership. The second goal of the study was to test the B-Scan 360’s factor structure and test its interrater reliability in an organizational sample. A total of 491 civic employees and 116 employees from a branch of a large financial company completed the B-Scan 360 as well as the Multifactor Leadership Questionnaire on their direct supervisor. The B-Scan 360 and all of its four factors were positively correlated with passive leadership (Laissez-Faire leadership) and negatively correlated with positive leadership (both Transactional and Transformational leadership). Furthermore, results revealed the same four-factor structure and good interrater reliability for the B-Scan 360 in this business sample as previously reported for a general population. Overall, the results provide additional support for the B-Scan 360 as a measure of psychopathic traits in corporate settings.
“””6. “Average income from self-employment fallen by 22% since 2008/09″.”””
I have formed a very negative about the part time self employed ‘evolution’ of work. Its a biased opinion reflected in aggregate statistics and in observations of life in Australia and Europe.
The move to self-employment for commodity jobs is the new phase in the neo-liberal process. By ‘commodity’ i mean jobs that exist in areas where a vibrant economy would have otherwise given the person a choice to be employed doing said activity.
(The opposite of a commodity job by this definition would be setting up ones own business venture into creating a new product/service where one cannot find an employer).
Take your employment into your own hands and become your own boss is the upsell.
It absolves business of ethical concerns over minimum wage, retirement funds, working conditions and facilities if it can just hire a pipeline of self employed on ‘take it or leave it’ contracts (it partitions the grouping of human units down to individuals and removes collectivism). For self employed there are tax breaks, discounted training courses to manage business but in the end low aggregate demand and low disposable income are what thwarts the process over and over again.