For years, those who want selective access to government spending benefits (like the military-industrial complex…
The slowest recovery in modern history just slowed down again
The British Office of National Statistics released the data – Gross Domestic Product Preliminary Estimate, Quarter 1 (Jan to Mar) 2015 – yesterday, which should tell the British voters that the Conservative government has failed. There is no political spin that is capable of changing that conclusion. With a general election next week in Britain, the real GDP figures (and related data – productivity, real wages, per capita income etc) should spell the end of the Conservatives. Especially, given their plans for the next few years. But then the British people have as an alternative the Labour Party which has proposed more or less the same thing except they will be “fairer”. Pigs might fly! Britain is continuing to demonstrate that fiscal austerity is bad for economic growth and that on-going deficits are good.
I have recently analysed aspects of the failure of current macroeconomic policy in the UK. Please read the following blogs:
1. Employment growth in the UK but of dubious quality
2. Wage rises are required – real wages must grow in line with productivity
3. British fiscal statement – continues the lie about austerity
4. Lacklustre British economy all down to Conservative incompetence
Yesterday’s data release consolidates the assessment of policy failure. Not only has the Conservative government been unable to meet its ‘fiscal targets’ (which is a good thing given the original plan was going to destroy the capacity of the economy to deliver any semblance of prosperity for the majority of the population) but now growth is in decline.
When that happens, employment growth slows and unemployment starts to rise.
The only thing that will prevent a major rise in unemployment is the appallingly low productivity growth. But, that reality locks the British workers into a race to the bottom when it comes to real wages growth.
None of that has any silver lining.
We should always be careful of so-called ‘preliminary estimates’. The ONS says that “At this stage, data content is less than half of the total required for the final output estimate. The estimate is subject to revision as more data become available, but these revisions are typically small between the preliminary and third estimates of GDP.”
I would not expect much revision given the historical record of these changes.
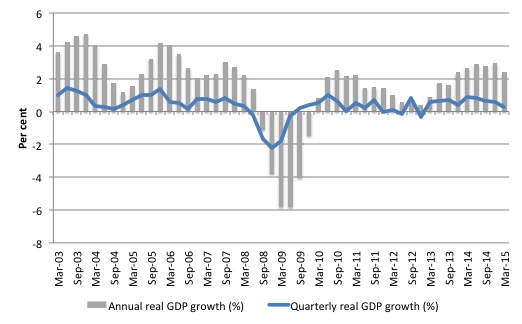
The first graph shows the quarterly and annual real GDP growth in the UK since the March-quarter 2003 to the March-quarter 2015.
The patterns are now well-known.
The pre-crisis credit binge driving strong growth, followed by the GFC crash, and then the fiscal-led recovery from the previous Labour Government.
In May 2010, the Conservative government came to power and imposed fiscal austerity. David Blanchflower noted in his recent UK Guardian article (April 28, 2015) – Now it’s official: voters are hurting, no matter how George Osborne spins it – that the Conservatives were “implementing his politically rather than economically motivated austerity”.
The ideological experiment killed growth and Britain slumped back into recession as a consequence.
Mindful of their diminishing political stocks, the Conservatives changed direction and allowed the fiscal deficit to rise again to support growth – effectively abandoning the harsh austerity.
This is not to say that they didn’t attack certain disadvantaged groups and other worthy targets via spending cuts. They certainly did that. But overall, the deficit remained fairly large and that maintained enough stimulus to get the economy moving again.
But in recent quarters that support has been waning and the hoped for export-boom has failed and the UK economy is back in decline mode with all sectors other than services in contraction.
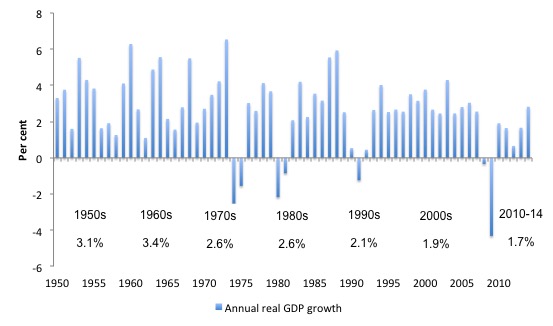
To put that era in perspective given that it represented a different macroeconomic policy paradigm (neo-liberalism) from the earlier Keynesian era, the following graph shows average annual real GDP growth since 1948.
The numbers corresponding to the decades (1950s etc) are the average growth rates for the periods. The last entry is from 2010 to 2014.
The pattern shown is similar for most advanced nations. The Post World War II period initially spawned high real GDP growth rates with strong productivity growth and real wages growth. National government fiscal deficits were the norm and supported strong private spending and saving patterns.
That all came to an end once Monetarism antagonism to fiscal activism took hold in the 1970s and deregulation was pursued, first with large-scale privatisation, then attacks on the unions, and then full-scale financial market and labour market changes.
The growth performance of the economy started to slide (as did productivity growth). As the neo-liberal policy mentality firmed in more recent decades growth took a further step downwards and politicians claim success at growth rates that are nearly 50 per cent below what was the norm during the Keynesian period.
The period since 2010 in the UK has been a relative disaster in this sense.
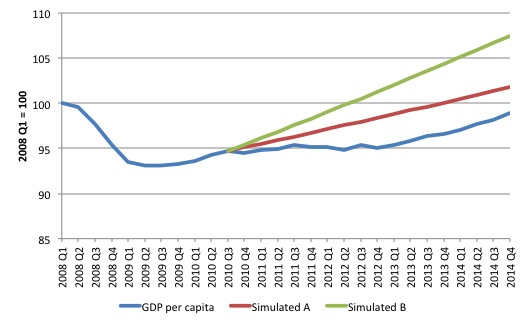
The following graph shows GDP per capita (per head), which is “calculated by dividing GDP in chained volume measures by the latest population estimates and projections” since the peak GDP March-quarter 2008. After 6 years, per capita GDP is still 1.1 per cent below the previous peak.
British people on average are poorer.
I simulated two alternative scenarios based on what was happening period to the Conservatives taking office. The fiscal stimulus that British Labour introduced to combat the GFC clearly led to a recovery in 2009 in per capita income which was gathering pace in 2010 just before the Tories were elected.
Simulated A is an extrapolation of what would have happened to GDP per capita had the rate of growth continued at its third-quarter 2010 level. It was already starting to slow by then in the wake of the first Tory fiscal contraction announced in its June Fiscal Statement.
Simulated B extrapolates based on the June-quarter growth which the Tories inherited (and proceeded to undermine).
Had the fiscal stimulus been allowed to continue, per capita GDP might have followed the green line (Simulated B) which would have regained the peak levels by the third-quarter 2012. British people would have been much better off now had that scenario unfolded.
David Blanchflower notes that given “GDP per head in the UK still remains below its starting level. The voters are hurting”.
He likened this to Greece:
Remember Cameron, Osborne and Clegg’s demonstrably untrue claims at the time of the 2010 general election, that the economy was bankrupt and comparable to Greece’s? Well, if that was the case then, surely we are even more like Greece now.
His claim is also as demonstrably untrue as was the nonsense put out by the Tory Coalition leaders and the Chancellor.
The UK is a currency-issuing government and has total discretion over its net spending (althoug its total net spending is determined by a combination of its decisions and the spending and saving decisions taken by the non-government sector.
Britain is choosing to move back towards recession and it will get worse unless the new government realises that the deficit is too small at present relative to the spending coming from the external sector (a negative impact) and the private domestic sector (overburdened with debt).
The likelihood of British Labour doing something positive is low given that it is raving on about a “Budget Responsibility Lock”. Please read my blog – A “Budget Responsibility Lock” – a ridiculous proposal – for more discussion on this point.
David Cameron’s response was that:
Our economy is growing; growing at a rate that many other European countries frankly would give their eye teeth for.
The neo-liberal era has seen the benchmarks proposed by politicians (and economists) as being reasonable plunge to the ridiculous.
I would never compare a nation’s performance with those of the Eurozone, where the elites have masterminded a mindblowing morass of stagnation.
Europe is a socio-economic disgrace.
In many European countries, people are giving up their “teeth” because austerity has cut dental services and people can no longer afford to access adequate dental health care.
I thought the comments of the head of the Trades Union Congress reported in the UK Guardian were the most apposite:
The slowest recovery in modern history just slowed down again … This is bad news for jobs and living standards. What’s more, Conservative plans for extreme cuts after the election risk completely killing off this faltering recovery and plunging the economy back into even deeper trouble.
The makers are marching backwards, construction is slumping and it’s only services that have rescued the economy from shrinking. This is the opposite of the rebalanced economy we were promised.
Please read my blog – The March of the Makers – out! – for more discussion on the failed export strategy.
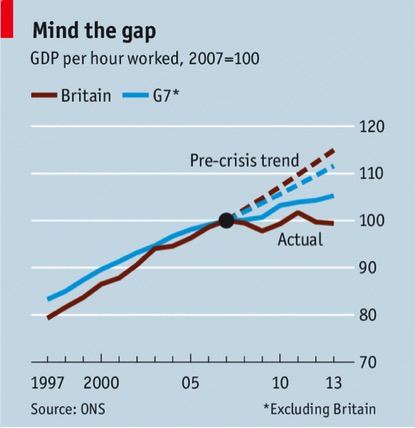
The following graph appeared in the Economist Magazine and shows what has been happened with G7 productivity.
This is am amazing failure. Weak real GDP and a host of junk jobs masquerading as employment growth delivers shocking productivity growth.
Remember, that, ultimately, growth in real living standards require growth in productivity.
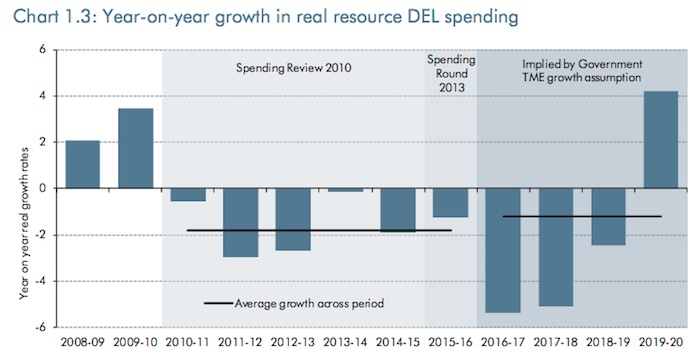
And the real GDP slowdown should be seen in the context of what the Conservatives have planned over the next three fiscal years.
While the recent fiscal statement (aka Budget) delivered by the Chancellor did not propose any major cuts in the current fiscal year (election oblige!), readers (and UK voters) should familiarise themselves with Chart 1.3 and the discussion in Paragraph 1.38 (Page 16) of the – Economic and fiscal outlook – March 2015 – published by the British Office of Budget Responsibility on March 18, 2015.
I reproduce the graph here.
It shows the proposed year-on-year growth in Departmental Expenditure Limits (DEL) over the next five fiscal years (to 2019-20). TME is Total Managed Expenditure
What do you think will happen in 2016-17 and 2017-18 to real GDP growth and the labour market if the government actually enforced those cuts?
Answer: major recession.
Why is there a “sharp turnaround in 2019-20”? Answer: election year.
The OBR say that:
… the implied cuts in 2016-17 and 2017-18 are a key reason why the Government is on course to achieve its new fiscal mandate to balance the cyclically adjusted current budget in 2017-18 with room to spare.
Regular readers will understand that it is highly likely that the “implied cuts” will defeat the government’s ambitions for a zero fiscal balance just as their cuts in 2010 and 2011 forced the deficit up because the economy faltered under the spending constraint.
In a related document published by the HM Treasury Department in March 2015 – An alternative fiscal path beyond 2016-17 – we learn that:
The impact on real GDP of fiscal policy changes in later years is likely to be fully offset by monetary policy, although there is some inevitable uncertainty about when full offsetting would become the case.
In other words, they are claiming that the Bank of England will adjust interest rates down to stimulate growth as fiscal contraction proceeds, at a pace in 2016-17.
The HM Treasury acknowledge that “changes in the path of government spending will affect the composition of real GDP and the level of the GDP deflator” but “For simplicity, the Treasury has not modelled these effects”.
They just assume that monetary policy will offset the 3.6 per cent of GDP contraction in Time Managed Expenditure as tax revenue rises by 0.8 per cent of GDP over the period to 2019-20.
Conclusion
With a general election next week in Britain, the real GDP figures (and related data – productivity, real wages, per capita income etc) should spell the end of the Conservatives. Especially, given their plans for the next few years.
But then the British people have as an alternative the Labour Party which has proposed more or less the same thing except they will be “fairer”. Yeh, right.
I doubt that the top-end-of-town will be joining the unemployment queues under Labour and losing real income.
Bad choice ahead for the British. Why? The nation is obsessed with neo-liberalism. Until that changes, no fresh air will breeze through.
Indonesia – a murdering state
We knew what Indonesia was like when it slaughtered more than two hundred thousand innocent people at Dili.
Last night, the Indonesian state murdered two Australians and several others of varying nationalities.
It was sad news.
Australian’s should stop taking holidays there and all official cooperation (military etc) between Australia and Indonesia should be abandoned.
That is enough for today!
(c) Copyright 2015 William Mitchell. All Rights Reserved.
Re: the two Australians murdered:
https://newmatilda.com/2015/04/29/blood-their-hands-secret-government-treaties-helped-kill-chan-and-sukumaran
The Labour manifesto has Balls’ fingerprints all over it. I have been told that his own constituents are unhappy with him, so, hopefully, he may lose his seat. He was catapulted into what was considered a safe seat by the Labour executive, to the consternation of the constituents of the area, who happened to be quite happy with the Labour MP they had.
As for the Brown-Darling fiscal stimulus program, Keegan, in his book, The Economic Experiment of Mr Osborne, contends that Darling and Brown fell out because Darling wanted to introduce fiscal restraint faster than Brown thought advisable. However, instead of entering into negotiations with Darling about this, Brown tried to have him ousted. (I should point out that Keegan is a fan of Brown.)
If what Keegan says is true, then we have to view Brown as right and Darling wrong in this case. However, the manner in which Brown dealt with the situation is indicative of what a number of political commentators believe to be a personality disorder that Brown suffers from. This and the arrogance of Mandelson and Balls is what fundamentally led to the failure of a coalition of Labour with the LibDems after the previous election.
As for the LibDems, the Cleggster is even more enthusiastic about the budget balancing and related issues than the Tories. He has said that economics bores him, so it is likely that he merely repeats what he is told to say about economic issues rather than think for himself. This doesn’t look good for a LibDem-Lab coalition, which a number of people want to see. Vince Cable, the only economically experienced LibDem person in the Cabinet, appears also to suffer from a case of Neoliberalitis. And he appears to be the obvious alternative choice for Chancellor to replace Balls should a LibDem-Lab coalition become a possibility.
Bill, I think you might be being a little unfair to Blanchflower re his Greece comment. I think he is merely putting forward what he considers to be an absurd hypothetical counterfactual and using it to try to show Osborne’s policies as more absurd than they might otherwise appear to be. Whether this is a sensible way to attack Osborne is another matter. I admit I had to read the sentences twice. So, his strategy isn’t very transparent.
Everybody talks about deficit spending.
But as MMT points out, money is a form of debt. Some debts are called money, while not all debts are called money. Therefore, if we were pedantic we would call it ‘spending by issuing money’.
http://www.3spoken.co.uk/2015/04/uk-sectoral-balances-q4-2014.html?m=0
According to this graph by blogger Neil Wilson, in Q4 2014 the private sector net dissaved as deficit slipped behind trade deficit/CAD.
If the deficit just stays as it was in Q4 2014 the private sector will continue to net dissave, but it has got worse (“better”/”lower”, worse actually.) And assuming no oil price increases. But it won’t as politicians want it cut.
The only reason the UK economy looks good at all is austerity in Europe and Japan after sales tax increase.
I think we need to take notice of the elephants in the room. These include the end of growth as a mantra for successful economies. Anyone seeing the 1972 standard graph included in the Club of Rome’s “Limits to Growth”
should be aware that so far the 40 years since then has mirrored the chart lines very closely. Then there is the seminal lectures by the late Prof Al Bartlett on the exponential function. It means MMT must now address the limits to growth and develop strategies to manage the inevitable decline. Our civilization is uncontestedly going to crash, and very likely is already well under way.
The way present governments are doing this via austerity policies is an unintended consequence but we need to draft ways to mange the problem, or it will manage us!
@JOHN
The same people behind the club of Rome are the people behind the current austerity project.
You are mixing up cause and effect.
The primary problem in capitalistic countries today and yesterday is the false demand signal.
If we look at Ireland before the european project and after we can see major devastation of the landscape which is similar in scale to the previous deforestation of Tudor capitalistism.
today we now have endless green laws but a devastated landscape.
Hint the laws are not meant to solve the stated problem, their ultimate objective is simply to sustain the scarcity engine so therefore the satanic mill will express itself in some fashion on the landscape.
The people behind the curtain instigate the creation of useless activity that we are forced to engage in so as to search for purchasing power and then have the nerve to tax us for this same activity.
The goal as always is to maintain concentration.
The fashion at the moment is trendy rather then real green issues, yesterday it was the size of your windows or the number of chimneys.
Don’t be fooled by these bastards.
They talk of international humanitarism when these people are clearly not humanists.
They talk of Green issues when they burn a vast amount of Kerosene managing their estates and field hands.
These people are much like cistercians pretending to be Franciscans
A darkly farcical situation if ever there was one.
Of course like most things today green scientific debate is pure horseshit ultimetly designed to provide a income stream for the connected capitalists.
To Hepion,
Money is not a form of debt. MMT (Wray, actually) gets that wrong.
Way wrong.
Money is money. Debt is debt.
You use ‘money’ to settle your ‘debt’.
How can they BE the same?
Today our modern monetary economies privately ISSUE all their money AS a debt contract(c.e.), making the MMT money-nature error situationally true, but scientifically, off the wall.
The US issued currency (Greenbacks) not as a debt, but as equity.
ALL of that currency stayed in existence and served as money for longer than the (private) FRBS has been in existence.
IF that’s true, and it is, then how can money BE debt?
But to your point, spending by issuing money is the mirror image of the issue that should be on the table.
‘Issuing money by spending’, as public equity, is the reform that has been called for ever since the days of the Greenbacks by progressive politics and economics.
And still today.
For the Money System Common.
Thanks.
Oh for goodness sakes help me!
I was wondering about these matters, austerity can’t work and such, and arrived here from a link on the Guardian website.
The article resonates very powerfully for me but I really can’t say I understand it all properly or know how to cross check the arguments and assertions.
Can anyone suggest a ‘Economics for Dummies’ primer that can take me from first principles?
Thanks in advance. And thanks for the article.