Today (February 21, 2023), the Australian Bureau of Statistics released the latest - Wage Price…
Australian wages growth – lowest on record
The day after the Australian government published their fiscal strategy for 2015-16, which assumes (unrealistically) a significant upstep in economic growth and hence taxation receipts, the Australian Bureau of Statistics published the latest – Wage Price Index, Australia – for the March-quarter today and we learn that the annual growth in wages is now at the lowest level since the data series began in the December-quarter 1997. Last quarter, we learned the same thing. In other words, consecutive quarterly lows have now been set in the Wage Price time series measure. The annual hourly wage inflation is now down to 2.3 per cent overall down from 2.5 per cent in the December-quarter. Private sector wages growth was a miserable 2.2 per cent. In the 2015-16 fiscal statement, the Government had assumed wages growth for 2014-15 would be 2.5 per cent rising to 2.75 by 2017. On current trends, that is highly unlikely to occur, which means the arithmetic surrounding its fiscal outcomes is awry already and the fiscal deficit will be larger than assumed. Overall productivity growth is running around 1.8 to 2.1 per cent (depending how one measures it) and despite the decline in the annual inflation rate in recent quarters as the overall economy slows down (and oil prices fall), Real Unit Labour Costs (RULC) continue to fall. This means that the gap between real wages growth and productivity growth continues to widen as more the wage share in national income falls (and the profit share rises). The flat wages trend will not only blast the forward estimates in the fiscal statement out of the water but the on-going redistribution of national income to profits is intensifying the pre-crisis dynamics, which saw private sector credit rather than real wages drive growth. The lessons have not been learned.
The wage series is the quarterly ABS Wage Price Index published by the ABS. The Non-farm labour productivity per hour series is derived from the quarterly National Accounts.
A compact dataset can be downloaded from the RBA Table H2 Labour Costs and Productivity. I extrapolated the average growth over the last five years to get the March-quarter productivity result, given the national accounts data is not released until early June.
Nominal wage and price inflation
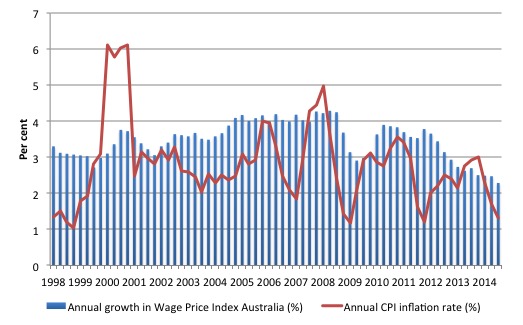
The first graph shows the overall annual growth in the Wage Price Index since the September-quarter 1998 (this series was first published in the September-quarter 1997).
I also superimposed the annual inflation rate (Consumer price index) – the red line. The bars above the red line indicate real wages growth and below the opposite.
The big funny-looking jump in 2001 was the introduction of the Goods and Services Tax which created a once-off adjustment in the level of the CPI.
So after falling for three quarters, then steadying, the real wage has grown modestly in the last two quarters – at an annual rate of 0.8 per cent (December-quarter 2014) and 1 per cent (March-quarter 2015).
However, if we were to use the inflation measures that the RBA prefers (trimmed mean and weighted median), which expunge short-term volatile or transitory price factors, then real wages would have remained stable (using trimmed mean) or fallen (weighted median) in the March-quarter 2015.
Overall, not a particularly strong result, whichever way we measure the price deflator (inflation).
But as we will see later, any real wages growth remains well under the productivity growth rate, which means that the redistribution of national income towards profits is on-going.
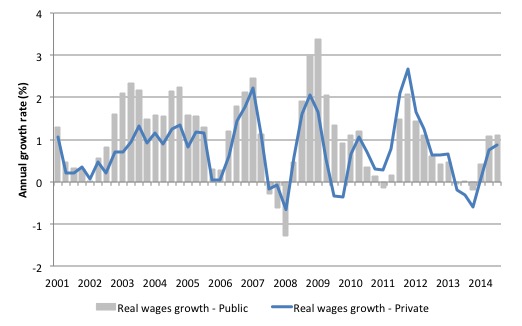
Real wages growth subdued in March-quarter
The following graph shows the annual growth in real wages from the first-quarter 2001 to the December_quarter 2014 (I cut out the GST effect).
After a few quarters of hard real wage cutting, the private sector returned to positive real wages growth but at very subdued rates.
The rise in real wages in 2012 into 2013 was the result of the strong growth encourage by the fiscal stimulus. The declining profile after that is associated with the end of the mining investment boom exacerbated by the obsessive fiscal austerity that was introduced (too early).
Workers not sharing in productivity growth
One of the salient features of the neo-liberal era has been the on-going redistribution of national income to profits away from wages. This feature is present in many nations.
This has occurred because real wages growth has lagged behind productivity growth and the extra real income produced as been expropriated by capital.
The suppression of real wages growth has been a deliberate strategy of business firms, exploiting the entrenched unemployment and rising underemployment over the last two or three decades.
The aspirations of capital have been aided and abetted by a sequence of ‘pro-business’ governments who have introduced harsh industrial relations legislation to reduce the trade unions’ ability to achieve wage gains for their members. The casualisation of the labour market has also contributed to the suppression.
That redistribution of national income to profits continues in Australia.
I consider the implications of that dynamic in this blog – The origins of the economic crisis. As you will see, I argue that without fundamental change in the way governments approach wage determination, the world economies will remain prone to crises.
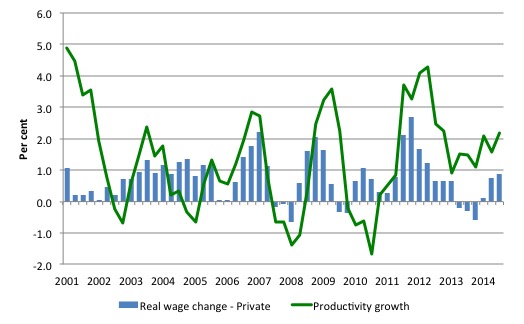
The next graph shows the annual hourly real wage change for the private sector (blue bars) and the annual hourly productivity growth (green line) since the March-quarter 2001.
Productivity growth has been relatively strong in recent quarters, which is one reason why employment growth is so flat. For each extra dollar of real output, less workers are needed when productivity growth rises.
Historically (for periods which data is available), rising productivity growth wass shared out to workers in the form of improvements in real living standards. Higher rates of spending then spawn new activity, which soaks up the workers lost to the productivity growth.
The neo-liberal period marked a shift in that relationship as we discuss below.
Clearly, since the September-quarter 2011, the payoff to workers from the positive productivity growth has been absent with real wages growth lagging productivity growth.
In recent quarters, the gap has been large.
Real wages and productivity growth – a massive redistribution to profits
To understand the significance of the gap between real wages growth and labour productivity growth the following points should be noted:
- Employment is measured in persons (averaged over the period).
- Labour productivity is the units of output per person employment per period (in this case per hour).
- The wage and price level are in nominal units; the real wage is the wage level divided by the price level and tells us the real purchasing power of that nominal wage level.
- The total economy-wide wage bill is employment times the wage level and is the total labour costs in production for each period.
- Real GDP is thus employment times labour productivity and represents a flow of actual output per period; Nominal GDP is Real GDP at market value – that is, multiplied by the price level. So real GDP can grow while nominal GDP can fall if the price level is deflating and productivity growth and/or employment growth is positive.
- The wage share in national income (GDP) is the share of total wages in nominal GDP and is thus a guide to the distribution of national income between wages and profits.
- Unit labour costs are in nominal terms and are calculated as total labour costs divided by nominal GDP. So they tell you what each unit of output is costing in labour outlays.
- Real unit labour costs are calculated by dividing Unit labour costs by the price level to give a real measure of what each unit of output is costing. RULC is also the ratio of the real wage to labour productivity and through algebra I would be able to show you that it is equivalent to the Wage share measure.
From the last point, if real wages growth is above productivity growth then RULC are rising, which is the same thing as saying that national income is being redistributed to wages (workers).
However, if real wages growth is below productivity growth then RULC are falling, which is the same thing as saying that national income is being redistributed away from wages (workers) to profits (capital).
It can get a little more complicated if the share that government claims changes but that is normally stable, which means the dynamics of national income distribution are between wages and profits.
From the last graph, we can see that RULC have been falling and national income has been redistributed towards profits since September-quarter 2011.
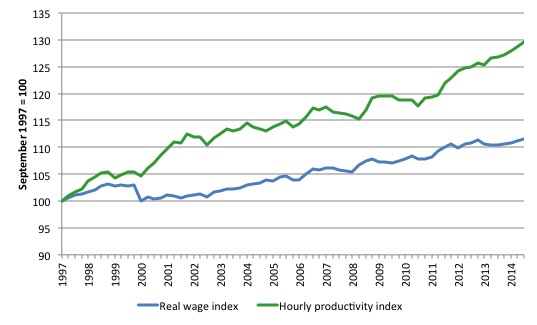
The following graph shows the indexed growth in hourly real wages and labour productivity per hour since the September-quarter 1997 (the start of the Wage Price Index series).
If I started the index in the early 1980s, when the gap between the two really started to open up, the productivity index would stand at around 180 and the real wage index at around 115.
Starting the index in the September-quarter 1997 produces a smaller gap, which just goes to show that one can manipulate data to achieve a range of ends (often quite contrasting) by altering the sample size.
What is clear is that since the September-quarter 1997, real wages have grown by only 11.5 per cent (so just over 0.6 per cent on average per year), whereas hourly labour productivity has grown by 29.5 per cent (or 1.7 per cent on average per year).
This is a massive redistribution of national income to profits and away from wage-earners and the gap is widening each quarter.
The gap widened further in the March quarter 2015.
Where does the real income that the workers lose by being unable to gain real wages growth in line with productivity growth go? Answer: Mostly to profits. One might then claim that investment will be stimulated.
At the onset of the GFC (December-quarter 2007), the Investment ratio (percentage of private investment in productive capital to GDP) was 23.8 per cent.
It peaked at 24.3 per cent in the June-quarter 2013. But in recent quarters as the gap between real wages growth and productivity growth widens, the Investment ratio has fallen and in the December-quarter 2014 it stood at 22.3 per cent.
The downward shift in the non-mining investment ratio is more stark than that.
Some of the redistributed national income has gone into paying the massive and obscene executive salaries that we occassionally get wind of.
Some will be retained by firms and invested in financial markets fuelling the speculative bubbles around the world.
For workers, the problem is that they rely on real wages growth to fund consumption growth and without it they borrow or the economy goes into recession. The former is what happened around the world in the lead up to the crisis (and caused the crisis).
The latter is more or less what is happening now.
One of the essential changes that needs to happen to ensure that another bout of financial instability doesn’t hit soon is that real wages have to grow in proportion with productivity growth – exactly the reverse of what is happening now.
Real wages growth and employment
I read several commentaries yesterday on the ABS data release, which claimed that the suppresssion of real wages growth would stimulate employment growth – the old (flawed) canard.
Firms will not employ new labour, no matter how cheap it becomes, if they cannot sell the extra goods and services that would be produced.
The claim that real wage cuts or growth retardation is necessary to stimulate employment is never borne out by the evidence. Wages have two aspects.
First, they add to unit costs, although by how much is moot, given that there is strong evidence that higher wages motivate higher productivity, which offsets the impact of the wage rises on unit costs.
Second, they add to income and consumption expenditure is directly related to the income that workers receive.
So it is not obvious that higher real wages undermine total spending in the economy. Employment growth is a direct function of spending and cutting real wages will only increase employment if you can argue (and show) that it increases spending and reduces the desire to save.
There is no evidence to suggest that would be the case.
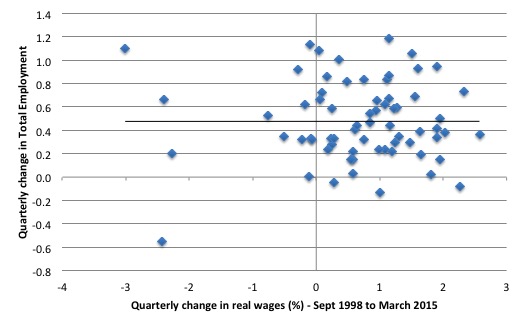
The following graph shows the quarterly growth in real wages (horizontal axis) and the quarterly change in total employment. The period is the September-quarter 1998 to the March-quarter 2015. The solid line is a simple linear regression.
Conclusion: No discernible direct relationship! There is strong evidence that both employment growth and real wages growth respond positively to total spending growth and increasing economic activity.
At present, total spending in the economy is subdued and moderating.
Conclusion
Nominal wages growth is now at the lowest level since the data series began (September-quarter 1997).
Depending on how we measure inflation, real wages growth is slightly negative or slightly positive at present.
The slow wages growth is a cause and reflection of the slow growth in overall economic activity and employment. Workers are adopting a much more cautious approach to spending and firms will not lift the investment rate while sales are flagging.
The on-going subdued economic activity will also undermine the Government’s fiscal strategy, which can be summarised as squeezing net public spending out of the economy in the hope that in three years they will achieve a fiscal surplus.
That folly will be exposed. Economic growth will not be strong enough to match their assumptions and that means the growth in tax receipts will be less than assumed.
This is a very damaging fiscal strategy. It would be better for the Government to stimulate the economy more now with larger fiscal deficits and then see the fiscal balance drop on the back of income growth.
Higher (and more reasonable) wages growth would both benefit from and provide support to such a fiscal strategy.
At the moment, we are in a race-to-the-bottom, which is nowhere any reasonable policy strategy should aim for.
That is enough for today!
(c) Copyright 2015 Bill Mitchell. All Rights Reserved.
Bill said: One of the essential changes that needs to happen to ensure that another bout of financial instability doesn’t hit soon is that real wages have to grow in proportion with productivity growth – exactly the reverse of what is happening now.
For each mining job lost 3 jobs must be created in Retail or Tourism to replace it due to the size of mining pay packets. The problem is disguised by the short term growth in residential construction jobs that are about double Retail and Tourism wages. Unfortunately as soon as a residential project is finished the jobs are gone. The increase in job creation in non mining construction is only temporary. When we get done building places to live in we will have a terrible problem finding jobs for this group of workers. So I cant see how wage increases will keep pace with inflation or productivity. Winter is coming to pay packets and Government receipts and the response will be to cut back Government spending. We don’t live in intelligent times. That goes for all of us. Cheers Punchy
Today Madam speaker refused a question from Bowen, asking how slow wage growth affects the budget. Was ruled out of order because it was hypothetical.
“redistribution of national income to profits away from wages. ”
And from both to land and other monopolies.
“stimulate the economy more now with larger fiscal deficits and then see the fiscal balance drop on the back of income growth.”
Ah but then there would not be a “debt crisis.”
“When we get done building places to live in we will have a terrible problem finding jobs for this group of workers.”
Nope. See JG.
Unfortunately we cannot see the facts from 1970. That would paint a totally different picture. From a low earner viewpoint, Small and medium business have a lot to answer for.
Cash payments (for wages) off the books, removes the figures from stats. With a changing society comes people who want to import their own old employment practices. Below min wage payments, employing the non employable(illegally) omitting the tax payments and compulsory superannuation.
These practices are rife in western Sydney where the low income migrant does not understand the system.
In the end, everyone looses.