Today (March 6, 2024), the Australian Bureau of Statistics released the latest - Australian National…
Australian National Accounts – the fragility of growth increases
The – March-quarter 2015 National Accounts data – released by the Australian Bureau of Statistics today confirms that the Australian economy was stuck in a weak growth state in the last three months of 2014. Real GDP growth grew by by a 0.9 per cent in the March-quarter 2015. The annual growth rate of 2.3 per cent down from 2.5 per cent in the December-quarter, and still well below trend. But the March-quarter result is stronger than the last 3 quarters. One should not be optimistic about the future though. Australia is now firmly caught up in what we call an ‘income recession’ where the total market value of goods and services (GDP) is outpacing the flow that Australian residents enjoy as income. Real net national disposable income fell by 0.2 per cent over the last year. While private consumption growth remained positive, it is not being driven by wages growth (which have fallen overall in the last year). Rather, the savings ratio fell and indebtedness in on the increase – signs of trends that ultimately led to the GFC> Further, despite corporate profits rising, private investment growth was negative. With the fiscal position now leaning towards austerity, today’s data paints a fairly uncertain picture for the Australian economy for the remainder of this year. Now is not the time for fiscal retrenchment. With real GDP growth well below that needed to reduce unemployment and underemployment, the government needs to stimulate the economy to boost income and employment growth. This would also allow wages to grow and take the squeeze off households.
The main features of the National Accounts release for the March-quarter 2015 were (seasonally adjusted):
- Real GDP increased by 0.9 per cent after recording a 0.5 per cent increase in the December-quarter.
- The main positive contributors to expenditure were Net exports (0.5 percentage points) and Final consumption expenditure (0.4 percentage points).
- The main negative factors were the decline Total gross fixed capital formation (-0.3 percentage points).
- Our Terms of Trade (seasonally adjusted) fell by 2.9 per cent in the quarter and over the last 12 months they have fallen by a substantial 11.4 per cent.
- Real net national disposable income, which is a broader measure of change in national economic well-being rose by 0.2 per cent for the quarter but fell by -0.2 per cent for the 12 months to the March-quarter 2015, which means that Australians are worse off (on average) than in March 2014.
Overall growth picture – trend improvement
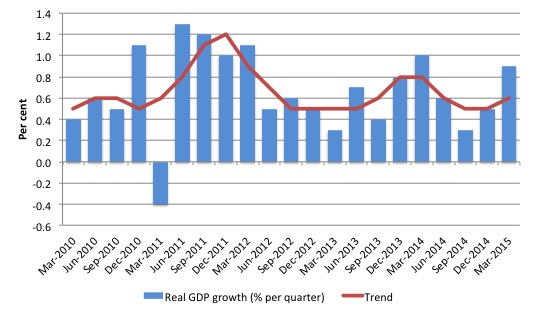
The following graph shows the quarterly percentage growth in real GDP over the last five years to the March-quarter 2015 (blue columns) and the ABS trend series (red line) superimposed. After the decline in trend growth was arrested by the fiscal stimulus in 2008-09 the decline in government support saw the dip in trend growth in 2010.
Initially, the growth in private investment associated with the record terms of trade and the resulting mining boom helped drive the new rise in trend growth which ended towards the end of 2013, notwithstanding the strong net exports in the March-quarter 2014.
The mining boom was thought to be in two stages. First, the investment boom as new productive infrastructure was being constructed (railways, ports, loaders, new sites etc). Second, the export boom that would result from the enlarged productive capacity. The second stage relied on continued growth in China to boost volumes and the prices remaining stable (at elevated levels).
The problem is that China is now slowing a little but more troubling for the economy as a whole is that there is now a serious glut of mineral exports to China (iron ore etc) and the excess supply is driving prices down significantly.
Australia’s terms of trade have fallen sharply (11.4 per cent) in the last year.
However, export volumes are up and import spending is fairly subdued, which means that net exports contributed 0.5 percentage points to the 0.9 per cent quarterly growth result.
Piecing together other information, one soon realises that this situation cannot continue for long. The data I analysed in the first part of yesterday’s blog – Time to end the human rights atrocity in Gaza – showed the overall decline in wages
The overall assessment is that the Australian economy is now growing well below trend and with terms of trade expected to fall further and the fiscal position expected to become tighter, the outlook is for weaker growth still.
Domestic wages growth is non-existent and consumers are reducing their saving out of disposable income to maintain consumption growth. Private household indebtedness is also rising.
That dynamic is a limited horizon. Eventually, the flat incomes and rising indebtedness will force households back into retreat and private consumption growth will stall. Then things will look decidedly bleak.
Further, while the fiscal austerity built into the May 2015 Fiscal Statement will be moderated by the hostile Senate, which is already signalling it will reject some of the proposed cutbacks, there is clearly a need for a boost in the public contribution to growth (see below). The politics do not seem to favour such a shift in policy at present.
Analysis of Expenditure Components
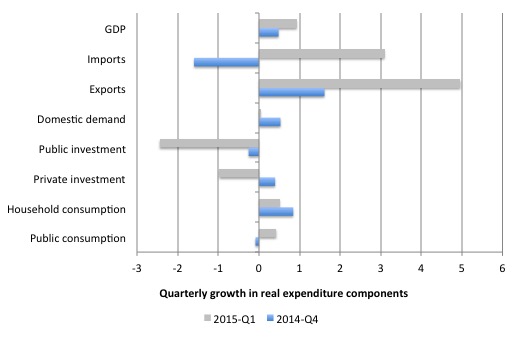
To reinforce the message that the results signal a fragile future, the following graph shows the quarterly percentage growth for the major expenditure components in real terms for the March-quarter 2015 (grey bars) and the December-quarter 2014 (blue bars).
Capacity building (both public and private) is in retreat and household consumption growth weakened in the current quarter.
Taken together, Domestic demand grew by 0.04 per cent only in the March-quarter 2015.
The economy is now relying almost exclusively on private debt expansion with flat wages and the external sector and then, the outcome, is well below trend. That is not a robust position to be in.
Contributions to growth
What components of expenditure added to and subtracted from real GDP growth in the March-quarter 2015?
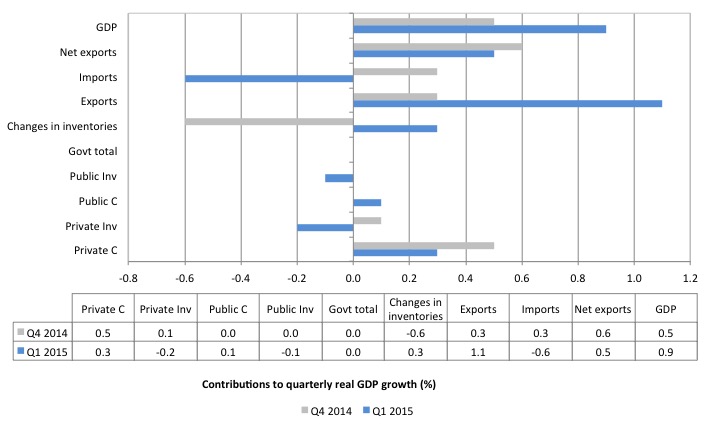
The following bar graph shows the contributions to real GDP growth (in percentage points) for the main expenditure categories. It compares the March-quarter 2015 contributions (blue bars) with the December-quarter 2014 (grey bars).
The strongest contributor to growth in the March-quarter 2015 was net exports, with export volumes up considerably.
The net exports contribution to growth in the March-quarter (0.5 percentage points) is the combination of a rise in real exports (contributing 1.1 percentage points) being offset by imports (contributing 0.6 percentage points).
The overall contribution of private investment on growth was negative (-0.2 percentage points), which confirms that the investment cycle associated with the mining boom is over and non-mining investment is not picking up the slack.
The contribution of public investment was negative in the March-quarter 2015 (-0.1 points) while there was a modest growth contribution from public consumption spending (0.1 points).
Thus the overall contribution of the government to growth was neutral (0.0 percentage points).
The contribution of Private consumption in the March-quarter was 0.3 percentage points down from 0.5 percentage points in the December-quarter 2014.
Note also that inventories contributed 0.3 points to growth in the March-quarter. It is always hard to interpret quarterly shifts in inventories. Are retailers building stock because they are being overwhelmed with orders or are they unintentionally accumulating inventory as actual spending falls below their expectations.
It is likely to be the latter given that real private consumption growth has fallen to its lowest level since the June-quarter 2013 and is being driven by declining saving and rising indebtedness rather than increasing real wages growth.
Firms will adjust to any unintended inventory accumulation by cutting production (and we will see whether that is the case in the next national accounts release (early September).
A further reason why caution is needed, despite the strong net exports contribution is that private investment fell by around 1 per cent in the March-quarter 2015, and will not improve if private consumption falls and fiscal austerity impacts.
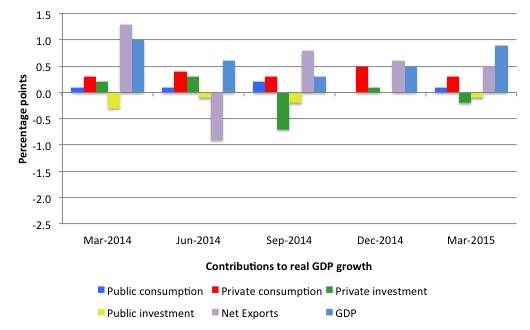
The next graph shows the contributions to real GDP growth of the major expenditure aggregates since March-quarter 2014 (in percentage points). The total real GDP growth (in per cent) is also included as a reference.
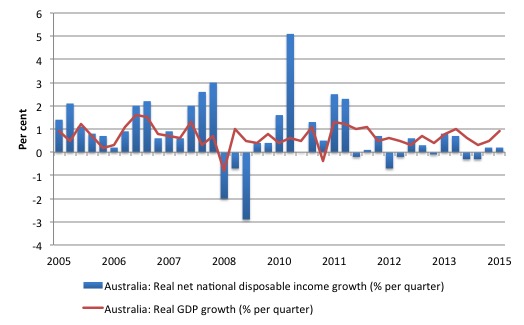
Real GDP growth positive but real net national disposable income negative
The ABS tell us that:
A broader measure of change in national economic well-being is Real net national disposable income. This measure adjusts the volume measure of GDP for the Terms of trade effect, Real net incomes from overseas and Consumption of fixed capital.
While real GDP growth (that is, total output produced in volume terms) was stronger this quarter, real net national disposable income growth was barely positive (0.2 per cent) and has been criss-crossing the zero line for the last three or so years.
Over the last year, real net national disposable income has declined by 0.2 per cent – a “national income recession”.
The following graph shows the evolution of the quarterly growth rates for the two series since the March-quarter 2005. You can see the divergence between real growth in output (and income that is generated by the economy) and the real net national disposable income (the real income Australians get) over the last few years.
So while the economy is pumping out mining exports at increasing volumes, Australian households are going backwards in real income terms.
This subdued state is the result of the declining export prices manifesting in the significant decline over the last 12 months in Australia’s terms of trade and the flat wages situation.
In other words, we are exporting volume but getting less for it, which means our capacity (in real terms) to purchase imports has declined per unit of export.
It means that Australians overall are poorer even though we are still producing more than 6 months ago and exporting increasing volumes of real goods and services to the rest of the world.
This discrepancy is one reason why an export-led growth strategy will not necessarily increase the standard of living of domestic residents, even if it exports grow.
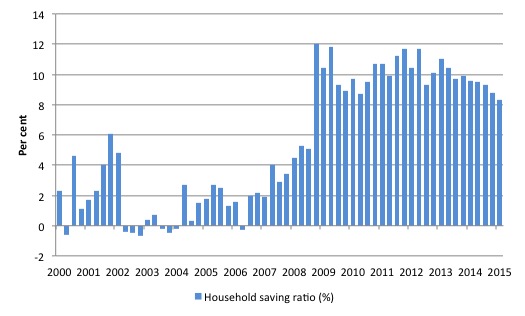
Household saving ratio falls to 8.3 per cent
The squeeze on wages in Australia is manifesting in two ways. Rising indebtedness and fall saving out of disposable income.
The following graph shows the household saving ratio (% of disposable income) from 2000 to the current period. The household sector is now behaving very differently since the GFC rendered its balance sheet very precarious.
Prior to the crisis, households maintained very robust spending (including housing) by accumulating record levels of debt. As the crisis hit, it was only because the central bank reduced interest rates quickly, that there were not mass bankruptcies.
In June 2012, the ratio was 11.7 per cent. Since the September-quarter 2013, it has been steadily falling as the squeze on wages has intensified.
The household saving ratio was 8.3 per cent of disposable household income in the March-quarter 2015 and down from the 8.8 per cent in the previous quarter.
The downward trend tells us that household consumption growth is being maintained by a reduction in saving and a rise in credit access – both worrying trends.
While the recent trend is downwards, it is unlikely that households will return to the very low and negative saving ratios at the height of the credit binge given that the household sector is now carrying record levels of debt.
At some point, household consumption growth will fall.
This also means that government surpluses which were associated with the credit binge, and only were made possible are untenable in this new (old) climate. The Government needs to learn about these macroeconomic connections. It will learn the hard way once net exports weaken.
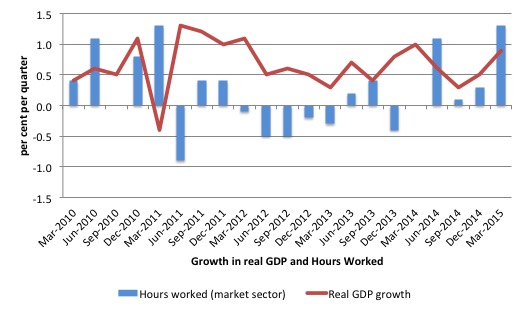
Real GDP growth and hours worked
One of the puzzles over the last several years or so has been the sharp dislocation between what is happening in the labour market and what the National Accounts data has been telling us.
Employment growth and hours worked has been virtually flat over the period while annual real GDP growth has been between 2 to 2.5 per cent.
Today’s data shows that real GDP growth was driven by a sharp rise in hours worked on the back of a sharp decline in \ productivity growth. Workers are working more hours but producing less per hour. Again not a good sign.
The following graph presents quarterly growth rates in trend GDP and hours worked using the National Accounts data for the last five years to the March-quarter 2015.
You can see the major dislocation between the two measures that appeared in the middle of 2011 persisted throughout 2013 but is less evident now.
Just in case you think the labour force data is suspect, the hours worked computed from that data is very similar to that computed from the National Accounts.
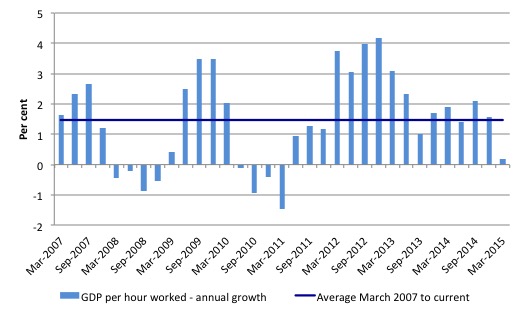
To see the above graph from a different perspective, the next graph shows the annual growth in GDP per hour worked (so a measure of labour productivity) from the March-quarter 2007 quarter to the March-quarter 2015. The horizontal blue line is the average annual growth since March-quarter 2007.
The relatively strong growth in labour productivity in 2012 and the mostly above average growth in 2013 and 2014 helps explain why employment growth has been lagging given the real GDP growth. Growth in labour productivity means that for each output level less labour is required.
In the March-quarter 2015, annualised labour productivity growth was only 0.2 per cent (well below the recent average).
Over the last year, labour force growth has average about 1.8 per cent, while productivity growth has averaged around 1.3 per cent. This means that real GDP has to growth by at least 3.2 per cent before the unemployment rate will start to fall.
The relatively poor real GDP growth is one reason why the unemployment rate has been rising over the last two years or so.
The poor productivity growth in the March-quarter 2015 also helps to explain why the rise in the unemployment rate has stalled recently.
Conclusion
Today’s National Accounts data indicates that economic growth was stronger than expected in the March-quarter 2015, but the annual rate of growth is still well below trend, which explains why unemployment has been rising over the last 12 months
The main contributor was net exports, Domestic demand was weak and with flat to negative wages outlook and persistently high unemployment, the outlook is not that positive.
Private consumption growth remained positive and contributed to growth, but it is falling and being funded by a declining saving ratio and rising indebtedness. Neither trend is sustainable.
The negative growth in private and public investment means that potential output in Australia and future growth rates will be lower than otherwise. Again, not a positive sign.
That is enough for today!
(c) Copyright 2015 Bill Mitchell. All Rights Reserved.
http://uk.businessinsider.com/r-germanys-schaeuble-offers-varoufakis-chocolate-euros-for-his-nerves-2015-5?r=US
Bill, have you seen this?
Greece needs real Euros, not chocolate Euros. 😉
Bill,
You have missed the most important part of the accounts.
Nominal GDP increased 1.2% in the year to March. The average since 1998 is 6%!
We live in the nominal economy not the real economy.