It's Wednesday, and as usual I scout around various issues that I have been thinking…
Long-term unemployment behaviour reflects austerity bias in Eurozone
The Economist Magazine, never one to resist the urge to promote flawed ‘free market’ analysis, does not seem to have learned any lessons from its erroneous coverage of the GFC. It the latest version of what has to be one of the worst-named columns ‘The Economist explains’ (given explanation usually requires knowledge to be imparted) – Why long-term unemployment in the euro area is so high (August 2, 2015), all the usual myths about the labour market are propagated and the obvious ignored because it doesn’t fit the ideological position of the magazine. It purports to ‘explain’ differences in the behaviour long-term unemployment in the Eurozone relative to the US (it is higher in the former) in terms of mobility and generosity of unemployment benefit payment regimes (lower and higher in the former). The real reason – a failure to generate sufficient employment growth as a result of different fiscal policy settings is not canvassed.
The Economist says that the recent “euro-area unemployment figures, released on July 31st … show the overall unemployment rate has crept down to 11.1% from its peak of 12.1% in April 2013 … [but] … another problem in the form of long-term unemployment (generally defined as being out of work for over 12 months) has emerged … Of the 19m jobless Europeans, more than half have not worked for the last year. And over 15% have not had a job for more than four years.”
They note the problem is at its worse in “southern Europe” due to the “protracted crisis”.
The motivation for the article is that:
But in contrast the number of people who have been looking for work for a long time in America fell when its economy recovered; the long-term joblessness rate now sits slightly above 20% of the total. So why is it so tough for Europeans to get back to work?
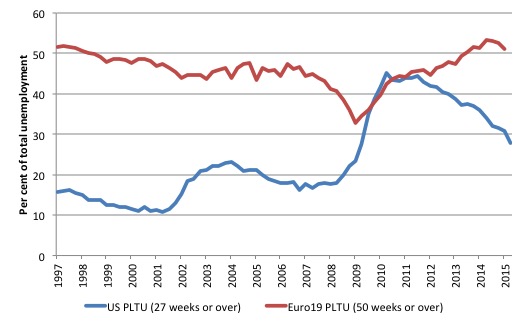
The graph they produce looks a little like the one below, which is taken from Eurostat (for the Eurozone 19 nations) and US Bureau of Labor Statistics data (for the US). The graph they present is a little ambiguous because US data is not presented on a comparable basis to the European definition of long-term unemployment).
In the US, long-term unemployment is defined as spells of unemployment greater than 27 weeks and the following graph shows the proportion of the total unemployed in that category from the first-quarter 1997 to the first-quarter 2015.
The Eurostat data considers long-term unemployment to be spells of unemployment greater than 50 weeks.
But with those differences aside, the graph is very interesting for what it tells us about the two broad labour markets.
In the Eurozone case, the proportion of the LTU in total unemployment (PLTU) fell rather sharply at the end of the last cycle before rising again to well above the pre-crisis levels.
In the US case, the sharp rise in the proportion of the LTU in total unemployment (PLTU) in 2009 was unprecedented in its history and the PLTU remains above previous peak levels even though it has dropped considered since the 2011 peak.
The Economist Magazine comparison is to expose the vastly different behaviours of the Euro19 and the US time series over the course of the GFC and its aftermath.
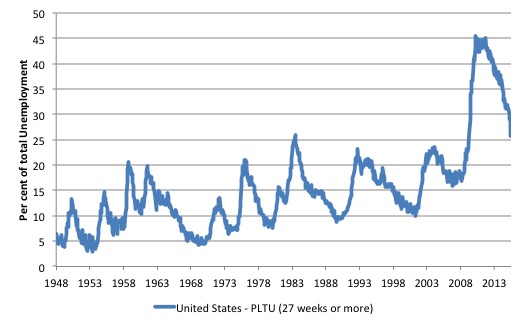
To put the US data into historical context, the US has demonstrated a typical pattern since the published data was available (from January 1948).
The proportion of the LTU in total unemployment (PLTU) rises some months after each recession begins, peaks then falls away again. The second graph shows the entire history of PLTU for the US (from 1948 to June 2015).
The question then arises as to what explains the rather different cyclical behaviour of the PLTU series in the Eurozone relative to the behaviour exhibited in the US?
Anyone who really understands the way labour markets operates would start by examining the flows into and out of unemployment because the unemployment pool is a heterogenous construct composed of different duration cohorts (people in different stages of unemployment duration) – which we might call a sequence of different ‘vintages’.
The labour market is in a state of constant flux with the large aggregates (employment, unemployment, not in the labour force) being added to and subtracted from by flows into and out of these categories
The unemployment pool, itself, is made of up of workers who have been in that state for varying lengths of time. If unemployment was a turnover phenomenon predominantly then the pool would be comprised of workers transiting between work and short-term spells of unemployment only to be replaced by the next wave of workers moving between jobs.
However, there is also a strong duration component to unemployment, which becomes more entrenched and dominant during periods of recession such that workers who enter unemployment spend lengthy periods in that state until some become classified as long-term unemployed (spells of unemployment greater than 12 months).
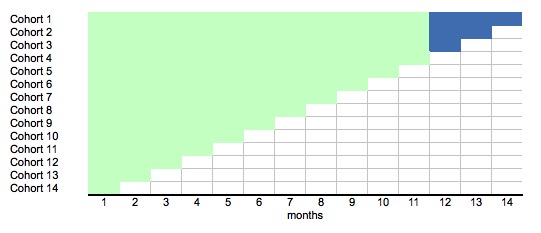
Think of the following stylised example which shows a position after 14 months of continuously rising unemployment. Imagine there is zero unemployment at first. Then each month, a cohort becomes unemployed and remains in that state over successive months (there is no outflow). After the second month, the first cohort has been unemployed for 2 months, and so on.
By the 13th, months, Cohort 1 becomes long-term unemployed as the short-term unemployment rises, so does PLTU. By the 14th month, the first three cohorts are now classified as long-term unemployed (blue segments)and the PLTU rises further.
If the economy fails to arrest the flow into the unemployment pool, each successive cohort will steadily move towards the long-term threshold, cross it and the PLTU progressively rises.
Further, in the early days of a recovery, the PLTU will rise if the outflows tap into the short-term unemployment pool first. But eventually, both pools are accessed as the recovery strengthens and the pool of unemployment falls overall.
The Economist Magazine’s explanation for the diverging behaviour of PLTU in the Eurozone relative to the US is rather curious given it leaves the obvious part of the story out.
It says that: “Part of the reason lies in labour mobility” – it is higher in the US than in Europe.
Why? “Language barriers, cultural differences and non-transferable qualifications” in Europe make it harder to move.
And … guess what? … “Generous unemployment benefits in Europe also tie would-be workers to one place and make getting work less urgent”.
This is the standard neo-liberal argument – that income support payments subsidise unemployment and reduce the intensity of job search.
I have dealt with that claim many times before.
The neo-liberal approach, which dominates policy making considers long-term unemployment to be a (linear) constraint on a person’s chances of getting a job. The so-called ‘negative duration’ effects are meant to play out through loss of search effectiveness or demand side stigmatisation of the long-term unemployed.
That is, they become lazy and stop trying to find work and employers know that and decline to hire them. Over this period, skill atrophy is also claimed to occur.
Income support payments allegedly then entrench that sloth.
It is then claimed that long-term unemployment represents a constraint on a person’s chances of getting a job.
So it has been common for mainstream economists and policy makers to postulate that there is a formal link between unemployment persistence, on one hand and so-called ‘negative dependence duration’ and long-term unemployment, on the other hand.
This is the so-called ‘irreversibility hypothesis’, which claims that the long-term unemployed require extensive re-training before they are ready for work.
Further, if the government tries to stimulate employment growth to reduce the long-term unemployment rate, the irreversibility properties will mean that wages growth will rise strongly as employers compete for skilled workers and ignore the long-term unemployed and inflation will result.
The long-term unemployed thus represent a constraint on non-inflationary growth and the only solution is to force them to upskill through various rules on their income support payments, including cancellation.
Although negative dependence duration (which suggests that the long-term unemployed exhibit a lower re-employment probability than short-term jobless) is frequently asserted as an explanation for persistently high levels of unemployment, no formal link that is credible has ever been established.
However, despite the lack of evidence, the entire logic of the 1994 OECD Jobs Study which marked the beginning of the so-called supply-side agenda defined by active labour market programs was based on this idea.
Once you examine the dynamics of the data you quickly realise that short-term unemployment rates do not behave differently to long-term unemployment rates. The irreversibility hypothesis is unfounded.
The relationship between long-term unemployment and the unemployment rate is very close.
As unemployment rises (falls), the proportion of long-term unemployment in total unemployment rises (falls) with a lag. Several studies have formally examined this relationship. My earlier work has found that a rising proportion of long-term unemployed is not a separate problem from that of the general rise in unemployment.
This casts doubt on the supply-side policy emphasis that OECD governments have adopted over the last two decades.
While the mainstream economics profession may claim search effectiveness declines and this contributes to rising unemployment rates, the overwhelming evidence is that both are caused by insufficient aggregate spending in the economy.
The policy response then is entirely different and supports fiscal stimulus measures being used to create jobs growth.
So while the mainstream economics profession may claim search effectiveness declines and this contributes to rising unemployment rates, the overwhelming evidence is that both are caused by insufficient demand. The policy response then is entirely different.
Please read my blog – Long-term unemployment – stats and myths – for more discussion on this point.
The Economist magazine also says that “higher job turnover in America than in Europe” causes the higher long-term unemployment in the latter. They quote ILO data which shows that the “probability of moving into employment within the next month was around 7% for Europeans and 12% for Americans. And the chances losing your job within the next month was 0.8% and 1%, respectively”.
Obviously, the higher the turnover rates the more quickly different unemployed workers are churned through the unemployment pool back into work.
But the turnover rate is linked to the state of the macroeconomy first and foremost. The probability of getting a job is derived largely by how strong employment growth is in comparison to the growth in the available supply of workers who want to work.
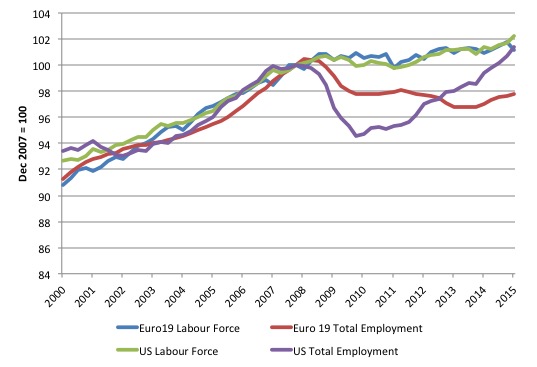
The following graph summarises why the behaviour of long-term unemployment in the Eurozone has been different since the GFC to that exhibited in the US.
It shows the labour force and total employment (indexed to 100 in the December-quarter 2007) for the Eurozone 19 nations and the US.
Prior to the crisis, growth in both aggregates was broadly similar in the Eurozone and the US. With the onset of the crisis, labour force growth slowed (as workers dropped out of the labour force) and that pattern was similar in both the Eurozone and the US.
The reduction in the growth of labour supply was thus similar in both the Eurozone and the US, which helped attenuate the rise in the unemployment rates in each region.
Total employment growth fell away dramatically in the US and less so in the Eurozone as the crisis hit. But while the Eurozone has largely failed to recover the lost ground as yet, some 7 years after the last peak, the US labour market started expanding again in 2010 on the back of the large fiscal stimulus introduced by the US government.
The US labour market thus started created outflow from the unemployment pool much early and it is only in recent quarters has there been any sign that employment growth is eating into total Eurozone employment.
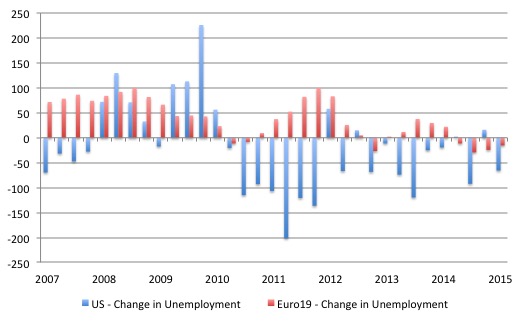
The following graph provides another way of understanding the relationship between employment growth and labour force growth. In this case, it shows the quarterly change in unemployment (thousands) from December 2007 to March 2015 for the US and the Eurozone.
So a positive bar indicates that unemployment has risen and tells us that employment growth has been insufficient to absorb the labour force growth. A negative bar indicates the opposite.
It is clear that the US started eating into the massive unemployment pool created in the early months of the GFC. But for the Eurozone that process only began in 2014.
Conclusion
The point is that while the inflows into unemployment are greater than the outflows, it is highly likely that the more people are moving through the duration categories within the pool towards the long-term threshold.
Failure to arrest that flow imbalance results in the rising PLTU.
America much more quickly reversed that process as a result of creative use of fiscal policy whereas Eurozone is mired in fiscal austerity and has a long way to go to soak up the damage that that policy failure has caused.
Mass unemployment reflects a failure of aggregate spending, which suggests that the fiscal deficit is always too low given the spending decisions of the non-government sector.
Book launch event – advance notice
The official book launch for my new book – Eurozone Dystopia – Groupthink and Denial on a Grand Scale – will be held on Monday, August 31, 2015 at the University of Maastricht, the Netherlands.
The event will run from 13:00 to 15:00 and there will be two excellent speakers:
1. Dr László Andor, former Commissioner for Employment, Social Affairs and Inclusion in the Barroso II administration of the European Commission.
2. Professor Arjo Klamer, Professor of Economics of Art and Culture at Erasmus University in Rotterdam, The Netherlands. He “holds the world’s only chair in the field of cultural economics”.
The public is welcome to the event and there will refreshments available. I hope to see a lot of people there in Maastricht on August 31.
I am also to offer a Special 35 per cent discount to readers to reduce the price of the Hard Back version of the book.
Please go to the – Elgar on-line shop and use the Discount Code VIP35.

That is enough for today!
(c) Copyright 2015 William Mitchell. All Rights Reserved.
The myth that government spending and “printing money” to increase employment and reduce austerity is once again in the British Press.
The neoliberal shadow chancellor Chris Leslie has come out today using this myth against Jeremy Corbyn. http://www.theguardian.com/politics/2015/aug/03/jeremy-corbyn-economic-strategy-would-keep-tories-in-power-chris-leslie
You said you wanted to speak to Corbyn. It looks like now is a very good time. What annoys me most is that the deficit is growing, and they do not worry when government spending subsidises railways, banks and Landlords.
It only seems to upset them when it is spent on the poor. I think this point is just as important, and even more than that, proves the MMT argument.
At the risk of being very annoying Sandra, you surely mean the debt is growing rather than the deficit. When more liberal people get these mixed up the right-wingers use this as a weapon and the overall point is lost. I hope I didn’t annoy you…
Labour mobility was low than usual in US during the height of GFC, there have to be jobs to move to ignite mobility. Of course mobility is easier when you have a common language and culture or even alphabet. But the EU elite never wanted a peoples Europe, that only wanted big biz and financial capitals Europe.
BTW
My local library bought “Eurozone Dystopia”, on my recommendation, so I’m going to borrow it today as the first reader of that copy. 🙂
“Further, if the government tries to stimulate employment growth to reduce the long-term unemployment rate, the irreversibility properties will mean that wages growth will rise strongly as employers compete for skilled workers and ignore the long-term unemployed and inflation will result.”
And I wonder whose fault that is..
Our idiotic NAIRU idea of a buffer stock of unemployed sucks. Let’s use that to attack govt spending!
I did take som time and engineering to get in to the NAIRU concept, now when it’s in full blom and lots of people have been placed in long-term unemployment it will take some engineering and costs to get things in balance again and a more “normal” and healthy employment market where it’s better balance between supply and demand.
C.L.
“At one level that sounds fantastically easy – if there is a shortage of money print some more. The difficulty is that if that then provokes higher inflation, if that then means that interest rates go up who will pay the price for that?”
If! if!
If as a substitute for analysis?
Always remember that inflation is a function of the *flow* of money and not the stock.
Look at the real and not financial. Who loses out by getting less share of real resources? Well the pie will likely expand.
Also, interest rates are in control of the central bank.
If you want to contact Corbyn, Richard Murphy is in his economic team and, from what I have read on his blog over the years, someone familiar and appreciative of your work.
“The real reason – a failure to generate sufficient employment growth as a result of different fiscal policy settings is not canvassed.”
An alternative view?
“Simon Wren-Lewis says that there can’t be any controversy over the fact that the second Eurozone recession was due to contractionary fiscal policy. This is quite a startling claim: back in 2010, the US and euro zone had the same unemployment rate around 9-10%. And we had something like a controlled experiment, since the US and the Eurozone did roughly the same amount of austerity. (By some measures the US did a bit more.) The big difference between the two areas was monetary policy. The US did some monetary stimulus through QE and forward guidance, while the ECB did nothing. Now the unemployment rate in the Eurozone has gone up from 9% to 11.6%, while it’s gone down in the US to 6.3%. This huge divergence in employment outcomes over the last 3 years with monetary policy being the difference, not fiscal policy, seems very striking. But yet again very respected Keynesians say it’s that it’s obvious that fiscal policy explains what went wrong.”
I suspect divergence between US and eurozone is because house prices have recovered in the US.
US house prices seem to have recovered somewhere between half to two-thirds from the peak: http://www.worldpropertyjournal.com/news-assets/Case-Shiller-Home-Price-Indices-chart-2.jpg
It is said US households lost 8 trillion in wealth in housing downturn, so this house price recovery has increased their wealth probably by 4-5 trillion? That’s equivalent to running 750 billion dollar budged deficit for 7 years, and that comes in top of actual budged deficit.
For eurozone there has been no such raise: http://blogs.lse.ac.uk/eurocrisispress/files/2014/02/Screen-Shot-2014-02-21-at-11.02.40.png
So I think if anybody were to gather data on changes to net wealth, where fiscal deficits were only one component among many, we could learn a lot more about the reasons behind employment development.