Today (April 18, 2024), the Australian Bureau of Statistics released the latest - Labour Force,…
Australian labour market – improvement but hardly credible
Today’s release of the – Labour Force data – for October 2015 by the Australian Bureau of Statistics once again brings into question the validity of drawing assessments about the state of the labour market on the basis of monthly changes in the data. Today’s release shows that employment increased by 58,600 (0.5 per cent) which is the largest monthly rise since March 2012 – and quite unbelievable really. The ABS estimated that unemployment fell by 33,400 to 739,500 and the unemployment rate dropped 0.3 percentage points to 5.9 per cent. Perhaps a signal on how volatile the data is, the ABS estimated the teenage participation rate rose by 0.8 percentage points, again rather fanciful. The cautious position is to look at the trend over the last several months and that suggests that the labour market has improved a little (Employment to Population ratio has been steadily rising). However, the teenage labour market remains very week with no discernible upwards trend revealing itself yet. If the forecast ed decline in private investment occurs over the next 12 months, then this slight improvement in the labour market data will be just a little blip in an unfolding nasty story.
The summary ABS Labour Force (seasonally adjusted) estimates for October 2015 are:
- Employment increased 58,600 (0.5 per cent) with full-time employment increasing by 40,000 and part-time employment rising by 18,600.
- Unemployment decreased by 33,400 to 739,500.
- The official unemployment rate decreased by 0.3 percentage points to 5.9.
- The participation rate increased by 01 points 65 per cent – the second consecutive monthly decline. It is still well below its November 2010 peak (recent) of 65.9 per cent.
- Aggregate monthly hours worked increased by 19.1 million hours (1.2 per cent).
- The quarterly ABS broad labour underutilisation estimates (the sum of unemployment and underemployment) were updated for the August-quarter. Underemployment was at 8.4 per cent and total labour underutilisation rate was at 14.3 per cent. There were 1,051.2 thousand persons underemployed and a total of 1.839.3 thousand workers either unemployed or underemployed. The next quarterly release will be in the November 2015 publication.
Employment growth – dramatic rebound? Revisions coming?
In the last month, total employment increased by 58,600 (0.04 per cent) with full-time employment increasing by 40,000 and part-time employment rising by 18,600.
This is a dramatic improvement on the sort of results we have seen in recent months and is almost unbelievable. It remains to be seen whether the ABC will revise this figure significantly.
Over the last 24 months or so we have seen the labour market data switching back and forth regularly between negative employment growth and positive growth spikes.
Last month employment growth was negative. Today’s result signal the strongest reboound in both categories of employment since March 2012 when total employment rose by 60.8 thousand.
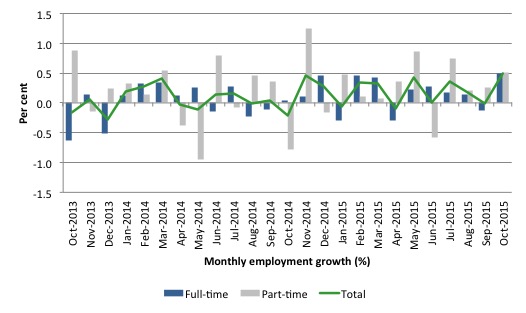
The following graph shows the month by month growth in full-time (blue columns), part-time (grey columns) and total employment (green line) for the 24 months to October 2015 using seasonally adjusted data. It gives you a good impression of just how flat employment growth has been notwithstanding the huge spike in part-time employment in the November 2014 survey.
While full-time and part-time employment growth are fluctuating around the zero line, total employment growth is still well below the growth that was boosted by the fiscal-stimulus in the middle of 2010.
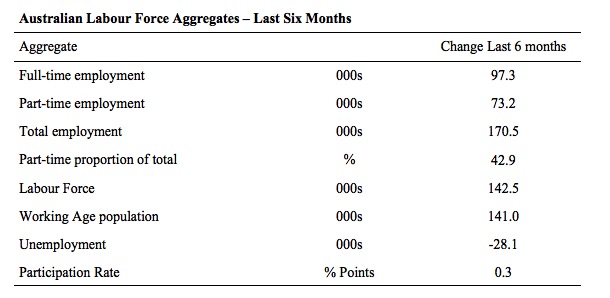
The following table provides an accounting summary of the labour market performance over the last six months. The monthly data is highly variable so this Table provides a longer view which allows for a better assessment of the trends. WAP is working age population (above 15 year olds).
The conclusion – overall there have been 170.5 thousand jobs (net) added in Australia over the last six months while the labour force has increased by 142.5 thousand. Employment growth has thus outstripped the increase in the supply of labour.
Full-time employment has risen by 97.3 thousand jobs (net) while part-time work has risen by 73.2 thousand jobs. Thus, 42.9 per cent of the total employment created (net) over the last 6 months has been part-time.
The participation rate has risen by 0.3 points from very low levels.
Unemployment has fallen by 28.1 thousand as a result of employment growth being in excess of what has been required to match the labour force increases.
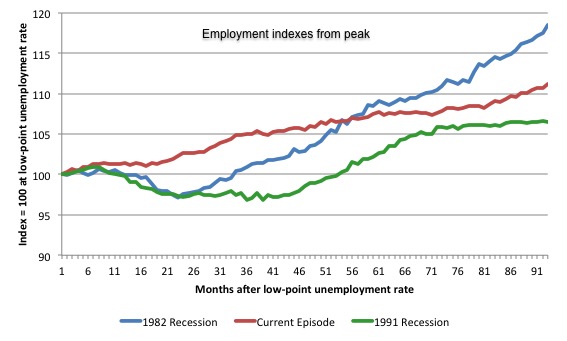
The following graph shows employment indexes for the last 3 recessions and allows us to see how the trajectory of total employment after each peak prior to the three major recessions in recent history: 1982, 1991 and 2009 (the latter to capture the current episode).
The peak is defined as the month of the low-point unemployment rate in the relevant cycle and total employment was indexed at 100 in each case and then indexed to that base for each of the months as the recession unfolded.
I have plotted the 3 episodes for 92 months after the low-point unemployment rate was reached in each cycle – the length of the current cycle.
The initial employment decline was similar for the 1982 and 1991 recessions but the 1991 recovery was delayed by many months and the return to growth much slower than the 1982 recession.
The current episode is distinguished by the lack of a major slump in total employment, which reflects the success of the large fiscal stimulus in 2008 and 2009.
However, the recovery spawned by the stimulus clearly dissipated once the fiscal position was reversed and the economy fell back into producing very subdued employment outcomes. The last several months have showed some signs that the pace of employment growth is picking up.
Moreover, since February 2008, employment has grown by a miserly 11.2 per cent, which is a very slow pace in historical terms for such a long period.
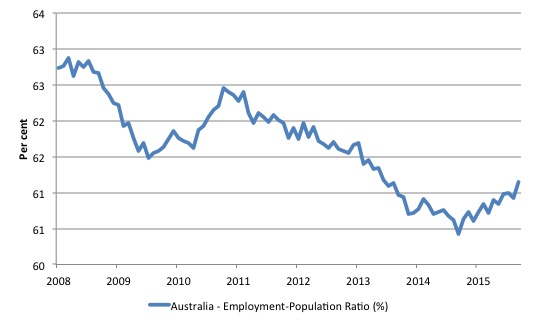
Given the variation in the labour force estimates, it is sometimes useful to examine the Employment-to-Population ratio (%) because the underlying population estimates (denominator) are less cyclical and subject to variation than the labour force estimates. This is an alternative measure of the robustness of activity to the unemployment rate, which is sensitive to those labour force swings.
The following graph shows the Employment-to-Population ratio, since February 2008 (the low-point unemployment rate of the last cycle).
It dived with the onset of the GFC, recovered under the boost provided by the fiscal stimulus packages but then went backwards again as the last Federal government imposed fiscal austerity in a hare-brained attempt at achieving a fiscal surplus.
The ratio has been steadily rising since October 2014 which would suggest that the labour market may have bottomed out and will improve slowly as long as there are no major policy contractions or cuts in private capital formation.
The on-going fiscal deficit is still supporting growth in the economy as the spending associated with the mining boom disappears.
The series increased sharply by 0.3 points last month.
Teenage labour market – gains and losses
The teenage labour market improved for the first time in many months but some of the monthly changes are two large to be believed. For example, the ABS reported that the Participation Rate for 15-19 years jumped by 0.8 percentage points in October 2015. That is a very large change in historical terms.
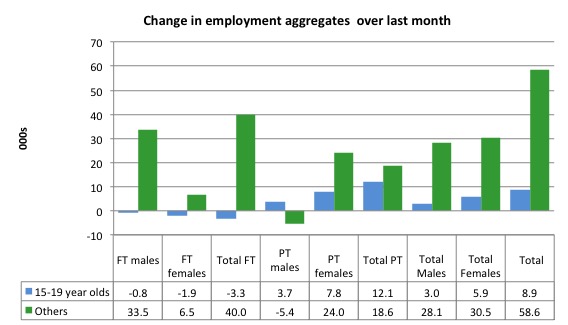
Despite the strong full-time growth overall, teenagers lost 3.3 thousand (net) full-time jobs but gained 12.1 thousand part-time jobs (net) in October 2015. The net outcome was a rise of 8.9 thousand jobs overall.
The teenage unemployment rate remained constant at 18 per cent in October 2015 despite the modest employment growth. This was because the participation rate rose and more teenage workers moved into the labour market seeking work.
The following graph shows the distribution of net employment creation in the last month by full-time/part-time status and age/gender category (15-19 year olds and the rest)
If you take a longer view you see how poor the situation remains.
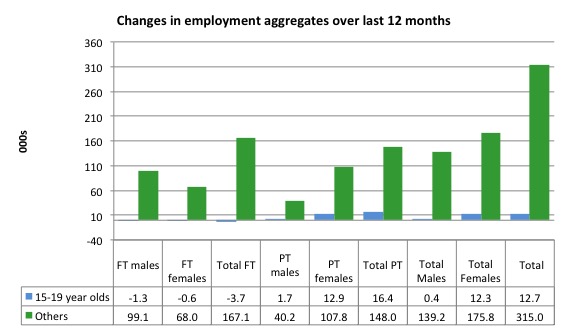
Over the last 12 months, teenagers have gained 12.7 thousand jobs overall while the rest of the labour force have gained 315 thousand net jobs. Remember that the overall result represents a fairly poor annual growth in employment.
The teenage segment of the labour market is being particularly dragged down by the sluggish employment growth, which is hardly surprising given that the least experienced and/or most disadvantaged (those with disabilities etc) are rationed to the back of the queue by the employers.
The following graph shows the change in aggregates over the last 12 months. It is as if the teenagers have not had a stake in the labour market either way (blue bars barely visible).
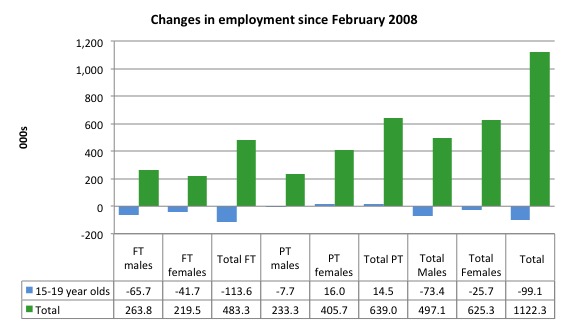
To further emphasise the plight of our teenagers, I compiled the following graph that extends the time period from the February 2008, which was the month when the unemployment rate was at its low point in the last cycle, to the present month (October 2015). So it includes the period of downturn and then the so-called “recovery” period. Note the change in vertical scale compared to the previous two graphs.
Since February 2008, there have been only 1,122.3 thousand (net) jobs added to the Australian economy but teenagers have lost a staggering 99.1 thousand over the same period. It is even more stark when you consider that 113.6 thousand full-time teenager jobs have been lost in net terms.
Even in the traditionally, concentrated teenage segment – part-time employment, teenagers have gained only 14.5 thousand jobs (net) even though 639 thousand part-time jobs have been added overall.
Overall, the total employment increase is modest. Further, around 57 per cent of the total (net) jobs added since February 2008 have been part-time, which raises questions about the quality of work that is being generated overall.
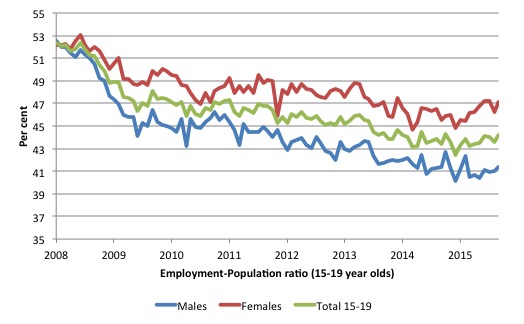
To put the teenage employment situation in a scale context the following graph shows the Employment-Population ratios for males, females and total 15-19 year olds since February 2008 (the month which coincided with the low-point unemployment rate of the last cycle).
You can interpret this graph as depicting the loss of employment relative to the underlying population of each cohort. We would expect (at least) that this ratio should be constant if not rising somewhat (depending on school participation rates).
The facts are that the absolute loss of jobs reported above is depicting a disastrous situation for our teenagers. Males, in particular, have lost out severely as a result of the economy being deliberately stifled by austerity policy positions.
In the last month, with the employment situation improving, there has been some reversal in the downward trends in these ratios.
The male ratio has fallen by 11.1 percentage points since February 2008, the female by 5 percentage points and the overall teenage employment-population ratio has fallen by 8.1 percentage points. That is a staggering decline in the employment market for Australian teenagers.
The other staggering statistic relating to the teenage labour market is the decline in the participation rate since the beginning of 2008 when it peaked in January at 61.4 per cent. In October 2015, the participation rate was just 53.9 per cent.
That is an additional 111.2 thousand teenagers who have dropped out of the labour force as a result of the weak conditions since the crisis.
If we added them back into the labour force the teenage unemployment rate would be 28 per cent. Some may have decided to return to full-time education and abandoned their plans to work. But the data suggests the official unemployment rate is significantly understating the actual situation that teenagers face in the Australian labour market.
Overall, the performance of the teenage labour market continues to be deeply disturbing. It doesn’t rate much priority in the policy debate, which is surprising given that this is our future workforce in an ageing population. Future productivity growth will determine whether the ageing population enjoys a higher standard of living than now or goes backwards.
The best the Government appears to be capable of is to dream up plans which deny income support to this group and impose impossible activity tests on them.
The longer-run consequences of this teenage “lock out” will be very damaging.
I continue to recommend that the Australian government immediately announce a major public sector job creation program aimed at employing all the unemployed 15-19 year olds, who are not in full-time education or a credible apprenticeship program.
Unemployment – decreased 33,400 thousand
The unemployment rate fell sharply to 5.9 per cent in October 2015 (down from 6.2 per cent in September).
Overall, the labour market still has significant excess capacity available in most areas and what growth there is is not making any major inroads into the idle pools of labour.
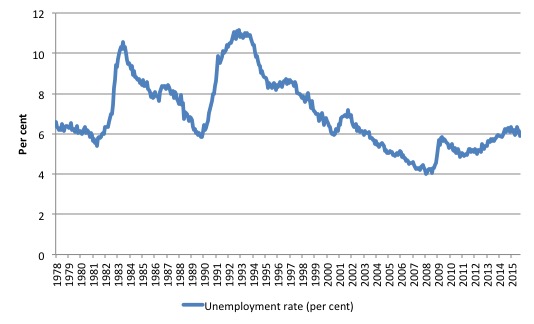
The following graph shows the national unemployment rate from February 1978 to Ocotber 2015. The longer time-series helps frame some perspective to what is happening at present.
After falling steadily as the fiscal stimulus pushed growth along, the unemployment rate slowly trended up for some months.
It is now above the peak that was reached just before the introduction of the fiscal stimulus. In other words, the gains that emerged in the recovery as a result of the fiscal stimulus in 2009-10 have now been lost.
Broad labour underutilisation – upwards of 14.4 per cent
The ABS last published its quarterly broad labour underutilisation measures for the August-quarter.
In the August_quarter, total underemployment remained at 8.4 per cent and the ABS broad labour underutilisation rate (the sum of unemployment and underemployment) was 14.3 per cent.
| There were 1,051.2 thousand persons underemployed and a total of 1.839.3 thousand workers either unemployed or underemployed. |
The following graph plots the history of underemployment in Australia since February 1978 to the August_quarter 2015.
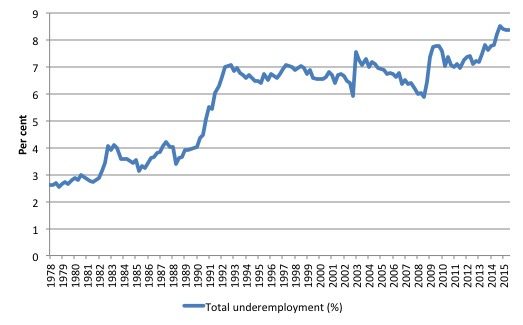
If hidden unemployment is added to the broad ABS figure the best-case (conservative) scenario would see a underutilisation rate well above 16 per cent at present. Please read my blog – Australian labour underutilisation rate is at least 13.4 per cent – for more discussion on this point.
The next update of the broad underutilisation series will be for the November-quarter 2015 Labour Force data release published in early December 2015.
Aggregate participation rate – rose by 0.1 points
The October 2015 participation rate rose by 0.1 points to 65 per cent.
There is considerable monthly fluctuation in the participation rate but the current rate of 65 per cent is a long way below its most recent peak in November 2010 of 65.9 per cent when the labour market was still recovering courtesy of the fiscal stimulus.
What would the unemployment rate be if the participation rate was at that last November 2010 peak level (65.9 per cent)?
The following graph tells us what would have happened if the participation rate had been constant over the period November 2010 to October 2015. The blue line is the official unemployment since its most recent low-point of 4 per cent in February 2008.
The red line starts at November 2010 (the peak participation month). It is computed by adding the workers that left the labour force as employment growth faltered (and the participation rate fell) back into the labour force and assuming they would have been unemployed. At present, this cohort is likely to comprise a component of the hidden unemployed (or discouraged workers).
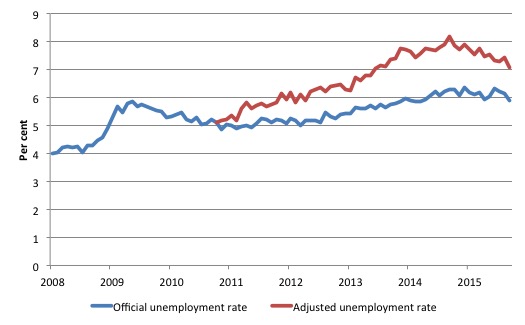
Total official unemployment in October 2015 was estimated to be 739.5 thousand. However, if participation had not have fallen since November 2010, there would be 900.5 thousand workers unemployed given growth in population and employment since November 2010.
| The unemployment rate would now be 7.1 per cent instead of 5.9 per cent if the participation had not fallen below its November 2010 peak of 65.9 per cent. |
The difference between the two numbers mostly reflects, in part, the change in hidden unemployment (discouraged workers) since November 2010. These workers would take a job immediately if offered one but have given up looking because there are not enough jobs and as a consequence the ABS classifies them as being Not in the Labour Force.
There has been some change in the age composition of the labour force (older workers with low participation rates becoming a higher proportion) but this only accounts for about a 1/3 of the shift. The rest is undoubtedly hidden unemployment.
Note, the gap between the blue and red lines doesn’t sum to total hidden unemployment unless November 2010 was a full employment peak, which it clearly was not. The interpretation of the gap is that it shows the extra hidden unemployed since that time.
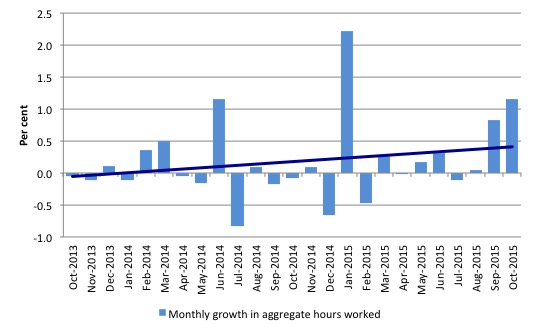
Hours worked – rose in October 2015
Aggregate monthly hours worked increased by 19.1 million hours (1.2 per cent) in October 2015 in seasonally adjusted terms.
With full-time employment decreasing and part-time work increasing, the increased hours worked suggests that workers are working longer weeks.
The following graph shows the monthly growth (in per cent) over the last 24 months. The dark linear line is a simple regression trend of the monthly change – which depicts a weak positive trend. You can see the pattern of the change in working hours is also portrayed in the employment graph – zig-zagging across the zero growth line.
The last two months have signalled a possible new growth phase is occurring. But we will have to wait for a few months yet to see if that really is consolidating.
Conclusion
In general, we always have to be careful interpreting month to month movements given the way the Labour Force Survey is constructed and implemented.
This month, employment rose by more than any month since March 2012. While that might be not impossible the odds are that the data will be revised downwards somewhat next month.
However, the trends are somewhat positive given the rise in participation, working hours and the decline in the unemployment rate.
Whether unemployment has peaked and is now falling is unclear. If the private investment plans (projected rather significant cuts) for the forthcoming year are realised then peak unemployment will be higher than it is at present.
The teenage labour market remains in a parlous state although it improved this month.
This is an emergency which is being ignored by the Federal Government. The neglect of our teenagers will have a very long memory indeed and the negative consequences will be stronger given the ageing population.
That is enough for today!
(c) Copyright 2015 William Mitchell. All Rights Reserved.
“This is an emergency which is being ignored by the Federal Government”.
Not only being ignored but fast talking newly-minted Treasurer Scott Morrison was almost ecstatic in announcing these lacklustre statistics. The government seem to think the takeover by Turnbull would herald a substantial growth in employment in the coming months.
Labor markets do not function and most labor statistics do not show an accurate picture of the economy’s health…nor lack thereof. As you say Bill the participation rate is probably the most telling and significant stat. Short and long term with orthodox thinking prevailing there is no way participation rate has to go but down. The internal logics of profit making systems, innovation and AI are all efficiency, that is efficiency of cost (primarily labor costs), efficiency of human effort and efficiency of human input at all.
With orthodox financial thinking and private finance’s virtual monopoly powers on credit creation, its utterly narrow restriction on the form that finance can take (loan only) and worst and most false of all, its claim to ownership of the credit it creates out of nothing (the ex nihilo-ness is not the problem) …..we and our progeny are all slowly boiling frogs in an actually non-functional macro-economic system.
Bill,
Did you see this excellent article on currency unions? Might be worth a comment.
http://ftalphaville.ft.com/2015/11/11/2144531/the-euro-was-pointless/
in the UK unemployment has gone down to pre-gfc levels at 5.3% as opposed to 5.4% in 2008(apparently ,at least thats what the news said)
Jake-the figures in the UK are very misleading (deliberately)-the growth in employment has been due to a number of negative factors:
1) Those ‘forced’ into nominal ‘self-employment’ due to benfit sanctions (become self-employed or lose your benefits)
2) Zero hour contract jobs (744,000) see: http://www.theguardian.com/uk-news/2015/sep/02/number-of-workers-on-zero-hours-contracts-up-by-19
3) 14.4% youth unemployment -http://www.theguardian.com/society/2015/feb/22/youth-unemployment-jobless-figure
4) Many so-called self employed earning less than £11,000 a year.