Today (March 6, 2024), the Australian Bureau of Statistics released the latest - Australian National…
Australian National Accounts – uncertain outlook with exports dominant
Today, the Australian Bureau of Statistics released the – September-quarter 2015 National Accounts data – which showed that real GDP grew by 0.9 per cent in the three months to September 2015, largely because there was a strong rebound in export volumes. Domestic demand contracted because both private and public investment spending was sharply negative. The other notable result was that ‘income recession’ that Australia entered in the last quarter has consolidated wth the total market value of goods and services (GDP) outpacing the flow that Australian residents enjoy as income. Real net national disposable income fell by a further 0.1 per cent over the quarter and 1.0 per cent over the last year. While private consumption growth remained positive, the savings ratio fell indicating that households are drawing on savings or credit to fund their on-going spending in the fact of weak wages growth and declining Real net national disposable income overall and per capita. Today’s data is positive in the sense that growth has not collapsed given the poor investment spending performance. But the reliance on net exports (with export growth and import contraction) provides a very uncertain outlook.
The main features of the National Accounts release for the September-quarter 2015 were (seasonally adjusted):
- Real GDP increased by 0.9 per cent after recording a 0.3 per cent increase in the June-quarter. The annual growth rate is 2.5 per cent, which is just sufficient to keep unemployment from rising.
- The main positive contributors to expenditure were Exports, with Net exports contributing 1.5 percentage points to GDP growth. The ABS say that this reflects “strong growth in Mining activity (5.2%), bouncing back after the decline in the June quarter”.
- The main negative factors were the decline in Total gross fixed capital formation of 4.0 per cent – private investment declined by 2.9 per cent and public investment declined by9.2 per cent.
- Our Terms of Trade (seasonally adjusted) fell by 2.4 per cent in the quarter and over the last 12 months they have fallen by a substantial 10.5 per cent.
- Real net national disposable income, which is a broader measure of change in national economic well-being fell by 0.1 per cent for the quarter and 1.0 per cent for the 12 months to the September-quarter 2015, which means that Australians are worse off (on average) than they were 12 months ago. In fact, Real net national disposable income per capita has declined for the last six successive quarters. This is the ‘income recession’ that economists are now speaking about.
Overall growth picture – growth on the back of mining exports
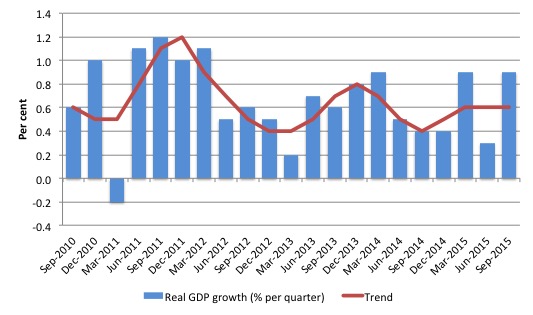
The following graph shows the quarterly percentage growth in real GDP over the last five years to the September-quarter 2015 (blue columns) and the ABS trend series (red line) superimposed. After the decline in trend growth was arrested by the fiscal stimulus in 2008-09 the decline in government support saw the dip in trend growth in 2010.
Initially, the growth in private investment associated with the record terms of trade and the resulting mining boom helped drive the new rise in trend growth which ended towards the end of 2013.
At present, trend growth is flattened and actual growth is fluctuating on the back of net export fluctuations.
The mining boom was thought to be in two stages. First, the investment boom as new productive infrastructure was being constructed (railways, ports, loaders, new sites etc). Second, the export boom that would result from the enlarged productive capacity. The second stage relied on continued growth in China to boost volumes and the prices remaining at elevated levels.
The problem is that China is now slowing fairly substantially and our net exports now showing signs of volatility. Last quarter they were down, where is this quarter they have jumped back sharply. where they are going is anybody’s guess at this stage.
It is clear that commodity prices have peaked but how far they will fall is uncertain. There are also reports of serious volume gluts in the world markets of the commodities that we export, which should continue to drive commodity prices down. The impact of these gluts on volumes is less clear and today’s results show that export volumes were strong in the three months that comprise the September quarter.
Australia’s terms of trade have fallen sharply – 2.4 per cent in the quarter and 10.5 per cent over the last year.
The sharp decline in net exports drained 0.7 percentage points from real GDP growth in the June-quarter, but rebounded in the September-quarter 2015 to add 1.0 percentage points to real GDP growth.
The overall assessment is that the Australian economy continues to grow but below trend, although there is now a debate going on with suggests that trend growth is now lower (around 2.7 to 2.8 per cent) than previously thought (around 3.25 per cent).
At any rate, annual growth is still only 2.5 per cent, which is below these so-called revised trend growth estimates.
Domestic wages growth is flat and consumers are reducing their saving out of disposable income to maintain consumption growth. Private household indebtedness is also rising.
The contribution of the public sector was negative in the September-quarter, with a plunge in public investment. With growth still below trend (however defined), now is not the time for accelerated policy austerity.
The opposite policy shift is needed – there is clearly a need for a boost in the public contribution to growth to provide a boost to domestic demand, which contracted in the September-quarter 2015.
Analysis of Expenditure Components
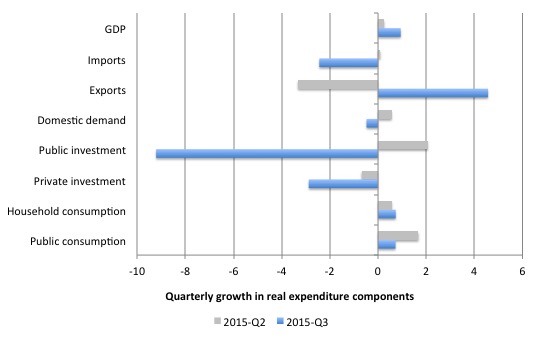
The following graph shows the quarterly percentage growth for the major expenditure components in real terms for the September-quarter 2015 (blue bars) and the June-quarter 2015 (grey bars).
Domestic demand contracted by -0.5 per cent in the September-quarter 2015 as a result of dramatic contraction in private and public investment expenditure which offset the strong growth in household and public consumption spending (0.73 and 0.72 per cent, respectively).
Private investment fell by 2.9 per cent consolidating the decline of 0.7 per cent in the June-quarter 2015 and Public investment fell sharply by 9.2 per cent.
Overall growth was driven by the strong export performance with exports growing by 4.6 per cent in the September-quarter and 6.5 per cent in the last 12 months. Import expenditure also fell by 2.5 per cent, indicating a weakening domestic income situation.
Contributions to growth
What components of expenditure added to and subtracted from real GDP growth in the September-quarter 2015?
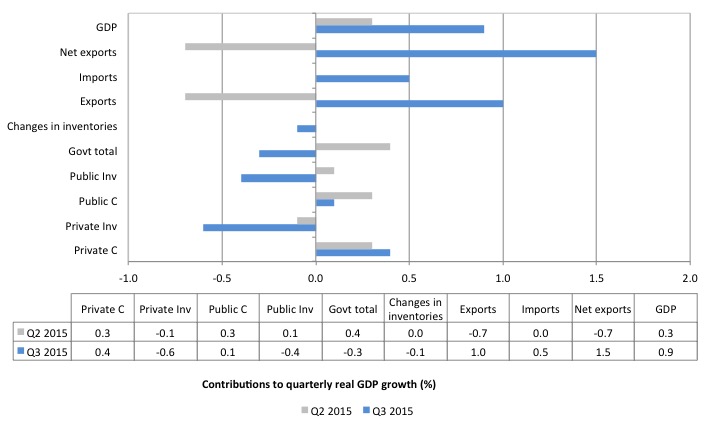
The following bar graph shows the contributions to real GDP growth (in percentage points) for the main expenditure categories. It compares the September-quarter 2015 contributions (blue bars) with the June-quarter 2014 (gray bars).
The strongest contributor to growth in the September-quarter 2015 was net exports (1.5 percentage points), which was the product of a strong export contribution (1.0 percentage points) and the contraction in import spending (which contributed 0.5 percentage points to real GDP growth).
Remember, when imports fall the drain of domestic income to the external sector declines which is considered to be a positive gross contribution.
The other main contributors to real GDP growth were Private consumption (0.4 percentage points), followed by Public consumption (0.1 percentage points).
The overall contribution of the government sector to growth was negative (-0.3 percentage points),which was driven by the sharp fall in the contribution of public investment spending (-0.4 percentage points).
The overall contribution of private investment on growth continued to be negative (-0.6 percentage points), which confirms that the investment cycle associated with the mining boom is over and non-mining investment is not picking up the slack.
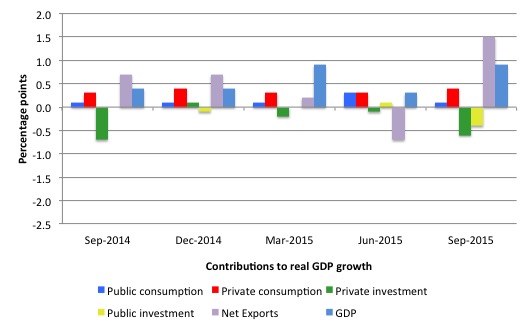
The next graph shows the contributions to real GDP growth of the major expenditure aggregates since the September-quarter 2014 (in percentage points). The total real GDP growth (in per cent) is also included as a reference.
Real GDP growth positive but real net national disposable income growth negative
The ABS tell us that:
A broader measure of change in national economic well-being is Real net national disposable income. This measure adjusts the volume measure of GDP for the Terms of trade effect, Real net incomes from overseas and Consumption of fixed capital.
While real GDP growth (that is, total output produced in volume terms) grew by 0.9 per cent quarter, real net national disposable income growth continued to fall – declining by 0.1 per cent in the September-quarter, which followed a 1 per cent decline in the June-quarter.
Real net national disposable income growth has been weak since 2011 and has been criss-crossing the zero line for the last three or so years.
Over the last year, real net national disposable income has declined by 1.0 per cent – which suggests that Australia is caught up in a “national income recession”.
Real net national disposable income per capita has declined for the last six successive quarters. In other words, Australians are poorer in income terms that they were at the beginning of 2014.
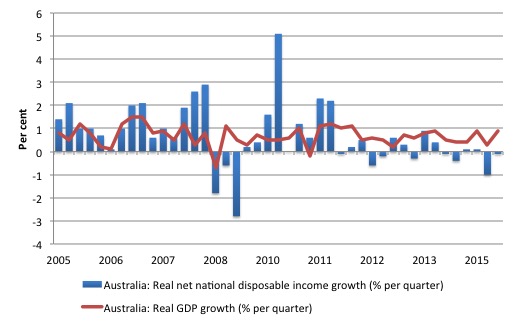
The following graph shows the evolution of the quarterly growth rates for the two series since the June-quarter 2005. You can see the divergence between real growth in output (and income that is generated by the economy) and the real net national disposable income (the real income Australians get) over the last few years.
So while the economy was pumping out mining exports at increasing volumes, Australian households were going backwards in real income terms.
The decline in real income has intensified as the mining contribution to real output growth has declined.
This subdued state is the result of the declining export prices manifesting in the significant decline over the last 12 months in Australia’s terms of trade and the flat wages situation.
In other words, our capacity (in real terms) to purchase imports has declined per unit of export and Australian workers are not sharing in productivity growth.
It means that Australians overall are poorer even though we are still producing more than 6 months ago.
This discrepancy is one reason why an export-led growth strategy will not necessarily increase the standard of living of domestic residents, even if it exports grow.
Household saving ratio falls slightly to 9 per cent
The squeeze on wages in Australia is manifesting in two ways. Rising indebtedness and falling saving out of disposable income.
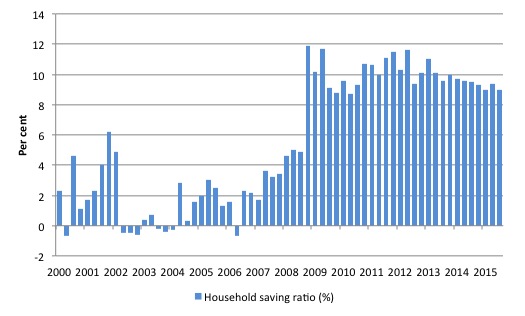
The following graph shows the household saving ratio (% of disposable income) from 2000 to the current period. The household saving ratio fell slightly in the September-quarter 2015 to 9 per cent (down from 9.4 per cent).
But it remains below the levels that were seen after the credit binge prior to the GFC ended and households sought some refuge in a return to higher saving ratios.
After the GFC hit, the household sector sought to reduce the precariousness in its balance sheet exposed by the GFC.
Prior to the crisis, households maintained very robust spending (including housing) by accumulating record levels of debt. As the crisis hit, it was only because the central bank reduced interest rates quickly, that there were not mass bankruptcies.
In June 2012, the ratio was 11.6 per cent. Since the December-quarter 2013, it has been steadily falling as the squeze on wages has intensified.
The downward trend in the Household saving ratio tells us that household consumption growth is being maintained by a reduction in saving and a rise in credit access – both worrying trends.
While the recent trend is downwards, it is unlikely that households will return to the very low and negative saving ratios at the height of the credit binge given that the household sector is now carrying record levels of debt.
At some point, household consumption growth will fall unless growth is supported by public spending (given the poor outlook for private investment and net exports).
This also means that government surpluses which were strong>only were made possible by the household credit binge are untenable in this new (old) climate. The Government needs to learn about these macroeconomic connections. It will learn the hard way as net exports weaken if it tries to impose austerity.
Real GDP growth and hours worked
One of the puzzles over the last several years or so has been the sharp dislocation between what is happening in the labour market and what the National Accounts data has been telling us.
Employment growth and hours worked has been very modest over the period while annual real GDP growth has been between 2 to 2.5 per cent but falling.
Today’s data shows that the link between real GDP growth and hours worked in the economy has been broken again following the plunge in hours in the June-quarter and the modest growth in the September-quarter.
This is largely a result of the fact that growth has been driven by exports while domestic demand has contracted. It means that productivity growth has strengthened in the September-quarter (GDP per hour worked by 0.6 per cent).
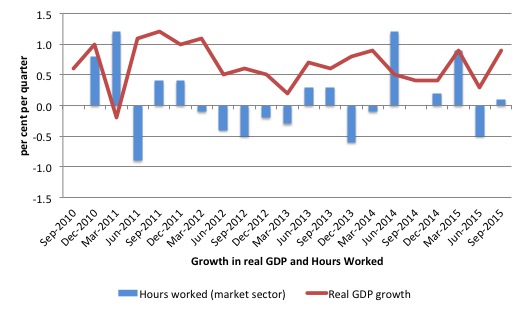
The following graph presents quarterly growth rates in trend GDP and hours worked using the National Accounts data for the last five years to the September-quarter 2015.
You can see the major dislocation between the two measures that appeared in the middle of 2011 persisted throughout 2013 and has reasserted itself in the last two quarters.
Just in case you think the labour force data is suspect, the hours worked computed from that data is very similar to that computed from the National Accounts.
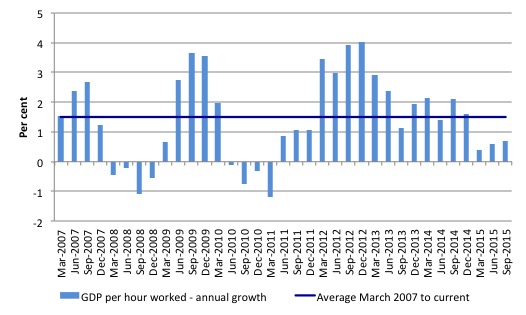
To see the above graph from a different perspective, the next graph shows the annual growth in GDP per hour worked (so a measure of labour productivity) from the March-quarter 2007 quarter to the September-quarter 2015. The horizontal blue line is the average annual growth since June-quarter 2007.
The relatively strong growth in labour productivity in 2012 and the mostly above average growth in 2013 and 2014 helps explain why employment growth has been lagging given the real GDP growth. Growth in labour productivity means that for each output level less labour is required.
In the September-quarter 2015, annualised labour productivity growth was only 0.7 per cent (well below the recent average of 1.5 per cent).
Over the last year, labour force growth has average about 1.6 per cent, while productivity growth has averaged around 0.8 per cent. This means that real GDP has to grow by around 2.4 per cent before the unemployment rate will start to fall.
The relatively poor real GDP growth is one reason why the unemployment rate has been rising over the last two years or so.
Conclusion
Today’s National Accounts data indicates that last quarter’s weak GDP growth has been reversed on the back of strong export growth.
Even so, the annual rate of growth is still well below trend, which explains why unemployment has been stuck at elevated levels for the last few years.
The main contributor to growth Was the massive rebound in export spending, aided by declining import spending.
The decline in import spending reflected the contraction in domestic demand.
Domestic demand contracted mainly due to the sharp decline in both private and public investment expenditure, which is undermining future prosperity.
Private consumption growth remained positive and contributed to growth, but it is being funded by a declining saving ratio and rising indebtedness. Neither trend is sustainable.
The negative growth in private investment means that potential output in Australia and future growth rates will be lower than otherwise. Again, not a positive sign.
The other notable result was the increasing evidence that Australia is now in an ‘income recession’ with real net national disposable income continuing to decline.
Taken together, the future is very uncertain because the current reliance on export revenue is dependent on factors that are beyond our control and which appear to be rather volatile at present.
That is enough for today!
“Neither trend is sustainable.”
I know little if anything about trends but I do know that most of the Australian shebang is unsustainable.
Of course,that doesn’t worry our Idiots In Charge who remind me of an Officer In Charge (X) who was my immediate superior for the last 10 years of my working life. This character was self inflicted morbidly obese.
A workmate aptly described the situation thus -” X is here for a good time,not a long time.”
Hey Bill,
If you’re still looking at Europe at all, here is a very toxic trend that has started to get some notice:
http://blogs.lse.ac.uk/europpblog/2015/11/26/still-mere-figureheads-why-the-eurozone-crisis-has-led-to-the-growth-of-presidential-power-across-europe/
Definitely worth a look. We could end up with unelected national leaders stabilising political systems that have been destabilised by unelected European leaders.
“The main contributor to growth Was the massive rebound in export spending, aided by declining import spending.”
The question then is whose demand has Aus ‘stolen’ to prop the figures up and what effect is the import drain in those countries having on their internal structures?
Since everybody is gripped with neoliberal disease – where foreign demand is so much better than domestic demand – surely this is just a mutual death spiral to the bottom?
first para…in the fact of weak wages growth should read in the “face” of…