It's Wednesday and I discuss a number of topics today. First, the 'million simulations' that…
Democrats in glass houses – you know the rest!
So-called US ‘progressive’ economists arena flap at the moment after Gerald Friedman, an academic economist at UMass released a report on January 28, 2016 – What would Sanders do? Estimating the economic impact of Sanders programs – which suggested that the US economy could perform significantly better and deliver substantially improved outcomes for those disadvantaged citizens with Bernie Sanders in the White House. When I say progressive, I mean those who would consider themselves Democrat Party insiders (former Chairs of the US Council of Economic Advisers under previous Democratic administrations). Last week (February 17, 2016), they created a special Internet site to publish – An Open Letter from Past CEA Chairs to Senator Sanders and Professor Gerald Friedman – which claimed that “no credible economic research supports economic impacts” proposed by Friedman and that “Making such promises runs against our party’s best traditions of evidence-based policy making and undermines our reputation as the party of responsible arithmetic”. As if the policy-making and arithmetic of these attention-seeking (neo-liberal) Democrat insiders is anything to be guided by.
The evaluation of the – Sanders’ Plan for a Broadly-shared prosperity – by Gerald Friedman attempts to enumerate the impacts of the policy announcements in a number of documents and statements that the US Senator has made in recent years. They are documented in footnote 1 in the report.
There are “two dozen distinct proposals” that form the corps of Sanders’ Plan. They include spending initiatives, tax changes and changes to the social security system.
The detail is in the Report.
What worried we most was the projected spending of $US14,500 over 10 years will be more than offset by revenue of $US15,828, which means the fiscal position at the end of that period will have been contractionary.
The Report is very weak in this area.
It says:
While the Sanders program is intended to promote growth and broadly based prosperity rather than budget balance, it would substantially reduce the Federal deficit during a second term and achieve budget balance soon after. Budget balance will be achieved through progressive tax increases and because faster economic growth reduces social spending while increasing tax revenues.
While the Sanders fiscal stimulus will initially increase the Federal deficit, this deficit will contribute to faster economic growth which, combined with progressive tax increases, will quickly bring down the deficit, producing a surplus during a Sanders second term
That is fine if other balances are compatible with financial stability and full employment.
But the Report says nothing about the state of private sector indebtedness or the likely movement in the external balance over the 10-year period.
At present, the US has enjoyed a current account deficit over growing proportions since the early 1990s around 2.5 per cent of GDP. Prior to the crisis, before growth collapsed the average current account deficit was over 5 per cent of GDP.
Given Friedman’s projected growth rate per capita over 2016-2026 of 4.5 per cent per annum, once would expect a strong growth in import spending.
The Report’s conclusion notes as an afterthought:
In addition, in a world where other countries are undergoing austerity, rising growth in the United States risks driving up imports and creating a balance of payments crisis.
I wonder what he means by a “balance of payments crisis”? I don’t consider that the US can have a traditional balance of payments crisis now that the US dollar floats.
It can certainly experience distributional shifts in employment as imports undermine local jobs. But it can also see job gains go the other way as import-competing sectors ramp up as the price of imports in local currency become more expensive. This is also not to mention any export gains that might arise from relative price effects (US exports in foreign currencies become cheaper).
None of these effects are likely to be very large anyway.
Please read my blogs – Balance of payments constraints and Ultimately, real resource availability constrains prosperity – for more discussion on this point.
But the point I would make is not that the current account deficit will grow substantially – perhaps back to the scale seen before the crisis (5 to 6 per cent of GDP) – but that if Sanders’ policies were to push the fiscal position back to balance or surplus (a contractionary move) then what does this means for private sector indebtedness?
It means that the private domestic sector will go further into debt. Where will that debt arise and which demographic groups will be concentrated in? How would we be sure that the growing private domestic sector deficit, implied by Friedman’s arithmetic, was driven by growing investment relative to savings rather than speculative borrowing for housing?
These are the sort of sectoral issues that Modern Monetary Theory (MMT) highlights and which are usually ignored by mainstream and Progressive economists.
They have to be addressed before a policy plan can be deemed credible.
If you live in glass houses …!
The signatories to the ‘Open Letter’ were:
Laura D’Andrea Tyson, CEA Chair, 1993-1995
Austan Goolsbee, CEA Chair, 2010-2011
Allan Krueger, CEA Chair, 2011-2013
Christine Romer, CEA Chair, 2009-2010
I discussed the problem that the Democratic Party has with credibility in terms of what it now stands for after several decades of movement to the Right of the political spectrum and towards free-market economics in this blog – The impossibility theorem that beguiles the Left
There was no reality check, as is often argued by these surrender monkeys who want us to believe that the world has irrevocably changed and that previous economic policies that were inclusive and sustained full employment are no longer possible.
It was actually a surrender to the destructive logic of capitalism and the vast array of resources that had been assembled by those on the Right to dismantle the apparatus of the state and tilt the playing field firmly in the direction of capital.
It is clear from the way the modern US Democrats fawn over Wall Street still and the handouts they provide to corporate America at the expense of the working class that the Party has lost its connection with the constituency that it previously served.
It now propagates the narrative “that the downfall of the working class is the inevitable price we pay for globalization” and this myth has become “essential to their identity”.
This is why Bernie Sanders appears to be so compelling. He is challenging the very identity of the Democratic Party and proposing a “political revolution”.
These ‘Open Letter’ writers are part of that Democrat shift to the right, however, progressive they hold themselves out to be.
The Open Letter said:
We are concerned to see the Sanders campaign citing extreme claims by Gerald Friedman about the effect of Senator Sanders’s economic plan-claims that cannot be supported by the economic evidence. Friedman asserts that your plan will have huge beneficial impacts on growth rates, income and employment that exceed even the most grandiose predictions by Republicans about the impact of their tax cut proposals.
As much as we wish it were so, no credible economic research supports economic impacts of these magnitudes. Making such promises runs against our party’s best traditions of evidence-based policy making and undermines our reputation as the party of responsible arithmetic. These claims undermine the credibility of the progressive economic agenda and make it that much more difficult to challenge the unrealistic claims made by Republican candidates.
Anyway, glass houses!
Each year the CEA issues the – Economic Report of the President – which among other things contains the so-called Administration Economic Forecast.
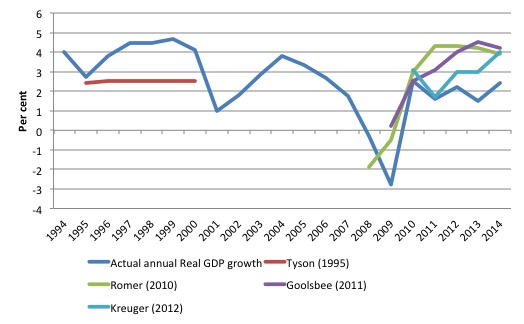
I compiled the real GDP forecasts from the Reports for 1995 (Tyson), 2010 (Romer), 2011 (Goolsbee) and 2012 (Krueger) and compared them to the real GDP growth rates.
The first graph shows the actual annual real GDP growth line (blue), the red line are the Tyson forecasts (1995-2000), the green line are the Romer forecasts (2009-2014), the purple line, Goolsbee (2010-2014) and the jade line, Krueger (2011-2014)
Conclusion: huge and systematic forecast errors.
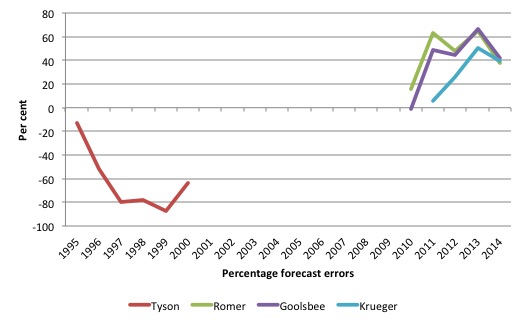
The next graph just shows the percentage forecast errors.
In fact, the 2009 forecast of -0.5 per cent was 455 per cent wrong (real GDP growth fell by 2.8 per cent). I didn’t include that in the graph because it three the scale out too much and made the other errors look small (which, in relative terms they obviously were).
On average, Tyson’s errors (1995-2000) were 63.7 per cent per year (understating actual GDP growth), Romer (2009-2014) was over optimistic by an average of 45.8 per cent per year, Goolsbee (2010-2014) 40.1 per cent (over) per year on average, and Krueger (2011-2014) was 30.3 per cent (over) per year on average.
Hardly accurate. The errors were also systematically wrong. Tyson was consistently pessimistic, while the others were consistently optimistic.
Either way, their underlying forecasting models were clearly wrong and delivered poor understandings of the direction of the economy.
I cannot see their performance could be called “responsible arithmetic”.
These former insiders claimed in the Open Letter that “Largely as a result of efforts like these, the Democratic party has rightfully earned a reputation for responsibly estimating the effects of economic policies.”
They were basically engaging in self-aggrandizing praise (“efforts like these” – their so-called application of “rigor” to “forecasts of the effects of proposed economic policies”.
With forecast errors of that magnitude, it seems they didn’t have much clue as to the “arithmetic effects of economic policies”.
And that is hardly a surprise. All are essentially ‘New Keynesian’ economists.
In 2005, Laura Tyson gave an interview to The Independent (September 10, 2005), while she was enjoying her £310,000 per year salary as Dean, London Business School – Laura Tyson: A Democrat in exile… One woman’s journey from White House to London
Tyson said:
The whole idea of making the central bank independent was exactly right. The idea of trying to balance the government books over the business cycle is exactly right … set limits on how much the government should borrow over the business cycle – those are all just basic, sensible principles.
These are the anathema of sound economic management. This sort of economic thinking, which the Democrats construct as being ‘progressive’ has unnecessarily caused millions of people to lose jobs, poverty rates and inequality to rise.
I guess her salary was way above the incomes the unemployed that are the result of such policy aims are forced to survive on.
The fact is that a rule where the the government ‘balances’ its books over the economic cycle is not exactly right. It all depends.
If the external sector was in deficit of say 4 per cent of GDP over the same economic cycle (peak to peak real GDP) then if the government balanced its fiscal position on average over that period, the private domestic sector would be in deficit of 4 per cent of GDP over that cycle.
That might not be a sound position for the economy to be in (or aim for), if the indebtedness of the private domestic sector was already too high. A recession would likely follow as that sector realised the precariousness of its overall balance sheet (made up of many individual balance sheets) and spending was cut back to control the private debt.
Further, what about a nation that has a strong net exports? Then a continuous fiscal surplus might be required to ensure that the public provided first-class infrastructure and services while satisfying the private domestic sector’s desired net saving (overall) without triggering inflation. A balanced fiscal position over the cycle would be madness in that case.
The point is when these ex CEA chairs and Democrat insiders start casting aspersions about crazy forecasts and the veracity of other economists who are advising ‘rebel’ Democrat Presidential candidates, they should reflect back on their own performances, which I don’t see as representing a glowing record of insight and judgement.
I discovered after I had poured through the forecasts, that the same (and better) analysis appeared in this article in the New Republic (February 19, 2016) – The Pious Attacks on Bernie Sanders’s “Fuzzy” Economics.
The writer, David Dayen also noted that:
Let’s remember that the CEA has a full staff and the weight of all the data-gathering resources of the U.S. government behind it, compared to one economist in Massachusetts playing with hypothetical models. And yet the CEA still gets it wrong routinely. Which is fine-history tells us we should not expect such precision. But let’s not allow one subset of Democratic economists to take the high road of “evidence-based” mathematics when they’re all throwing darts at a board.
He also documented other “wildly optimistic” forecasting from Romer and Goolsbee. He also notes that while Larry Summers “dismissed” Romer’s forecasts in 2009 of the impact of the economic stimulus program and that the final stimulus was reduced by more than one half of her original estimates, she still maintained the original peak unemployment rate assumptions, for “political expediency or some other unknown reason”. Her forecast of peak unemployment was 8 per cent – it actually topped 10 per cent.
David Dayen’s conclusion?:
What’s more troubling is how Democratic mainstream economists use these tactics to boot anyone not preaching from the incrementalist gospel out of the serious club.
That’s the point really.
Friedman’s projection
I do not intend to examine all the projections presented by Gerald Freidman in his Report. But I am quite interested in his labour market projections and have done research in the past that bear on the veracity of them.
On Page 15 of the Report, there is a graph (Figure 6), which I include below, compares Friedman’s projections of the labour force to separation rate under Bernie Sanders’ policies to the US Congressional Budget Office projections.
He writes:
Similarly, while the CBO projections imply a continued decline in the labor force participation rate, under the Sanders program this is expected to return to over 67%, or its pre-recession levels
We have a fundamental disagreement here, that is for sure.
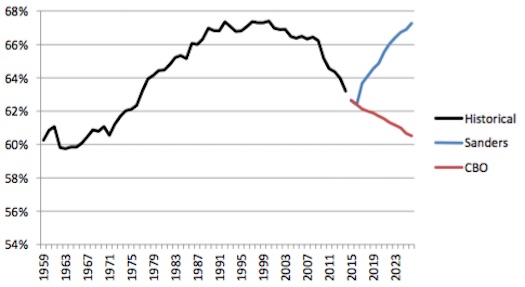
This also impacts upon his estimate of the Employment-Population ratio which he projects out to 2026 to be 65 per cent, compared to the CBO projection of 57 per cent.
Friedman has been criticised for these ‘unbelievable’ participation rate forecasts – doesn’t he know that the US is an ageing society and the decline in the participation rate is not cyclical (that is, workers giving up the search for jobs because of the sluggish employment growth)? That is the cry of the critics.
Well is there any validity to this criticism? If so, to what extent is the decline in the participation rate since the recession reflect structural forces such as ageing compared to the obvious cyclical shifts in participation rates?
I did some analysis of this question in this blog – Decomposing the decline in the US participation rate for ageing.
Basic LF arithmetic
Employment (E) + Unemployment (U) = Labour Force (LF).
LF + Not in the Labour Force (NLF) = Working Age Population (WAP).
The Labour Force Participation Rate (LFPR) = LF/WAP
The Unemployment rate (UR) = U/LF.
The Employment-Population ratio (EPOP) = Employment/WAP.
Trends in US labour force participation
The LFPR is sensitive to the economic cycle because job search rises when times are good and falls when times are bad.
But the LFPR can also be influenced by trend factors (sometimes called structural factors) and the ‘ageing population’ is one such factor. The other is the gender balance in the WAP. For example, participation rates rose dramatically in the 1970s as a result of social changes, which saw a massive influx of married women into the workforce.
The following graph shows the aggregate participation rate from January 1948 to January 2016. The US aggregate participation rate peaked at 67.3 per cent in April 2000 (seasonally adjusted). Thereafter it has declined on trend with some reversions in between.
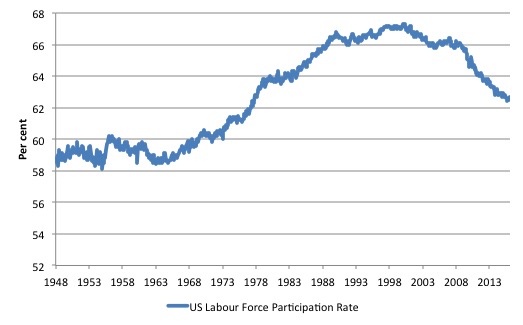
It is thus clear that the decline in the aggregate participation rate began before the GFC hit the US.
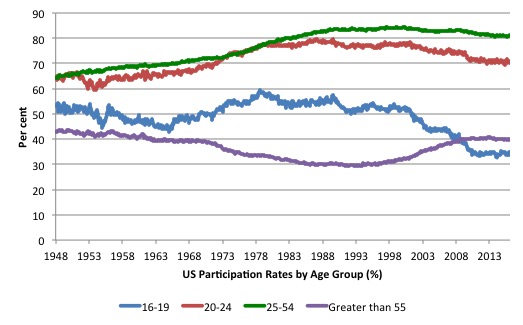
The next graph breaks the aggregate down into age groups. The prime age (25-54) and 20-24 groups have seen a tapering of their participation rates sine the late 1980s.
There have been sharp declines in the participation rates for teenagers (16-19) since the late 1980s and a steady rise in participation rates for the over 55s, which levelled off with the onset of the GFC as job opportunities dried up.
Decomposing the Trend and Cycle components
I won’t repeat the methodology I developed in the blog – Decomposing the decline in the US participation rate for ageing – because otherwise this blog will be too long. Yes, I know, length is relative.
I will leave it up to you to discern how the total participation rate (LFPR) is a weighted average of the underlying participation rates of the demographic groups that make up the total Working Age Population (WAP).
The weights are given by the share of each demographic group in the WAP. We will stick to using: three broad groups – young workers 15-24 years old; prime-age workers 25-54 years old; and older workers 55 years and over.
The behaviour of the individual age cohorts within the prime-age category (25-34, 35-44, 45-54) is very similar and researchers often reduce the complexity of the problem by aggregating them together with little loss of information.
The point is that we could encounter a situation where the LFPRs for the three groups are unchanged but the total WAP becomes comprised on more of the older than 55 group and less of the 15-24 groups and if LFPR of the older workers is less than the participation rate of the 15-24 cohort, then the total LFPR will fall just because there are proportionately more people in the WAP who have lower participation rates.
So the LFPR can fall without any changes in the underlying behaviour of the cohorts because of shifts in the population age composition occur.
The absolute decline in weights of the three cohorts between April 2000 and January 2016 is:
- 16-24: -0.84 percentage points
- 25-54: -6.97 percentage points
- Over 55: 7.82 percentage points
The youth decline is very small relative to the changes in the weights of the other two age groups.
The decline in the Prime-age weight has been less than the rise in the Older workers share because the Prime-age category is experiencing flows at both thresholds – the youth flow in and the older Prime-age workers flow out.
Estimating the effect of ageing on the LFPR
The question is: How much of that falling LFPR is due to the cyclical slowdown and how much of it is due to the ageing of the population?
In the last analysis I did, I estimated the effect from April 2000 to June 2014.
But Friedman talks about the pre-recession peak, which occurred in January 2008. So the question I answer here is how much of the decline in participation since January 2008 is due to ageing effects as opposed from cyclical effects (recession)?
The method involves calculating the participation rate using the demographic cohort weights as they were in January 2008.
That is, we consider the LFPR behaviour for each group between January 2008 and January 2016, weighted by the shares of each group in the WAP as at January 2008.
The resulting total weighted average participation rate is what would have occurred if there had not been a shift in the population shares.
A simple comparison with the actual participation rate (which uses the current cohort weights in each period) with this fixed-weight participation rate series, then tells us the change in the participation rate that is due to changes in the age distribution of the working age population since January 2008.
In January 2008, the actual participation rate was 66.2 per cent. In January 2016, it had dropped to 62.7 per cent, A difference of 3.5 percentage points or 8,833 thousand workers who would have been in the workforce, based upon underlying population growth, if the participation rate had not have declined.
The question is how many of those workers are not in the labour force in January 2016 due to cyclical factors.
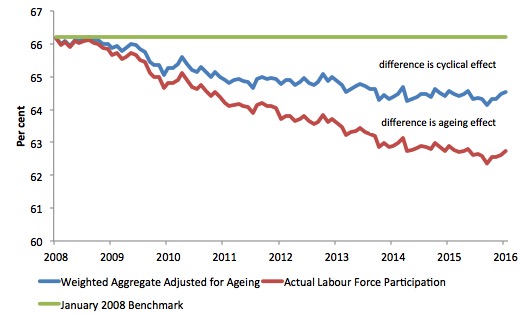
The following graph plots the two times series – the actual LFPR (red line) and the fixed-weight LFPR series (blue line).
The green line is just the participation rate at January 2008. The differences between the three lines provides the decomposition between ageing factors (shifting weights in the working age population) and other factors (which we presume to be cyclical given what has happened in this period).
The results suggest that:
1. If the age composition of the Working Age Population (the weights of the different cohorts) had have remained at its January 2008 shares then the fixed-weight participation rate at January 2016 would be 64.5 per cent.
2. The difference between that estimate and the actual labour force participation rate as at January 2016 is 1.8 percentage points or 4,663 thousand workers. This drop in the participation rate is the ageing (or shifting weight) effect.
3. The remainder is the cyclical effect and is estimated to be around 4,170 thousand workers, who I would consider to be reasonably classified as additions to ‘hidden unemployed’ and who would return to the employed workforce if there was sufficient employment growth forthcoming. They would almost certainly work if a Job Guarantee was introduced.
4. The actual decline in the participation rate between January 2008 and January 2016 is 3.5 percentage points (the difference between the green and red lines). The ageing effect thus accounts for 52.8 per cent of the decline in the participation rate, and the other (cyclical) effect accounts for 47.2 per cent of the decline.
5. If we add the cyclical effect back into the labour force, and call these workers unemployed, then the adjusted ‘unemployment rate’ would be 7.4 per cent in January 2016.
So what about Friedman’s point that the participation rate could return to “its pre-recession level” of 67 per cent?
First, its pre-recession level was not 67 per cent. It hasn’t been up there since the late 1990s and early 2000s. There is clearly age effects going on that have reduced the trend rate.
Second, its pre-recession level peak was 66.2 per cent in January 2008. Given it is currently only 62.7 even a recovery back to 66.2 per cent would be a significant gain for disadvantaged US workers and something to celebrate.
The previous analysis suggests that if we reversed the impact of the recession then we would be back at the blue line not the red.
The blue line is still a distance from the green line.
It is true that the ageing effect is also somewhat cyclical – older workers retire because of age discrimination and loss of job.
But I doubt very much if the ageing effect that is net of any interdependencies with the cycle is only a small proportion of the total estimated effect.
I also simulated the impacts on the Employment-Population ratio, assuming that all of cyclically-displaced workers were employed in each of the months between January 2008 and January 2016.
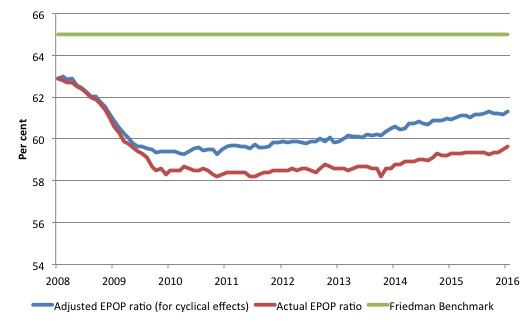
The following graph shows the actual Employment-Population ratio (red line) and what the ratio would be if those cyclical participation effects were absent.
The actual Employment-population ratio in January 2016 is 59.7 per cent, whereas this would be 61.3 per cent if the cyclical effects were corrected.
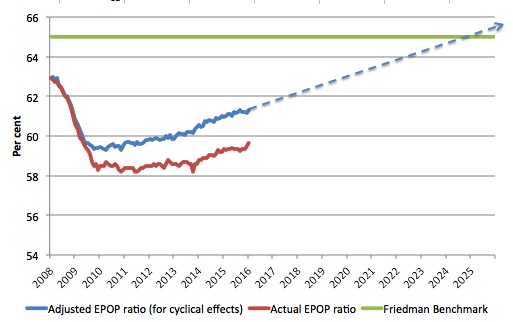
Stretching the analysis a little more I projected out the current improvement in the adjusted Employment-Population ratio to 2026, which is the time horizon covering the projections of Gerald Friedman.
If the ratio maintained its current improvement as the US economy strengthened, then it is not implausible that the Employment-Population ratio could approach the green line, which is Friedman’s 2026 projected level.
I wouldn’t place too much on this last bit of musing though.
What I would say is that if Bernie Sanders did the right thing and announced a Job Guarantee then the projections in Gerald Friedman’s evaluation document would easily be met with respect to employment and participation.
Conclusion
In general, one cannot discount the trend decline in the labour force participation rate in the US as a result of the changing demographic composition of the labour force (in age).
The analysis suggests that the participation rate will struggle to return to the April 2000 levels given that trend decline.
But the proposed fiscal stimulus that forms part of Bernie Sanders’ campaign will certainly promote dynamics that the US economy has suppressed for years under both the Democrats and the Republicans. I would expect to see some reversals in that trend decline.
Whether Gerald Friedman is being optimistic is not the point I think. The fact is that the Bernie Sanders proposals represent a break from the mainstream orthodoxy that has choked America and created rising poverty rates, hollowed out cities and regions, and growing misery and dislocation among minorities, particularly black youth.
I do not like his continual political insistence that the fiscal position will get back into surplus. That is the sop to the old ideologies of neo-liberalism that he seeks to replace.
So whether these projections are optimistic doesn’t really matter. The direction is sound. As long as workers are not being constrained by lack of jobs and the stimulus achieves full employment, which it surely would, then I don’t see what the problem is.
That is enough for today!
(c) Copyright 2016 William Mitchell. All Rights Reserved.
Excellent blog post!
I don’t like Bernie Sanders call for increased payroll taxes
I liked the description of the public panic of some economists as ‘arena flap’: a panic spread out for public spectacle…
I understand Bernie Sanders is being advised by Prof Stephanie Kelton but I think he may be being cautious and not play into the hands of the neo-liberals if he does not publicly promise a return to surplus.
I see it as similar to a candidate declaring their belief in god as it could be politically suicide to declare they do not.
I heard that Stephanie Kelton was advising him as well. I thought Bill might be able to confirm or deny wether this is true. Kelton is a strong advocate for a job guarantee. if sanders get in be interesting to see what he implients
The panic over imports always makes me laugh – because it comes from people who push ‘export-led growth’.
If you are making stuff and shipping it overseas to excess then at that point you stop exporting for exchange and start exporting to *import demand from overseas*.
Which means there has to be somewhere providing the excess demand, and your financial system has to be configured to discount their currency into your own in some way (whether a sovereign wealth fund, direct exchange via a ‘peg’, or some form of ‘liquidity swap’.). Otherwise you run out of liquidity in your own currency and the trade gap closes as export trades start to fail.
So if Sanders does throw out a huge amount of spending the rest of the world will lap it up – since they are desperate for some sort of demand from somewhere.
Given that Sanders may have been responsible for Kelton being appointed to her government post, and she is an MMTer, it is strange that Sanders goes on about taxation. It may be as others have suggested that he is doing this for political reasons, but if so I would advise not saying anything about this topic at all unless directly asked. If Sanders truly believes that taxation is needed to fund some government expenditure, then he is not much different than McDonnell in this respect.
Thanks! I had just finished reading the Friedman paper and when I turned to your blog, there were answers to most of the questions I had about it. I did have one additional one. Like Bill, I was also concerned about the contractionary stance of their estimated budget surpluses, but assuming that they come about as the result of tax increases on only the very highest incomes, does a surplus necessarily entail an increase in private sector debt levels? Might it instead come from a decrease in the saving rate among the most wealthy? Presumably the economic growth could be genereated by increases in income and spending at lower income levels.
And why would we not want to dispense with this crap and be pushing the real solution that HR2990, The NEED
Act offers, the seamless transition to a sovereign money system? Why waste time tweaking the existing fraudulent system? Sanders should know better.
Regarding Stephanie Kelton, all you need to do is check Wiikipedia…
On December 26, 2014, Kelton was designated as Chief Economist for the Democratic Minority Staff of the Senate Budget Committee
Bernie Sanders is the ranking Democrat (minority party) on that committee, and is responsible for the Kelton hire.
Dear All
There is a lot of speculation about the role played by my MMT colleague Stephanie Kelton in shaping the agenda and narrative of Bernie Sanders. While I am not going to disclose confidential information that I am privy to, the fact is that he is being advised by a number of economists at present, several of whom are not in the MMT camp.
Stephanie does a great job, however, just to introduce the MMT ideas.
best wishes
bill
from Jacobin: https://www.jacobinmag.com/2016/02/mason-bernie-sanders-jerry-friedman-economists-employment-wages-growth-cea/When Wonks Attack
Beltway wonks are dismissing Bernie Sanders’s economic plan as unserious and unrealistic. Here’s why they’re wrong.