I have received several E-mails over the last few weeks that suggest that the economics…
Real wages falling in Australia
The Australian Bureau of Statistics published the latest – Wage Price Index, Australia – for the December-quarter yesterday and annual private sector wages growth fell to 2.0 per cent (0.5 per cent for the quarter). This is the fourth consecutive month that the annual growth in wages has recorded its lowest level since the data series began in the September-quarter 1997. Real wages in the private sector are now in decline. In the Mid-Year Economic and Fiscal Outlook published in December, the Government assumed wages growth for 2014-15 would be 2.5 per cent rising to 2.75 over 2016-17. They also assumed real wages (the difference between growth in the nominal Wage Price Index and the Consumer Price Index would be positive (0.5 per cent in 2016-17). On current trends, neither assumption will be realised, means the forward estimates for taxation revenue are already falling short and the fiscal deficit will be larger than assumed. There will be then the typical hysteria about the size of the fiscal deficit and the need to cut it which will be missing the point entirely. The rising deficit is just responding to a generalised decline in economic activity, falling employment and suppressed wages growth. Depending on how we measure inflation, the annual wages growth translates into a small real wage rise or fall. Either way, real wages are growing well below trend productivity growth and Real Unit Labour Costs (RULC) continue to fall. This means that the gap between real wages growth and productivity growth continues to widen as the wage share in national income falls (and the profit share rises). The flat wages trend is intensifying the pre-crisis dynamics, which saw private sector credit rather than real wages drive growth in consumption spending. The lessons have not been learned.
The wage series used in this blog is the quarterly ABS Wage Price Index published by the ABS. The Non-farm labour productivity per hour series is derived from the quarterly National Accounts.
A compact dataset can be downloaded from the RBA Table H2 Labour Costs and Productivity. I extrapolated the average growth over the last five years to get the December-quarter productivity result, given the national accounts data is not released until early March.
Please read my blog – Inflation benign in Australia with plenty of scope for fiscal expansion – for more discussion on the various measures of inflation that the RBA uses – CPI, weighted median and the trimmed mean The latter two aim to strip volatility out of the raw CPI series and give a better measure of underlying inflation.
The deflator used in this blog is the RBA’s ‘core’ or ‘underlying’ inflation measure. I also use the trimmed mean and weighted-median measures, which take out volatility.
The RBA says (Source):
Because of the noise in short-horizon movements in the CPI, policymakers and other analysts often look to measures of underlying or core inflation, which should be subject to less noise than headline inflation …
The most widely used underlying measure is the inflation rate for the CPI basket excluding a few items which historically have had particularly volatile prices. The items typically excluded are various types of food and/or energy, and in some countries the resulting measure is often referred to as ‘core’ inflation. These ‘exclusion’ measures of underlying inflation remove the direct effect of movements in the prices of those items on the rationale that they tend to be volatile and often not reflective of the underlying or persistent inflation pressures in the economy. They are obviously easily calculated and explained to the public.
Nominal wage and price inflation
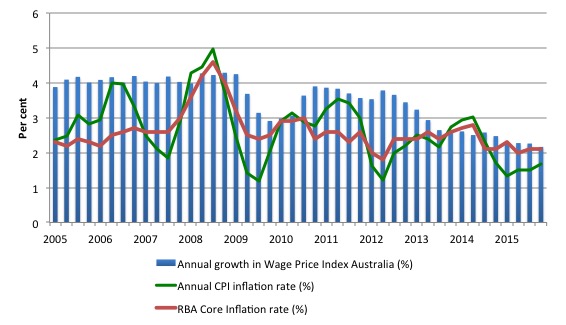
The first graph shows the overall annual growth in the Wage Price Index from the March-quarter 2005 (the WPI series was first published in the September-quarter 1997) to the December-quarter 2015 (today’s release).
I also superimposed the annual inflation rate (Consumer price index) – the green line and the annual ‘core’ inflation rate (red line). The bars above the green or red lines indicate real wages growth and below the opposite.
Once we take out the volatile factors in the CPI, we see that the real wage has fallen or been static in six out of the last nine quarters.
In the last two quarters, the real wage has fallen marginally (at decimal places).
Real wages growth falls in December-quarter
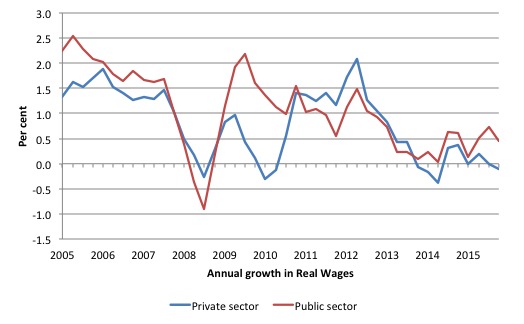
The following graph shows the annual growth in real wages from the March-quarter 2005 to the December-quarter 2015 for the public and private sectors.
After a few quarters of hard real wage cutting in 2013-14, the private sector returned to positive real wages growth but at very subdued rates.
In the two quarters, private sector real wages growth has been zero (September) and negative (December).
The rise in real wages in 2012 into 2013 was the result of the strong economic growth supported by the fiscal stimulus. The declining profile after that is associated with the end of the mining investment boom exacerbated by the obsessive fiscal austerity that was introduced (too early).
Workers not sharing in productivity growth
One of the salient features of the neo-liberal era has been the on-going redistribution of national income to profits away from wages. This feature is present in many nations.
This has occurred because real wages growth has lagged behind productivity growth and the extra real income produced as been expropriated by capital in the form of profits.
The suppression of real wages growth has been a deliberate strategy of business firms, exploiting the entrenched unemployment and rising underemployment over the last two or three decades.
The aspirations of capital have been aided and abetted by a sequence of ‘pro-business’ governments who have introduced harsh industrial relations legislation to reduce the trade unions’ ability to achieve wage gains for their members. The casualisation of the labour market has also contributed to the suppression.
That redistribution of national income to profits continues in Australia.
I consider the implications of that dynamic in this blog – The origins of the economic crisis. As you will see, I argue that without fundamental change in the way governments approach wage determination, the world economies will remain prone to crises.
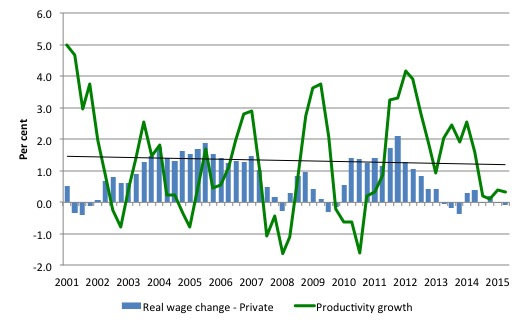
The next graph shows the annual hourly real wage change for the private sector (blue bars) and the annual hourly productivity growth (green line) since the March-quarter 2001. The black line is the trend productivity growth over the same time period.
Productivity growth has weakened in recent quarters after a few years of relatively strong growth, on the back of the fiscal stimulus.
Historically (for periods which data is available), rising productivity growth was shared out to workers in the form of improvements in real living standards. Higher rates of spending driven by the real wages growth then spawn new activity and jobs, which absorbs the workers lost to the productivity growth elsewhere in the economy.
The neo-liberal period marked a shift in that relationship as we discuss below.
Clearly, since the December-quarter 2011, the payoff to workers from the positive productivity growth has been absent with real wages growth lagging productivity growth.
Real wages and productivity growth – a massive redistribution to profits
To understand the significance of the gap between real wages growth and labour productivity growth the following points should be noted:
- Employment is measured in persons (averaged over the period).
- Labour productivity is the units of output per person employment per period (in this case per hour).
- The wage and price level are in nominal units; the real wage is the wage level divided by the price level and tells us the real purchasing power of that nominal wage level.
- The total economy-wide wage bill is employment times the wage level and is the total labour costs in production for each period.
- Real GDP is thus employment times labour productivity and represents a flow of actual output per period; Nominal GDP is Real GDP at market value – that is, multiplied by the price level. So real GDP can grow while nominal GDP can fall if the price level is deflating and productivity growth and/or employment growth is positive.
- The wage share in national income (GDP) is the share of total wages in nominal GDP and is thus a guide to the distribution of national income between wages and profits.
- Unit labour costs are in nominal terms and are calculated as total labour costs divided by nominal GDP. So they tell you what each unit of output is costing in labour outlays.
- Real unit labour costs are calculated by dividing Unit labour costs by the price level to give a real measure of what each unit of output is costing. RULC is also the ratio of the real wage to labour productivity and through algebra I would be able to show you that it is equivalent to the Wage share measure.
From the last point, if real wages growth is above productivity growth then RULC are rising, which is the same thing as saying that national income is being redistributed to wages (workers).
However, if real wages growth is below productivity growth then RULC are falling, which is the same thing as saying that national income is being redistributed away from wages (workers) to profits (capital).
It can get a little more complicated if the share that government claims changes but that is normally stable, which means the dynamics of national income distribution are between wages and profits.
From the last graph, we can see that RULC have been falling (gap between green and blue line widening) and national income has been redistributed towards profits since December-quarter 2011 (with a one-quarter exception).
The following graph shows the indexed growth in hourly real wages and labour productivity per hour since the December-quarter 1997 (the start of the Wage Price Index series).
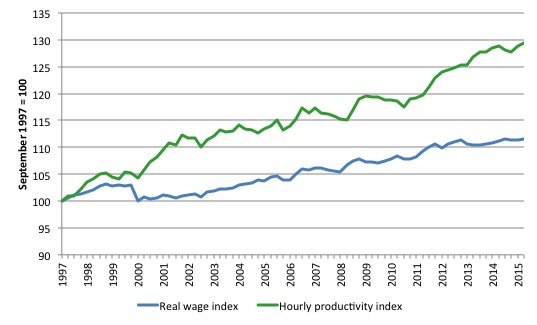
If I started the index in the early 1980s, when the gap between the two really started to open up, the productivity index would stand at around 180 and the real wage index at around 115.
Starting the index in the December-quarter 1997 produces a smaller gap, which just goes to show that one can manipulate data to achieve a range of ends (often quite contrasting) by altering the sample size.
What is clear is that since the December-quarter 1997, real wages have grown by only 11.6 per cent (so just over 0.6 per cent on average per year), whereas hourly labour productivity has grown by 29.3 per cent (or 1.6 per cent on average per year).
This is a massive redistribution of national income to profits and away from wage-earners and the gap is widening each quarter.
Where does the real income that the workers lose by being unable to gain real wages growth in line with productivity growth go? Answer: Mostly to profits. One might then claim that investment will be stimulated.
At the onset of the GFC (December-quarter 2007), the Investment ratio (percentage of private investment in productive capital to GDP) was 21.3 per cent.
It peaked at 23.9 per cent in the September-quarter 2013. But in recent quarters as the gap between real wages growth and productivity growth widens, the Investment ratio has fallen and in the June-quarter 2015 it stood at 21.1 per cent and falling.
The downward shift in the non-mining investment ratio is more stark than that.
Some of the redistributed national income has gone into paying the massive and obscene executive salaries that we occasionally get wind of.
Some will be retained by firms and invested in financial markets fuelling the speculative bubbles around the world.
For workers, the problem is that they rely on real wages growth to fund consumption growth and without it they borrow or the economy goes into recession. The former is what happened around the world in the lead up to the crisis (and caused the crisis).
The latter is more or less what is happening now.
One of the essential changes that needs to happen to ensure that another bout of financial instability doesn’t hit soon is that real wages have to grow in proportion with productivity growth – exactly the reverse of what is happening now.
Real wages growth and employment
Last week’s labour force data showed that employment growth was negative in the previous month (January 2015). However, in the last quarter 2015, employment growth was stronger (although the questionable ABS benchmarking and seasonal adjustment techniques definitely skewed the data).
With today’s moderate wages data, many mainstream commentators are claiming that the employment response is the result of the suppressed real wages growth.
This is a standard mainstream argument that unemployment is a result of excessive real wages.
The problem with this explanation, when applied to the recent Australian experience, is that wages growth has been moderate for several years now while employment growth has been zig-zagging across the zero line over the same period.
Further, there are question marks about the veracity of last month’s labour force data and I suspect there will be revisions to that result in the coming months.
Finally, both the flat wages growth and the poor employment growth for the last several quarters are responding to the weak overall spending in the economy.
Firms will not employ new labour, no matter how cheap it becomes, if they cannot sell the extra goods and services that would be produced.
The claim that real wage cuts or growth retardation is necessary to stimulate employment is never borne out by the evidence.
As Keynes and many others have shown – wages have two aspects:
First, they add to unit costs, although by how much is moot, given that there is strong evidence that higher wages motivate higher productivity, which offsets the impact of the wage rises on unit costs.
Second, they add to income and consumption expenditure is directly related to the income that workers receive.
So it is not obvious that higher real wages undermine total spending in the economy. Employment growth is a direct function of spending and cutting real wages will only increase employment if you can argue (and show) that it increases spending and reduces the desire to save.
There is no evidence to suggest that would be the case.
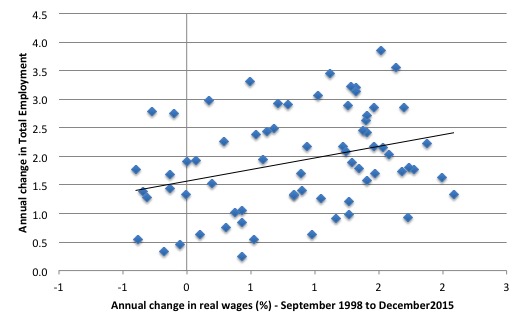
The following graph shows the annual growth in real wages (horizontal axis) and the quarterly change in total employment. The period is from the December-quarter 1998 to the December-quarter 2015. The solid line is a simple linear regression.
Conclusion: When real wages grow faster so does employment although from a two-dimensional graph causality is impossible to determine.
However, there is strong evidence that both employment growth and real wages growth respond positively to total spending growth and increasing economic activity. That evidence supports the positive relationship between real wages growth and employment growth.
Conclusion
Nominal wages growth is now at the lowest level since the Wage Price Index data series began (September-quarter 1997).
Depending on how we measure inflation, real wages growth is slightly negative or slightly positive at present but on any measure it is well below the labour productivity growth rate.
The slow wages growth is a cause and reflection of the slow growth in overall economic activity and employment. Workers are adopting a much more cautious approach to spending and firms will not lift the investment rate while sales are flagging.
The on-going subdued economic activity will also undermine the Government’s fiscal strategy, which can be summarised as squeezing net public spending out of the economy in the hope that in three years they will achieve a fiscal surplus.
That folly will be exposed. Economic growth will not be strong enough to match their assumptions and that means the growth in tax receipts will be less than assumed.
It would be better for the Government to stimulate the economy more now with larger fiscal deficits and then see the fiscal balance drop on the back of income growth.
Higher (and more reasonable) wages growth would both benefit from and provide support to such a fiscal strategy.
At the moment, we are in a race-to-the-bottom, which is nowhere any reasonable policy strategy should aim for.
Spain Tour May 2-13, 2016
I have received lots of E-mails about my upcoming lecture tour of Spain to promote the Spanish translation of my current book – Eurozone Dystopia: Groupthink and Denial on a Grand Scale.
Once the details are finalised I will post them. Currently, it begins in Granada, then Madrid, Badajoz, Barcelona, Valencia, Vila-real, and back to Madrid.
The blog during that period might be a little sporadic.
That is enough for today!
The OECD have advised governments to collectively offer accommodating monetary policy and invest public spending to stimulate the private sector and economic growth. I wonder if the collective governments will listen? I suspect not: ideologues have cloth ears.
Kathy Heyne,
Offsetting the good advice given by the OECD is the fact they are also advising ‘structural reforms’ which normally means lower wage growth and lower rights for workers.
Thanks, that was an interesting read. Are you saying that wages should be tracking labour productivity even though capital productivity has been heading south for most of this decade.
Damn CharlesJ!
I should have known it was too good to be true! Bloody euphemisms! I naively took “structural reform” to mean a move away from Surplus=Good; Deficit=Bad mindset.
I should have known better.
I suppose that’s the problem in a nutshell – the reason we vote against our interests – I’m a person who tries to treat all with goodwill, so I expect my government to govern the same way.
1.0 The low wages growth is a direct result of the low demand for labor.
2.0 The low demand for labor is a direct result of the government’s immigration policy which allows the highest intake of the OECD (excl Luxemborg).
[Bill notes: edited out unwanted link – supporting proposition 2.0]
Whilst Australia has had the benefits of immigration in the 50s and 60s when there were more jobs than people in the country, the same is not true now. Our multicultural nation has the benefits of culture, cuisine and outlook from past times immigration but its compounding a jobs shortfall lately and causing the investment driven Sydney and Melbourne housing boom which shuts youngsters our of the housing market.
Hi Bill,
In your wages vs productivity chart you have the gap opening up in roughly 2000. I’ve seen similar charts for the USA showing this happening back in the late 70s to early 80s. But I’ve noticed that the Treasury have a similar graph that shows wages are outstripping productivity, as does the ABS.
https://treasury.gov.au/speech/the-2014-15-budget-and-sustaining-broad-based-growth-in-living-standards/
What is causing this difference between the two and which is a better indicator?
Regards, Tyson.