Today (March 6, 2024), the Australian Bureau of Statistics released the latest - Australian National…
Australian national accounts – we are becoming poorer
Today, the Australian Bureau of Statistics released the – December-quarter 2015 National Accounts data – which showed that real GDP grew by 0.6 per cent in the three months to December 2015 (down from 1.1 per cent in the September-quarter. It was largely driven by Private household consumption (albeit declining) and public consumption and capital formation. Private consumption growth remained positive and contributed to growth, but it is being funded by a declining saving ratio and rising indebtedness. This was in the context of declining real wages growth and declining real net national disposable income overall and per capita. These trends are unsustainable. The government sector was responsible for 50 per cent of the total growth in the December-quarter. Without the public sector spending contribution, annualised growth would be at 1.2 per cent relative to pre-GFC trend rates of between 3 and 3.25 per cent. The negative growth in private investment means that potential output in Australia and future growth rates will be lower than otherwise. Again, not a positive sign. The other notable result was the increasing evidence that Australia continues to be in an income recession. Real net national disposable income fell by a further 0.1 per cent over the quarter and 1.1 per cent over the last year. The data continues to confirm that Australia faces a very uncertain outlook and with the annual fiscal statement coming up – now is not the time to be cutting net public spending.
The main features of the National Accounts release for the December-quarter 2015 were (seasonally adjusted):
- Real GDP increased by 0.6 per cent after recording a 1.1 per cent increase in the September-quarter (revised up from 0.9 per cent). The annual growth rate is 3.0 per cent, which is barely sufficient to keep unemployment from rising.
- The main positive contributors to expenditure were Household final consumption expenditure, which contributed 0.4 percentage points, and Public gross fixed capital formation, which contributed 0.2 percentage points to GDP growth. The ABS say that this reflects the “growth in Household final consumption expenditure is reflected in growth in the service industries of Information, media and telecommunications (2.7 per cent), Retail trade (1.0 per cent), and Arts and recreation services (2.2 per cent)”.
- The main negative factors were the decline in Private gross fixed capital formation of 1.9 per cent (New engineering construction detracted 0.6 percentage points from GDP growth).
- Our Terms of Trade (seasonally adjusted) fell by 3.2 per cent in the quarter and over the last 12 months they have fallen by a substantial 12 per cent.
- Real net national disposable income, which is a broader measure of change in national economic well-being fell by 0.1 per cent for the quarter and 1.1 per cent for the 12 months to the December-quarter 2015, which means that Australians are worse off (on average) than they were 12 months ago. In fact, Real net national disposable income per capita has declined for the last six successive quarters. This is the income recession that economists are now speaking about.
- The Household saving ratio fell to 7.6 per cent and is now moving towards levels that we saw before the GFC – flat wages are straining households who are resorting to credit to sustain consumption expenditure.
Overall growth picture – growth on the back of mining exports
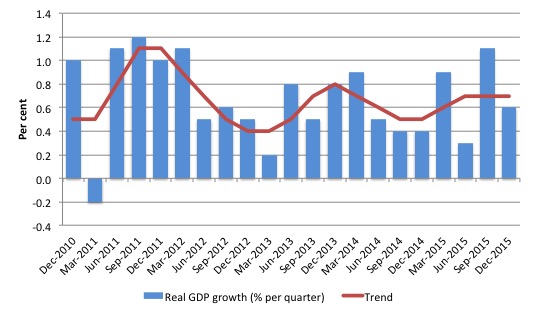
The following graph shows the quarterly percentage growth in real GDP over the last five years to the December-quarter 2015 (blue columns) and the ABS trend series (red line) superimposed. After the decline in trend growth was arrested by the fiscal stimulus in 2008-09 the decline in government support saw the dip in trend growth in 2010.
Initially, the growth in private investment associated with the record terms of trade and the resulting mining boom helped drive the new rise in trend growth which ended towards the end of 2013.
At present, trend growth is flat and actual growth is fluctuating as Household consumption expenditure and public infrastructure expenditure offset declines private investment expenditure and net exports.
The mining boom was thought to be in two stages. First, the investment boom as new productive infrastructure was being constructed (railways, ports, loaders, new sites etc). Second, the export boom that would result from the enlarged productive capacity. The second stage relied on continued growth in China to boost volumes and the prices remaining at elevated levels.
The problem is that China has now stepped down to a slower growth rate and our net exports now showing signs of volatility (see next section on contributions).
It is clear that commodity prices have peaked – our terms of trade are down 12 per cent over the last year and 3.2 per cent in the December-quarter.
This movement is being exacerbated by volume gluts in the world markets of the commodities that we export, which should continue to drive commodity prices down. The volume losses to exports in the last quarter is indicative of the world slowdown, however.
The overall assessment is that the Australian economy continues to grow but below trend, although there is now a debate going on with suggests that trend growth is now lower (around 2.7 to 2.8 per cent) than previously thought (around 3.25 per cent).
At any rate, annual growth of 3 per cent in the December-quarter is an overstatement of what is happening because it was inflated by the 1.1 per cent growth (revised upwards from 0.9 per cent) in the September-quarter.
The annualised quarterly growth rate from December 2015 is 2.4 per cent, which is closer to the current outlook.
Domestic wages growth is flat and real wages are falling. Household are driving consumption growth (albeit at declining rates) by reducing their saving out of disposable income (see later section), which means that private household indebtedness will also start to rise again.
With growth still below trend (however defined), now is not the time for accelerated policy austerity.
The opposite policy shift is needed – there is clearly a need for a further boost in the public contribution to growth to provide a boost to domestic demand (see next section).
Analysis of Expenditure Components
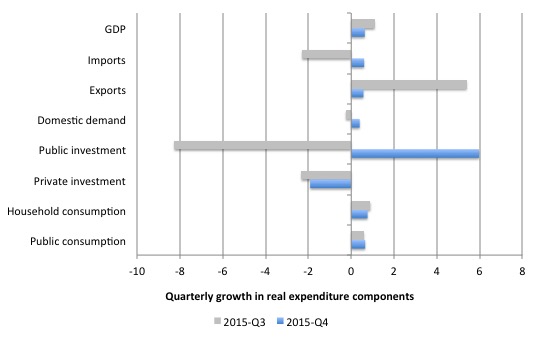
The following graph shows the quarterly percentage growth for the major expenditure components in real terms for the December-quarter 2015 (blue bars) and the September-quarter 2015 (grey bars).
Domestic demand rose by 0.4 per cent in the December-quarter 2015 as a result of continued (albeit slowing) growth in household consumption, a slight boost in the growth in public consumption spending (0.76 and 0.65 per cent, respectively), and a sharp increase in public capital formation (5.97 per cent growth).
Private investment continued to fall (-1.92 per cent) after a decline of 2.3 per cent in the September-quarter 2015 and any growth in exports (O.57 per cent) was more or less offset by import growth (0.6 per cent).
The strong performance with exports from the September-quarter disappeared indicating weakening world conditions.
Contributions to growth
What components of expenditure added to and subtracted from real GDP growth in the December-quarter 2015?
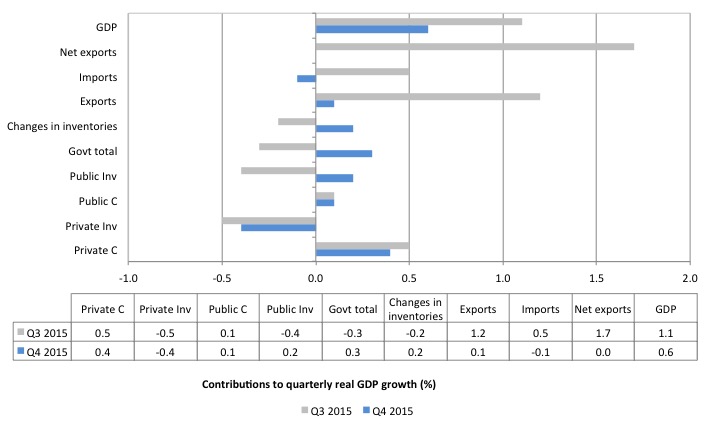
The following bar graph shows the contributions to real GDP growth (in percentage points) for the main expenditure categories. It compares the December-quarter 2015 contributions (blue bars) with the September-quarter 2015 (gray bars).
The strongest contributor to real GDP growth in the December-quarter 2015 were Private household consumption (0.4 percentage points), followed by Public capital formation (0.2 percentage points) and Public consumption (0.1 percentage points).
The overall contribution of the government sector to growth was 0.3 percentage points.
That is, the government sector contributed 50 per cent of the real GDP growth in the December-quarter 2016.
The overall contribution of private investment on growth continued to be negative (-0.4 percentage points), which confirms that the investment cycle associated with the mining boom is well and truly over and non-mining investment is not picking up the slack.
The strong contribution from Net exports in the September-quarter 2016 disappeared in the December-quarter, suggesting that world markets are tightening for commodity exports.
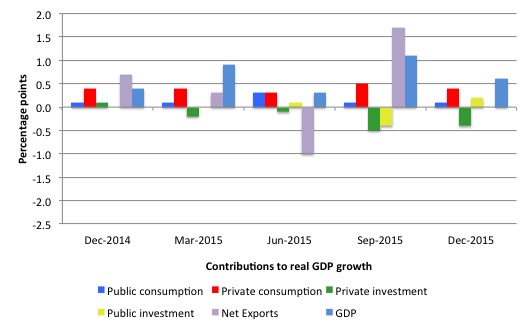
The next graph shows the contributions to real GDP growth of the major expenditure aggregates since the December-quarter 2014 (in percentage points). The total real GDP growth (in per cent) is also included as a reference.
Real GDP growth positive but real net national disposable income growth negative
The ABS tell us that:
A broader measure of change in national economic well-being is Real net national disposable income. This measure adjusts the volume measure of GDP for the Terms of trade effect, Real net incomes from overseas and Consumption of fixed capital.
While real GDP growth (that is, total output produced in volume terms) grew by 0.6 per cent quarter, real net national disposable income growth continued to fall – declining by 0.1 per cent in the December-quarter, which followed a 1 per cent decline in the September-quarter.
Real net national disposable income growth has been weak since 2011 and has been criss-crossing the zero line for the last three or so years.
Over the last year, real net national disposable income has declined by 1.1 per cent – which suggests that Australia is caught up in a “national income recession”.
Real net national disposable income per capita has shown positive growth in only one of the last seven quarters. In other words, Australians are poorer in income terms that they were at the beginning of 2014.
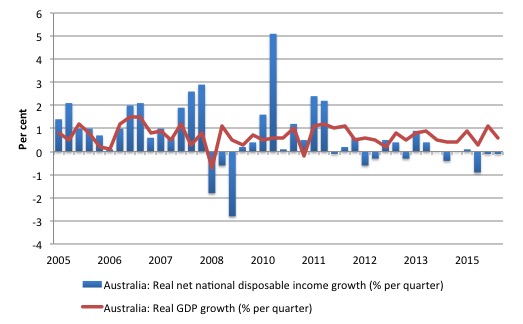
The following graph shows the evolution of the quarterly growth rates for the two series since the March-quarter 2005. You can see the divergence between real growth in output (and income that is generated by the economy) and the real net national disposable income (the real income Australians get) over the last few years.
So while the economy was pumping out mining exports at increasing volumes, Australian households were going backwards in real income terms.
The decline in real income has intensified as the mining contribution to real output growth has declined.
This subdued state is the result of the declining export prices manifesting in the significant decline over the last 12 months in Australia’s terms of trade and the flat wages situation.
In other words, our capacity (in real terms) to purchase imports has declined per unit of export and Australian workers are not sharing in productivity growth.
It means that Australians overall are poorer even though we are still producing more than 12 months ago.
This discrepancy is one reason why an export-led growth strategy will not necessarily increase the standard of living of domestic residents, even if it exports grow.
Household saving ratio falls sharply to 7.2 per cent
The squeeze on wages in Australia is manifesting in two ways. Rising indebtedness and falling saving out of disposable income.
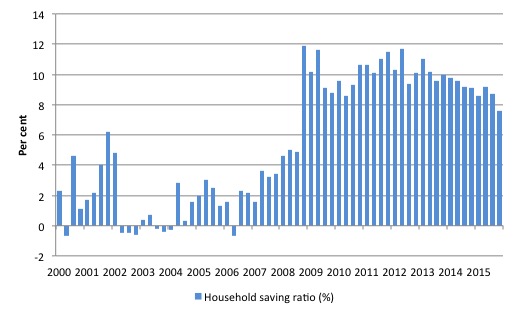
The following graph shows the household saving ratio (% of disposable income) from 2000 to the current period. The household saving ratio fell slightly in the December-quarter 2015 to 7.6 per cent. It has declined from 9.2 per cent in the June-quarter.
Further, even though Household consumption expenditure remains positive and helping maintain overall growth in the face of negative private investment and faltering exports, it is decelerating as a result of subdued real wages.
The decline in the Household saving ratio is a worrying trend.
After the GFC hit, the household sector sought to reduce the precariousness in its balance sheet exposed by the GFC.
Prior to the crisis, households maintained very robust spending (including housing) by accumulating record levels of debt. As the crisis hit, it was only because the central bank reduced interest rates quickly, that there were not mass bankruptcies.
In June 2012, the ratio was 11.6 per cent. Since the December-quarter 2013, it has been steadily falling as the squeze on wages has intensified.
While the recent trend is downwards, it is unlikely that households will return to the very low and negative saving ratios at the height of the credit binge given that the household sector is now carrying record levels of debt.
At some point, household consumption growth will fall unless growth is supported by public spending (given the poor outlook for private investment and net exports).
This also means that government surpluses which were strong>only were made possible by the household credit binge are untenable in this new (old) climate. The Government needs to learn about these macroeconomic connections. It will learn the hard way as net exports weaken if it tries to impose austerity.
Real GDP growth and hours worked
Over the last several years, there has been the sharp dislocation between what is happening in the labour market and what the National Accounts data has been telling us.
Growth in employment and hours worked has been very modest over the period while annual real GDP growth has been between 2 to 2.5 per cent but falling.
Today’s data shows that GDP per hour worked fell dramatically in the December-quarter 2016 (-0.6 per cent) which is the reason growth in hours worked rose sharply (1.3 per cent) and was more than twice the real GDP growth rate (0.6 per cent).
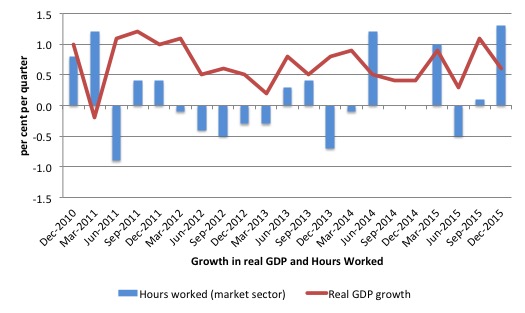
The following graph presents quarterly growth rates in trend GDP and hours worked using the National Accounts data for the last five years to the December-quarter 2015.
You can see the major dislocation between the two measures that appeared in the middle of 2011 persisted throughout 2013 and has reasserted itself in the last two quarters.
Just in case you think the labour force data is suspect, the hours worked computed from that data is very similar to that computed from the National Accounts.
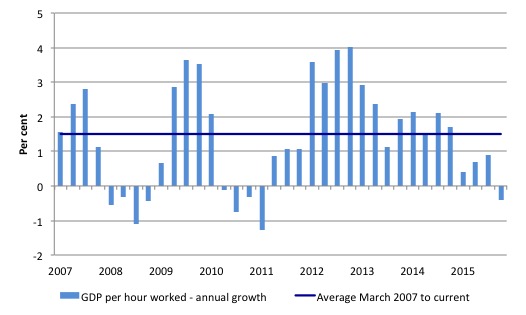
To see the above graph from a different perspective, the next graph shows the annual growth in GDP per hour worked (so a measure of labour productivity) from the March-quarter 2007 quarter to the December-quarter 2015. The horizontal blue line is the average annual growth since September-quarter 2007.
The relatively strong growth in labour productivity in 2012 and the mostly above average growth in 2013 and 2014 helps explain why employment growth has been lagging given the real GDP growth. Growth in labour productivity means that for each output level less labour is required.
In the December-quarter 2015, annual labour productivity growth was -0.4 per cent (well below the recent average of 1.5 per cent).
Over the last year, labour force growth has average about 1.6 per cent, while productivity growth has averaged around 0.4 per cent. This means that real GDP has to grow by around 2 per cent before the unemployment rate will start to fall (not considering short-term cyclical fluctuations in hours worked or participation).
Conclusion
Today’s National Accounts data indicates that while the Australian economy continues to grow, the annual rate of growth is still well below trend, which explains why unemployment has been stuck at elevated levels for the last few years.
The main contributors to growth were Private household consumption (albeit declining) and public consumption and capital formation.
Private consumption growth remained positive and contributed to growth, but it is being funded by a declining saving ratio and rising indebtedness. Neither trend is sustainable.
The government sector was responsible for 50 per cent of the total growth in the December-quarter.
Growth in domestic demand was relatively weak as a result of the continued decline in private nvestment expenditure, which is undermining future prosperity.
The negative growth in private investment means that potential output in Australia and future growth rates will be lower than otherwise. Again, not a positive sign.
The other notable result was the increasing evidence that Australia continues to be in an income recession with real net national disposable income continuing to decline.
Taken together, the future is very uncertain and with the annual fiscal statement coming up – now is not the time to be cutting net public spending.
That is enough for today
“the future is very uncertain” – indeed,it has been ever so.
But there are certainties – death,as always. Also infinite growth as understood by most economists and the true believers in the SYSTEM is certainly not a certainty.
When this is understood and acted upon by the players in the SYSTEM then there might be some hope for Homo Saps. Not before.
While it is not the time to be cutting public spending, statements Osborne has made recently strongly indicate that he might continue doing just that. Does this suggest some kind of odd integrity, or something else?
Note that using annual data, the increase in real GDP in 2015 was 2.5%, but there was a clear increase in momentum in the second half as evidenced by the year-on-year quarterly data that printed at 3% growth. The income recession is largely driven by the fall in the terms of trade, which is mostly out of our hands. I don’t think conditions are as grim as Bill makes them out. But it was pleasing to see public investment make a come back. The reduction in savings is an indication of improved sentiment…let’s see what damage the May budget can do to this. Cheers!
Larry. Osborne has been talking about “living with our means” again. By which he thinks that the UK must spend only what it receives in taxation. As the Tories are hard-wired not to increase taxation the only thing he can do is to reduce spending. He is committed by law to acheiving a surplus in 2020, and as he cuts spending so GDP will decrease, unemployment will rise, ergo taxation will fall, ergo spending will be cut further accordingly. On the news last night there was an item that said Berkshire Council will be spending only on what they are legally obliged to do henceforth. So there will be only one library in the whole of the county and all disabled day centres will be closed. Wiltshire County Council have withdrawn free bus passes. It won’t be long before benefits are cut too, and that includes pensions (of which I am a recipient).
Yesterday Bill called our leaders imbeciles. You could hardly apply such a term to Osborne, for example, as a man who is a history graduate from Oxford University. Imbeciles do not get degrees. He is either misguided (if you want to be charitable) or he has a completely different agenda to that for which he was elected.
Democracy? Pah!
Nigel Hargreaves – “Imbeciles do not get degrees”.
On which exo-planet are you currently residing?
Dear Bill and others:
Off the specific topic but of general interest and may be a source of research funding:
http://mobile.nytimes.com/2016/03/03/technology/plan-to-fight-robot-invasion-at-work-give-everyone-a-paycheck.html
Perhaps an application to the Sam Altman referred to may be worthwhile. It is likely that most of the stuff he will receive will be off -base, but the article raises the question of, Why not now?
These issues seem to be the major thrust of your long term research interests and expertise.
Best regards,
Jim
Thank you for your insight Bill. I really enjoy reading your blog.
One of my duties in my current position at an investment firm is to send out articles each week summarising what’s happening in our economy. Unfortunately, many people only seem to want to hear the positive. I’ll continue to push the truth.
Love your work.
I’m new here and have a lot of catching up to do, so please be patient.
Being a Western Australian and thus about to go to the polls twice in the next year or so. I would appreciate a brief explanation of the difference between the debt incurred by the State Govt and that of the Federal Govt. So far I have understood that the fiat currency means that the Feds don’t incur debt in the same way as a household so where does a State Govt sit? If it borrows off the Feds can it treat the deficit as a creator of net financial assets?
Thanks
I just found the “Tax payers do not fund anything” blog – Question answered.
Regards
Jim
if we are becoming poorer then how is it we have more disposable income than ever before ???? (according to website trending economics).