It was only a matter of time I suppose but the IMF is now focusing…
Irish national accounts – smoke and mirrors really
Last week (July 12, 2016), the Irish Central Statistics Office published updated – National Income and Expenditure Annual Results – which revealed that between 2014 and 2015, the economy grew by a staggering 26.3 per cent (while the implied inflation rate was 6.1 per cent – difference between GDP at current prices and GFP at constant (2014) prices). They had earlier estimated (based on incomplete data) that real GDP would grow by 7.8 per cent between 2014 and 2015. So quite a difference. In expenditure terms, the CSO, estimated that “exports grew by 34.4%” and “Gross physical capital formation” grew by 26.7 per cent between 2014 and 2015. Over the last several months, I have received many unsolicited E-mails from people I don’t even know, suggesting I might bring my blog to an end because I am quite obviously incompetent. The reason: I maintain that Ireland is not a poster child for austerity. So do these startlingly positive National Accounts data suggest that my critics are on the ball. Does it prove that that austerity has turned Ireland around. Well, it doesn’t prove anything of the sort. What it actually ‘proves’ is the familiar proposition that if you add something large to something small and express the change in percentage terms the result will be large. That is what the latest national accounts results demonstrate. A closer examination of the results then tell you what that ‘large’ thing is, which leaves one to conclude that Ireland hasn’t made very much progress at all. Okay, so you can now stop sending me E-mails lecturing me about how stupid I am and look in public! Thanks.
I last wrote specifically about Ireland in this blog (December 24, 2105) – Ireland demonstrates that fiscal deficits promote growth.
I noted that while the Irish Central Statistics Office (CSO) National Accounts estimates at the time showed that on an annual basis, real GDP increased by 6.8 per cent in the September-quarter 2015 and real GNP increased by 3.2 per cent over the same period
It was clear that Ireland was leading the Eurozone at present in terms of real economic growth.
This leads to the claim that Ireland defies those who (like me) claim that austerity is flawed strategy.
My response was that it is difficult to hold out Ireland as an example of austerity-led growth because Ireland is, in fact, a rather strange Eurozone Member State, and is more firmly plugged in to the Anglo world than other Eurozone nations.
While the Irish government was suppressing domestic demand through austerity from as early as 2009, significant trading partners (such as, Britain, the US and China) were maintaining expansionary fiscal positions, which allowed Ireland to resume growth.
Further, a narrow focus on the growth cycle misses significant aspects of national prosperity. Even with two years of economic growth, real earnings growth remained flat to negative, the rate of enforced deprivation remained around 30 per cent, and there was a rising proportion of people at risk of poverty.
On top of that, net emigration of skilled workers continues, which means that the official unemployment rate is much lower than it would have been if these workers had not left the country.
Last week, the CSO published its latest revisions to the 2014 and 2015 National Accounts, which as the introduction revealed showed that between 2014 and 2015:
- GDP at current prices rose by 32.4 per cent.
- GDP at constant (2014) prices (that is, real GDP) rose by 26.3 per cent.
- GNP at current prices rose by 24 per cent.
- GNP at constant (2014) prices rose by 18.7 per cent.
What?
The CSO explained that the “present release is based on more complete and up to date data”.
Previously, they had estimated that real GDP would rise by 7.8 per cent and real GNP would rise by 5.7 per cent.
So this new data has had some effect!
The results were so bizarre that they followed up the release with another Press Statement (July 12, 2016) – GDP increases significantly in 2015 – Explanatory Note.
We learned that the CSO is incorporatng the “newest tranche of data sources … into the National Accounts results for 2015 and prior years, including corporation tax data, structural statistics and commodity flow validated data”.
What does that mean?
It means that the national statistical agency is now using new data sources that have been available since the last-quarter 2015 which include Source:
– Latest Revenue tax files
– Commodity flow estimates
– Structural Business Survey Data – CIP, ASI, Prodcom
– Insurance Statistics
They have also made some methodological changes in the classification of the contribution of “Financial Services”.
Essentially, the new transactions now included and the reclassifications of economic activity have seen a massive boost to the estimated “Gross Capital Stocks” in Ireland and with a huge increase in capital assets this has led to the CSO dramatically revising investment estimates has been pushed upwards.
Investment expenditure is the flow that adds to the capital stock. So by revising the estimates of capital assets upwards, to be stock-flow consistent, the flows also have to be revised upwards.
This has flow-on effects because it also leads to increased estimates of depreciation (used up capital) and increased profits.
Between 2014 and 2015, the Value Added index for the “Industry Sector” rose from 100 to nearly 200 as a result of these changes.
The CSO explains that the reason the data looks so odd (not their words) in this revised form is because:
– There is an increase in the number of new aircraft imports into Ireland for international leasing activities.
– Corporate restructuring both through imports of individual assets and also reclassifications of entire balance sheets in 2015 means that the level of capital assets in Ireland increased dramatically compared to 2014.
What does that mean?
Quite simply that there has been a rise in the number of aircrafts that have been sent to Ireland to be leased back to international carriers.
And, corporate balance sheets have been boosted by what is known as ‘tax inversion’, which just means that a corporation relocates its ‘legal domicile’ to some tax haven or lower tax nation (usually by purchasing some small company) but leaves its main operations somewhere else where they actually produce things and employ people.
Ireland has been busy offering US and other companies its 12.5 per cent corporate tax rate (compared, say to the US rate of 35 per cent).
In 2015, several large companies took the bait.
One deal that was floated in 2015 was for the US pharmaceutical company Pfizer to acquire the Ireland-based Allergan at well above market value. It was prepared to pay well over the odds because of the tax breaks it would get as a result.
To demonstrate the power of the state over multinational corporations, the deal was scrapped in April 2016 after the US Treasury announced it was changing rules to militate against these inversions. Pfizer were forced to “pay Allergan $150 million to reimburse expenses from its deal” (Source).
Reuters reported that “The decision to call off the deal came in part because Pfizer was concerned that any tweaks to salvage its deal with Allergan might have provoked new rules by the Treasury”.
Further, there is an OECD project – Base Erosion and Profit Shifting (BEPS) – which will also make it more difficult to use tax inversion deals.
So when you start running the line that global corporations have rendered the nation state irrelevant – think again.
That was not an isolated case. Reuters reported that another large US company abandoned a take over of an Ireland-based company in pursuit of an inversion strategy after the Treasury Department refined rules specifically to make it unviable.
But there have clearly been notable takeovers of Irish companies that have skewed the National Accounts estimates.
On such deal was the takeover of the Irish firm Covidien of the World’s largest medical technology company (Medtronic) that has its legal headquarters in Dublin but its operational headquarters in Fridley, Minnesota.
When Medtronic absorbed Covidien its “market capitalisation was about USD100 billion” ((Source).
To put that into perspective and see why the impact on the Irish National Accounts has been so huge, the Irish times reported that:
The company will have a market capitalisation of around $100 billion when trading opens in New York. That compares with the $18.4 billion value of Ireland’s largest indigenous business, CRH, which accounts for 22 per cent of the entire Irish Stock Exchange main list.
In one “$US49.9 billion acquisition”, the American (now Irish) company became “Ireland’s largest company”.
How does this affect Ireland’s National Accounts?
Well in one fell swoop, corporate profits recorded in Ireland gets a massive boost via the annual earnings of Medtronics which is classified as production for Ireland and recorded as part of GDP.
These impacts provide largely illusory ‘gains’ for Ireland and its citizens.
In its press release – Ireland’s Economic Growth Figures – the CSO notes that the estimates:
… accurately capture and highlight the open and globalised nature of the Irish economy.
However due to the highly globalised nature of our economy, GDP and GNP do not always help to understand what is happening in the Irish economy.
It further said that:
Notwithstanding the fact that we will continue to comply with international data standards for compiling and reporting GDP and GNP, due to the highly globalised nature of the Irish economy and the continuing challenges that this presents, the CSO intends to convene a high-level cross-sector consultative group.
In other words, it realises the figures being published present credibility problems and desire to develop other measures which “would best help to provide insights”.
What happened essentially is:
1. A large company relocated its ‘balance sheet’ to Ireland.
2. Given its size and the size of the Irish economy, the relocation pushes up capital stock estimates and Ireland’s international investment position.
3. The consequence is that real GDP via investment and exports boom.
Result: massive distortion of reality.
And of 2016? Well the results are not so good.
To understand the difference between GDP and GNP, which is particularly relevant for Ireland, please see – Ireland demonstrates that fiscal deficits promote growth
The two concepts are defined as such:
- Gross domestic product (GDP) is defined as the market value of all final goods and services produced in a country in any given period.
- Gross National Product (GNP) is defined as the market value of all goods and services produced in any given period by labour and property supplied by the residents of a country.
GNP is a more reliable measure of the benefits of production accruing to the Irish people.
GNP is equal to GDP plus Net Factor Income from the rest of the world (NFI) which is:
Net factor income from the rest of the world (NFI) is the difference between investment income (interest, profits etc.,) and labour income earned abroad by Irish resident persons and companies (inflows) and similar incomes earned in Ireland by non-residents (outflows).
So if GDP is growing more strongly than GNP it means that flows of income are leaving the nation and accruing to foreign owners of assets in Ireland.
A significant portion of the pre-crisis growth in Irish GDP was just transfers of profits abroad, as a result of the heavy presence of foreign companies with head offices in Ireland.
The following graph shows quarterly growth rates in real Gross Domestic Product (GDP) and Gross National Product (GNP) from the first quarter 2008 to the March-quarter 2016.
The pattern of real GDP growth consolidated in the March-quarter 2014 although no consistent pattern for real GNP has been established and growth was negative in the most recent quarter.
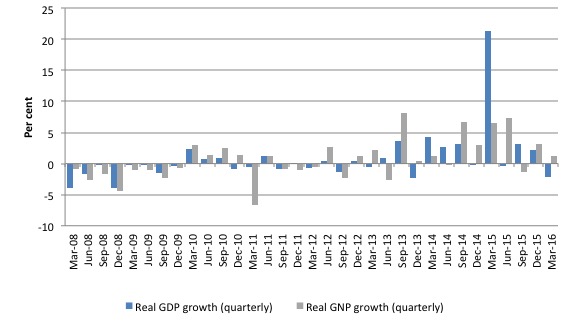
The NFI data has become so volatile after the reclassifications etc that it is difficult to get a handle on it.
For example, in the March-quarter 2016:
1. Real GDP growth was negative at -2.1 per cent.
2. NFI fell from -14,219 million euros in the December-quarter 2015 to -10,242 million euros in the March-quarter 2016.
3. Real GNP thus grew by 1.3 per cent in the March-quarter 2016, reflecting that Ireland pumped out less income to foreigners in the March-quarter than it did in the previous quarter.
But Industry output fell by 11.1 per cent in the March-quarter 2016 and real GNP hasn’t moved much in raw terms since the middle of last year.
Once again, we have to be careful in interpreting these results because they are being computed off the dramatically altered base inflated by the changes in 2015. It is the reverse effect of large on small!
Employment in Ireland
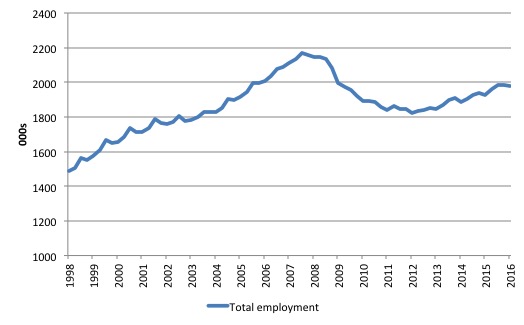
To gauge how Ireland is really faring we can look at what is happening with employment. The following graph shows total employment from the March-quarter 1998 to the March-quarter 2016 (latest available).
Total employment peaked at 2169.6 thousand in September-quarter 2007 and in the March-quarter 2016 it was 1976.5 thousand, some 193 thousand lower.
In other words, for all the so-called Irish recovery – they have still not produced sufficient jobs in net terms to get back to the pre-crisis levels.
And growth is faltering!
The following graph shows the quarterly employment growth in Ireland (per cent) from the peak-quarter (September 2007) to the March-quarter 2016.
Since the September-quarter 2015, total employment in Ireland has contracted – zero growth in the December-quarter 2015) worsening to -0.3 per cent in the first-quarter 2016.
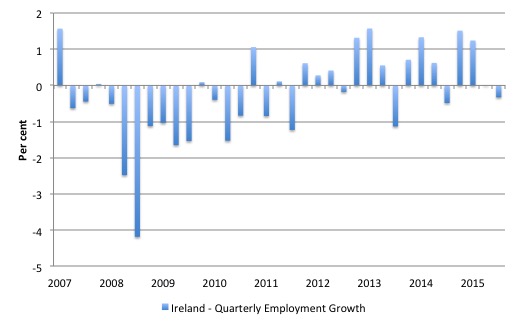
Even as real GDP was being published as growing by 26.3 per cent between 2014 and 2015, total employment growth was only 2.6 per cent.
In this blog – Ireland demonstrates that fiscal deficits promote growth – I also summarised the most recent results from the – Survey on Income and Living Conditions (SILC) 2014 – published by the CSO on November 26, 2015.
A commentator from Social Justice Ireland said (Source:
These figures provide conclusive evidence that, despite what we are being told, Government policy has failed to protect our society’s most vulnerable, or to significantly ease their difficult circumstances.
Government did have choices. The choices it made produced five regressive budgets in a row which has resulted in 1.3m people experiencing deprivation and three quarters of a million people living in poverty.
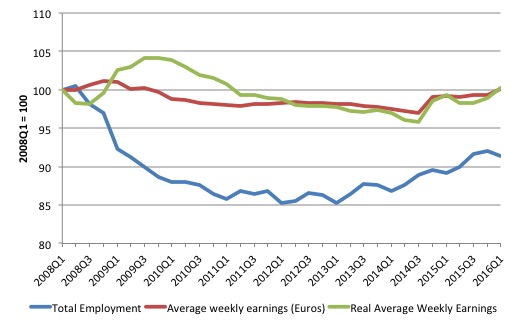
The most recent data on employment, average weekly earnings (in euros) and real average weekly earnings, all indexed to 100 in the March-quarter 2008 is shown in the following graph.
The data shows that wages growth (in real and nominal terms) has only just returned to the pre-crisis levels, and with employment still 8.7 per cent below the level it was at the peak, means that the workers are not sharing proportionally in the real growth that has occurred in the Irish economy over the last several years.
Conclusion
Ireland’s recent growth miracle is largely smoke and mirrors.
The underlying data that pertains to the prosperity of the people is still not suggesting that the negative effects of the crisis have been expunged.
A lot of big, wealthy foreign companies may be benefiting but that is not translating very much into benefits to the workers and their families.
And if the Brexit vote and its aftermath is handled badly by the policy makers and Britain goes backwards (perhaps into recession) then Ireland’s performance will quickly deteriorate further.
Upcoming talk at the New International Bookshop in Melbourne – August 4, 2016
On August 4, 2016, I will be giving a talk at the New International Bookshop in Melbourne (Australia) on the topic – The demise of the Left and towards a Progressive Left Manifesto – which is the topic covered in my latest book project that is nearing completion.
The talk will run between 19:00 and 20:30 and the venue is at 54 Victoria St, Melbourne, Australia 3053 – which is part of the Victorian Trades Hall.
There is a Facebook Page for the event.
The Bookshop is staffed by volunteers who appreciate any support they can get.
I spent many hours in my youth sifting through all sorts of radical books in its previous incarnation as the International Bookshop (operated by the now defunct Communist Party of Australia) in Elizabeth Street, Melbourne.
When I was a university student without much cash at all one – great staff member – there used to give me an orange on a regular basis – she always had one available and I guess she knew I haunted the place.
Here is the flyer. It would be great to see people at the event and the small entry fee goes to helping sustain the Bookshop, which has a long history in providing alternative and radical literature to Australian readers.

That is enough for today!
(c) Copyright 2016 William Mitchell. All Rights Reserved.
Thanks Bill
Quite timely at the moment given a few people here are talking up the Irish ‘austerity success’.
On a more general theme, I am trying to square the circle between the bank of England’s paper on money creation and MMT.
The paper talks about 97% of the uk money supply being demand deposits created by banks and the rest notes and coins. MMT talks about govt spending in terms of the govt crediting bank accounts with ex-post bond sales to drain reserves. This to me would indicate that the 97% figure is inaccurate?
Any thoughts would be appreciated.
Scott Enger
It doesn’t really matter whether it is 97% or 9.7% or 0.97% It is spending that largely controls the economy not “the money supply”. There are so many different ways of defining that in any case. The 97% figure you mention is just an indication of who owns the IOUs we use which we call money. Providing the owners are good for it it really doesn’t make any difference who they are.
Imagine you are playing Poker. You could be in a game where everyone was using BoE notes or you could be in a game where everyone was using chips supplied by the Casino, or even matchsticks which represent a certain amount. It really doesn’t make any difference at all providing the Casino or the matchstick owners make good their promise to exchange chips and matchsticks for “real” money when needed.
For a slightly more technical explanation see:
http://www.3spoken.co.uk/2014/11/the-sovereign-money-illusion.html
Scott-that’s an interesting question. Some argue that because Government tries to match its spending with bonds every time the Government spends it is matched with an equivalent removal in bond purchases but this leaves me with some questions:
1) how parallel are the Government bond sales with the actual spending ?
2) Do banks really create new money as at some point it has to be paid back with interest (unless the liability is written off)?
3) is there a stock flow model that could crunch these numbers so that for a given period we could say: X amount of new money gas been created by Gov+banks?
Nigel Hargreaves who comments on this site has done some number crunching on this, so he may have a response.
So, GDP grew by 26.3% and employment by only 2.6%. I suppose that the productivity of the Irish must have increased by 23% in one year! Every country should send some economists to Ireland to see how such a miracle can be performed.
Regards. James
Petermartin2001. Very well put. I hadn’t thought of using the matchsticks analogy.
Simonsky. I tried to do some analysis of this but was thwarted by more smoke and mirrors. The 97% figure actually consists of some bank created money and some govt created money. You can’t tell the difference between the two as it is all the same money. But as the govt matches its spending with bond sales, if you work out how much lending by banks there has been in a given period it comes to the same as the increase in the money supply, so you would be forgiven for thinking that 97% of money is bank-created.
The matching of spending with bond-issuance is done an a daily basis (in the UK, I can’t speak for other countries). Here the Debt Management Office gets figures on how much spending there has been on a particular day and issues bonds of an equivalent amount for the Bank of England to auction. (In the US I do know that bond auctions are carried out by Goldman Sachs for, no doubt, a fee).
My take is that banks in fact don’t create money at all. As you quite correctly point out the money is paid back at some time, unless the borrower defaults. So the banks are lending money that they expect to receieve in the future (from the borrower). It’s just how accrual accounting works.
I do stress I am not an economist, but I have researched all I say very thoroughly. Anybody who disagrees is welcome to try to put me right.
Scott,
I think for the US it must be based on some kind of Rube Goldberg calculation that subtracts income taxes from federal spending alone even though taxes logically accrue against all spending regardless of the source. Or some other artificial methodology unrelated to spending.
If you subtract all income taxes accrued over history from all federal spending, then exclude bonds held by the public from the ‘money supply’, then there’s only a few $Trillion left in comparison to the credit outstanding of about $50T. That leads to a percentage of ~96%. That may not qualify as ‘money supply’ I don’t know.
The term ‘money supply’ seems rather meaningless in the context of spending as others here have implied. The important metric is the rate of increase of the money supply, not the level.
In the US since WWII federal spending has increased at an average annual rate (nominal) of 7%. Since 2010 it’s grown at a rate of about 1%. How can we expect an economy to grow under these conditions?
At any rate most of the dollars in existence today are owed to the banking system so it would seem that in that context the 97% number makes sense.
This “using new data sources” an EU thing, i.e. it’s a general change of how EU countries compute GDP?
I got something in the back of the head that there should be changes that could change parts of GDP so to say in a cosmetic way in the break.
Bill,
Have you seen Andy Haldane’s very recent analysis of the UK’s economic ‘recovery’?
http://www.bankofengland.co.uk/publications/Pages/speeches/2016/916.aspx.
An excellent & thoughtful piece.
Nigel Hargreaves, I don’t think I agree with your statement that banks don’t create money at all. My understanding is that at the time a bank issues a loan, money, or at least effective demand at that point in time is increased for the borrower without anyone else’s money or effective demand being decreased. I am not sure why the fact that the bank expects to get this money back at the end of the loan would change that the money has been created for the time in between loan issue and loan repayment. Of course, I am no expert either and I may be misunderstanding you to begin with.
Nigel, Jerry
It is my understanding that loans create deposits.
If I was to borrow $200 000 to buy a house that $200 000 ends up as a deposit in the sellers account. The sellers bank then has its reserves increased by 200 000 and my bank has created an asset for which it derives income from (interest payments) It is then the banks job to ensure its account at the reserve is in surplus. (The banks accumulated deposits + a bit more)
I think that borrowing increase the money supply. It’s almost like government spending but the difference being it also creates a liability. When the government spends there doesn’t have to be a liability.
Wait, I just had a thought.
I may be wrong. It is up to the CB to ensure there is enough funds in the system to ensure the banks are able to meet reserve requirements by buying debt. A bank can always go to the CB to meet requirements.
Thanks for all the replies,
Just digesting..
I don’t think Bill has ever argued that austerity will, for a short period, slow the growth in real GDP. The important issue is whether the growth has been debt-financed by the non-government sector, which it must be during a period of austerity unless the nation in question net-exports its rocks off, which is a very costly way to finance non-government sector spending (exports are costs and imports are benefits). Unlike a currency-issuing central government, which can run deficits forever, the non-government sector cannot continue to debt-finance its spending. Hence the growth in real GDP, should it occur, can be nothing more than a temporary phenomenon prior to the inevitable collapse of private-sector spending (aka 2008).
Jerry (if you are still monitoring this stream). I’m really using my accountant’s brain and, as I said, it is how accrual accounting works. As Bill said at the London meeting, money doesn’t really exist at all anyway. If you take a holistic view of the economy my way works. It’s a bit like the Theory of Relativity – something that happens today affects something in the future of the space-time continuum. And something in the future is affecting what is happing today. The trouble is our human brains can only appreciate what is happening this second. Bear in mind that bank accounts are only records and “money” is a method of recording economic activity – the unit of account.
Scott,
MMT regards government bonds (interest-bearing money) and ordinary money as interchangeable. So when government runs a deficit they are adding ‘net financial assets’ (money) to the rest of the economy, most of which is then exchanged for government bonds (interest bearing money) by financial agents on behalf of businesses and households. So both ordinary money and government bonds are net financial assets.
So if you see government bonds as another form of money, then you see that in one form or another, the government’s deficit adds ‘money’ to the rest of the economy.
Banks create money temporarily in the form of a loan, and when the principal of the loan is repaid, the money disappears again into nothing. So money is not created on a ‘net basis’ through bank lending. When more money is loaned out than principal is repaid then ‘broad money’ in the economy increases, and this is confusingly called ‘Net Bank Lending’, even though no net financial assets are being created
I tend to skip the difference between ‘financial assets’ and ‘net financial assets’ when talking to ordinary people, though it is quite an important distinction when we see that ‘Net Lending’ can reach a stage where it becomes financially unsustainable, unlike Net Government Spending (the fiscal deficit).
Kind Regards