We sometimes encounter commentary that blows away the smoke that provides cover for important myths…
Growth outlook deteriorating – and don’t blame the Brexit vote
Last week, National Accounts data for the June-quarter 2016 was published for the US and the Eurozone and we learned that the next slowdown is happening now, even though neither economy has yet fully recovered from the last downturn (the GFC). Data from the UK is similarly poor, which suggests to me that the Brexit hoopla (where everything bad is blamed on the Exit vote success) is misplaced. In the case of the US, there is now a marked slowdown underway and the growth rate has been in decline since the March-quarter 2015. Private consumption expenditure remained strong and there was a substantial decline in the personal saving ratio as households spent a much higher proportion of their disposable incomes to fund their growing consumption. The other standout result was the decline in Private capital formation (investment), for the third consecutive quarter and the fact that its rate of decline is accelerating signals a lack of confidence in the medium-term outlook by business firms. The government sector also undermined growth in the June-quarter 2016. With inflation still well below the implicit central bank target rate (2 per cent) and growth is faltering the outlook suggests that the federal government will need to increase its discretionary fiscal deficit to stimulate confidence among business firms and get growth back on track.
US and Eurozone comparison
In the Eurozone, austerity caused the stagnation and the Eurozone remains locked into a struggle with deflation and stagnant economic growth which is not being driven by capital formation, thus underpinning growth in potential GDP as well as supporting current spending.
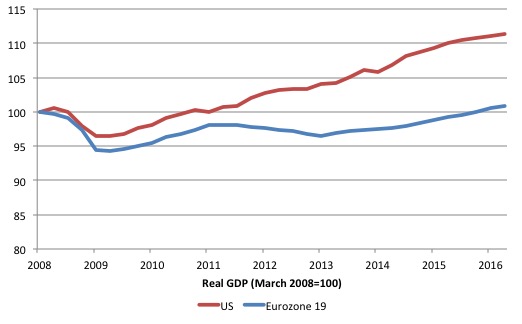
Consider the following graph. The first shows the evolution of real GDP indexed to 100 at March 2008 for the Eurozone 19 Member States and the US up to the June-quarter 2016.
The initial downturn was similar in speed and ferocity for both economies, with the Eurozone trough 2 per cent deeper.
The early fiscal stimulus in Europe (driven by both some discretionary measures and the operation of the automatic stabilisers) saw some positive growth response and for a time (from a lower base), both economies were growing at about the same rate.
But that is where the similarity ends. The Eurozone growth was curtailed by nothing other than the bloody-minded incompetence of Brussels as they imposed the Stability and Growth Pact (SGP) rules (more or less) and fiscal austerity was prioritised.
It took until the December-quarter 2015 (31 quarters) for the 19 Eurozone Member States to finally pass the March 2008 peak and after 33 quarters (June-quarter 2016), the aggregate Eurozone real GDP is only 0.8 percentage points above that peak.
So the Eurozone bloc endured cumulative real output losses for 7.75 years and now the world is approaching the next cycle. The rate of real GDP growth slowed again in the June-quarter.
In contradistinction, is the performance of the US economy, even though by any standards its recovery has been pretty weak.
Compared to the Eurozone growing by only 0.8 percentage points between the March-quarter 2000 and the June-quarter 2016, the US economy grew by 11.3 per cent.
However, the gap between the two large economies, which accelerated as Brussels killed growth in 2011, has now remained steady as both economies start slowing down.
I will consider the Eurozone data more specifically another day when the more detailed Member State breakdowns are available.
US economy – what is going on?
On July 29, 2016, the US Bureau of Economic Analysis released their ‘Advance Estimate’ of – Gross Domestic Product, Second Quarter 2016 – which showed that the June-quarter real GDP growth estimate was slightly above the March-quarter outcome (0.3 per cent compared to 0.21 per cent).
However, on an annualised basis, the US economy slowed rather appreciably to 1.2 per cent per annum in the June-quarter 2016 (down from 1.6 per cent in the March-quarter 2016).
Compared to the corresponding quarter last year (June 2015), when the annualised real GDP growth rate was 3 per cent, the 1.2 per cent result in the June-quarter 2016, is a significant deterioration.
In fact, the peak real GDP growth rate was 3.3 per cent in the March-quarter 2015, and each subsequent quarter since has seen a deterioration in the performance of the US economy.
The following sequence of graphs captures the story.
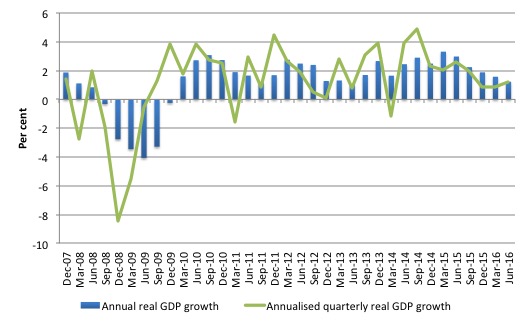
The first graph shows the annual real GDP growth rate (year-to-year) from the peak of the last cycle (December-quarter 2007) to the June-quarter 2016 (blue bars) and the annualised last quarter growth rate (green line). The data is available – HERE.
The steady trend slowdown in annualised real GDP growth since the March-quarter 2015 is evident.
The year-to-year growth calculation smooths out the considerable volatility in the quarterly data to help us see the trend.
It is too early to predict a US recession is coming but policy has to change given the consistent deterioration in private investment (see later).
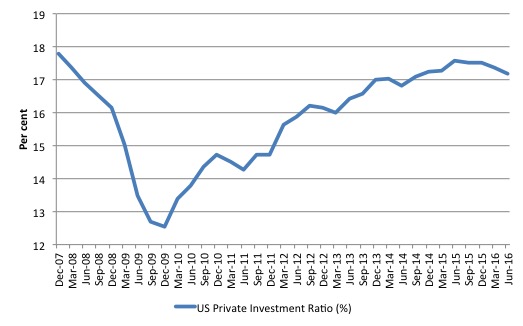
The next graph shows the evolution of the Private Investment to GDP ratio from the December-quarter 2007 (real GDP peak prior to GFC downturn) to the June-quarter 2016.
The decline in the investment ratio as a result of the crisis was substantial and endured for 2 years. As a result the potential productive capacity of the US will have contracted somewhat.
Since the June-quarter 2015, the Investment ratio has once again been in retreat and dropped from 17.6 per cent to 17.2 per cent of GDP by the June-quarter 2016.
The decline in capital formation came before but it had reached the pre-GFC levels (18 per cent – September-quarter 2007) and is a major reason that the overall economy is in retreat.
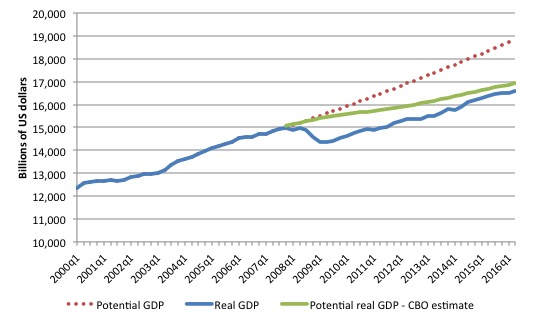
To get some idea of what has happened to potential real GDP growth in the US, the next graph shows the actual real GDP for the US (in $US billions) and two estimates of the potential GDP. There are many ways of estimating potential GDP given it is unobservable.
While I could have adopted a much more sophisticated technique to produce the red dotted series (potential GDP) in the graph, I decided to do some simple extrapolation instead to provide a base case.
The question is when to start the projection and at what rate. I chose to extrapolate from the most recent real GDP peak (December-quarter 2007). This is a fairly standard sort of exercise.
The projected rate of growth was the average quarterly growth rate between 2001Q4 and 2007Q4, which was a period (as you can see in the graph) where real GDP grew steadily (at 0.68 per cent per quarter) with no major shocks.
If the global financial crisis had not have occurred it would be reasonable to assume that the economy would have grown along the red line (or thereabouts) for some period.
The gap between actual and potential GDP in the fourth-quarter 2015 is around $US2,276 billion or around 12.1 per cent. That gap has been rising steadily sine late 2014 after it had stopped rising around 2013 because real GDP was once again growing about as fast at it did, on average in the 6 years before the crisis.
But now growth is slowing and so the gap is rising again.
The green line is the estimate of potential output provided by the US Congressional Budget Office and made available through – St Louis Federal Reserve Bank.
Their output gap estimate (difference between actual and potential) for the June-quarter 2016 is 2.2 per cent, which is clearly less than that derived from a simple extrapolation. It has also been increasing over the last 4 quarters.
How should we assess these two estimates of the output gap?
CBO define Potential GDP as “the level of output that corresponds to a high level of resource-labor and capital-use.”
They explain their estimation methodology in the document – A Summary of Alternative Methods for Estimating Potential GDP.
I discussed the methodology and limitations in these blogs – Structural deficits and automatic stabilisers and US problems are cyclical not structural.
For those who want even more technical detail, please consult my 2008 book with Joan Muysken – Full Employment abandoned – where we provide a mathematical and econometric discussion of the techniques that the CBO uses.
By way of summary, the CBO say that they:
They start with “a Solow growth model, with a neoclassical production function at its core, and estimates trends in the components of GDP using a variant of a tried-and-tested relationship known as Okun’s law. According to that relationship, actual output exceeds its potential level when the rate of unemployment is below the “natural” rate of unemployment) Conversely, when the unemployment rate exceeds its natural rate, output falls short of potential. In models based on Okun’s law, the difference between the natural and actual rates of unemployment is the pivotal indicator of what phase of a business cycle the economy is in.
The resulting estimate of Potential GDP is “an estimate of the level of GDP attainable when the economy is operating at a high rate of resource use” and that if “actual output rises above its potential level, then constraints on capacity begin to bind and inflationary pressures build” (and vice versa).
So despite saying that their estimate of Potential GDP is “the level of output that corresponds to a high level of resource-labor and capital-use” what you really need to understand is that it is the level of GDP where the unemployment rate equals some estimated (unobservable) Non-accelerating Inflation Rate of Unemployment (NAIRU).
Intrinsic to the computation is an estimate of the so-called “natural rate of unemployment” or the NAIRU which is the mainstream version of ‘full employment’ but is, in fact, a conceptual unemployment rate that is consistent with a stable rate of inflation.
The literature demonstrates that the history of NAIRU estimation is far from precise. Studies have provided estimates of this so-called ‘full employment’ unemployment rate as high as 8 per cent or as low as 3 per cent all at the same time, given how imprecise the methodology is.
The former estimate would hardly be considered “high rate of resource use”. Similarly, underemployment is not factored into these estimates.
Also, recall how the European Commission estimated that the Spanish NAIRU jumped from around 12 per cent to around 25 per cent in a short period. Nonsense!
The concept of a potential GDP in the CBO parlance is thus not to be taken as a fully employed economy. Rather they use the devious shift in definition in mainstream economics where the the concept of full employment is not constructed as the number of jobs (and working hours) that which satisfy the preferences of the available labour force but rather in terms of the unobservable NAIRU.
The fact is that these estimates will typically underestimate (by some margin) the true scale of the existing output gaps because the estimated NAIRU is never above the irreducible minimum unemployment rate, the latter reflecting frictions in the labour market as people move between jobs.
You may also like to read this blog – Demand and supply interdependence – stimulus wins, austerity fails – where I discuss the US Federal Reserve Bank’s recent updated estimates of potential GDP.
Both potential GDP estimates in the graph above (the red dotted linear extrapolation and the CBO green estimates) are extremes and the truth is somewhere in between the two.
It is clear that the decline in the Investment ratio will have caused the potential GDP growth to slacken somewhat, which means the red dotted line is an upper limit.
The continued poor state of the labour market with still elevated levels of unemployment and high underemployment would mean that the output gap is likely to be closer to 11 per cent than 2.2 per cent.
The problem then is that the resulting decline in potential real GDP growth reduces the space that the economy can grow within without hitting capacity ceilings. In turn, this locks in higher than necessary labour underutilisation rates.
The other relevant point about the graph is that it defies those who want to characterise the main US problem as being structural (labour market rigidities etc). The US would not have fallen off the cliff as it did in early 2008 if that was the case. Structural deterioration is gradual and cumulative not sudden and sharp.
Contributions to growth
The accompanying BEA Press Release said that:
The increase in real GDP in the second quarter reflected positive contributions from personal consumption expenditures (PCE) and exports that were partly offset by negative contributions from private inventory investment, nonresidential fixed investment, residential fixed investment, and state and local government spending. Imports, which are a subtraction in the calculation of GDP, decreased …
The acceleration in real GDP growth in the second quarter reflected an acceleration in PCE, an upturn in exports, and smaller decreases in nonresidential fixed investment and in federal government spending. These were partly offset by a larger decrease in private inventory investment, and downturns in residential fixed investment and in state and local government spending.
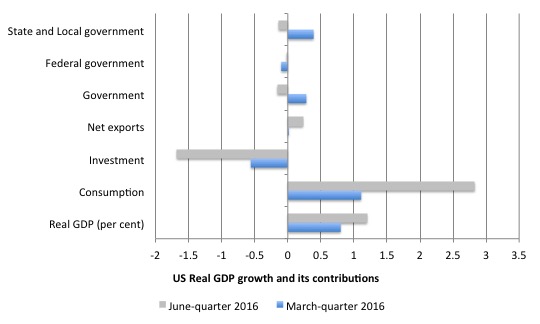
The next graph compares the March-quarter 2016 (blue bars) contributions to real GDP growth at the level of the broad spending aggregates with the June-quarter 2016 (gray bars), where the overall real GDP growth was 1.2 per cent.
The main aggregate source of growth came from Private consumption spending (a stunning 2.83 percentage points) up from 1.11 percentage points in the March-quarter 2016.
It is hard to interpret the trend in private consumption growth given it was slowing down in the second-half of 2015 but has since accelerated again.
American household debt remains high and uncertainty is increasing. So how that impacts will remain to be seen.
The contribution of Private investment spending has been negative for the third consecutive quarter which does not augur well for the medium-term outlook and largely explains the slowing growth.
The negative contribution is also growing in magnitude.
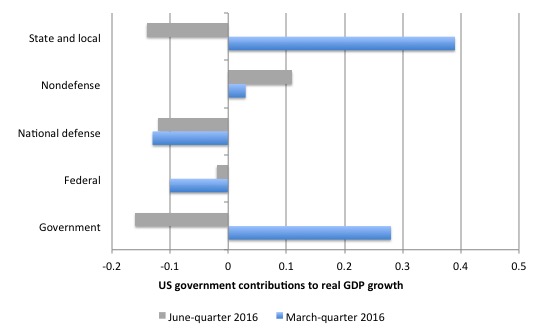
The Government sector undermined growth in the June-quarter (by -0.16 points) after contributing 0.28 points in the March-quarter 2016. This is the first negative Government-sector contribution to real GDP growth since the December-quarter 2014.
In the June-quarter 2016, both the federal and state/local government’s contribution were negative (-0.02 and -0.14 points, respectively).
The other contributor to growth was Net exports (0.23 points).
The next graph decomposes the government sector and shows the substantial reversal in growth contribution from the State and Local government sectors.
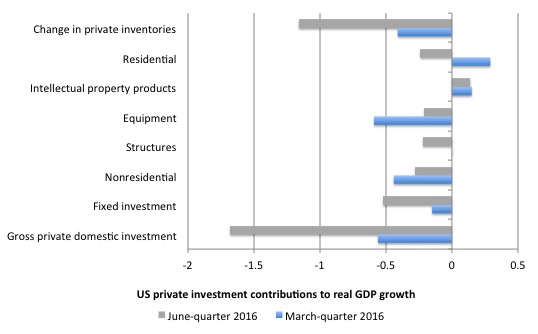
The next graph shows the contributions to real GDP growth of the various components of investment. It is here that we see why total real GDP growth has been declining.
The only positive contribution came from Intellectual property products (0.14 points). All other components undermined growth.
US firms have been shedding inventories since the June-quarter 2015 (five consecutive negative contribution quarters), which means the inventory cycle has well and truly turned down as firms have cut production growth and can meet current consumption growth with existing inventories.
A sustained downturn in the inventory cycle signals on-going weakness in the economy.
Conclusion
While the June-quarter real GDP growth estimate was slightly above the March-quarter outcome (0.3 per cent compared to 0.21 per cent), on an annualised basis, the US economy slowed rather appreciably to 1.2 per cent per annum in the June-quarter 2016 (down from 1.6 per cent in the March-quarter 2016).
Compared to the corresponding quarter last year (June 2015), when the annualised real GDP growth rate was 3 per cent, the 1.2 per cent result in the June-quarter 2016, is a significant deterioration.
In fact, the peak real GDP growth rate was 3.3 per cent in the March-quarter 2015, and each subsequent quarter since has seen a deterioration in the performance of the US economy.
A major driving factor has been that Private investment expenditure has recorded three consecutive quarters of negative growth.
A contributing factor was the negative contribution from the government sector (all levels).
Clearly household consumption expenditure is holding up but it is unclear how long households will keep running down the saving ratio, especially given that the private sector has elevated levels of debt.
In general, I conclude that with private business investment faltering, the federal government’s deficit is now too low to support stronger growth and labour underutilisation rates (U6) remain elevated (and excessive).
Upcoming talk at the New International Bookshop in Melbourne – August 4, 2016
On August 4, 2016, I will be giving a talk at the New International Bookshop in Melbourne (Australia) on the topic – The demise of the Left and towards a Progressive Left Manifesto – which is the topic covered in my latest book project that is nearing completion.
The talk will run between 19:00 and 20:30 and the venue is at 54 Victoria St, Melbourne, Australia 3053 – which is part of the Victorian Trades Hall.
The actual room will now be the Bella Union bar (upstairs from the Bookshop) and drinks will be available there.
There is a Facebook Page for the event.
The Bookshop is staffed by volunteers who appreciate any support they can get.
I spent many hours in my youth sifting through all sorts of radical books in its previous incarnation as the International Bookshop (operated by the now defunct Communist Party of Australia) in Elizabeth Street, Melbourne.
When I was a university student without much cash at all one – great staff member – there used to give me an orange on a regular basis – she always had one available and I guess she knew I haunted the place.
Here is the flyer. It would be great to see people at the event and the small entry fee goes to helping sustain the Bookshop, which has a long history in providing alternative and radical literature to Australian readers.

That is enough for today!
(c) Copyright 2016 William Mitchell. All Rights Reserved.
To read the newspapers this morning,all this is Jeremy Corbyn’s fault, according to two of his most annoying ex advisors.
And yet John McDonnell is still clinging to the Ed Balls style ‘fiscal rule’ dreamt up by Wren Lewis. A man who now supports Pfizerman rather than JC.
Why does McDonnell still want an unemployment buffer of millions of people?
There is a constant line in Labour at the moment that “the voters don’t understand”, so they have to stick to neocon terminology.
My question is that if Labour doesn’t explain to people what the truth is, who is going to do that?
Unless Labour adopts the view that they are changing the viewpoint on the economy from one where people are their to service the economy to one where the economy is there to provide for the people and care for the planet, then they will continue to lose.
They have to sell the new viewpoint.
No, it is not Brexit or Corbyn but Putin who is to blame! In the US everything is Putin’s fault.
Would an increase in the minimum wage not be as effective as an increase in government spending? Would not higher income spur spending?
your US monetary sovereign name sake Roger Mitchell is very good on the historical analysis of
fiscal stimulus. trends and recessions in the US if the US government does not deliver discretionary
stimulus I think a recession is all but inevitable.
why has business investment declined in the face of consistent sales and consumption from the household sector?
I would have thought that strong sale and consumption would instill confidence in the business sector.
I would have thought that this healthy demand would spur business investment,capital development output expansion.
I guess the reduction in government sector GDP contribution,reduces potential demand which is a signal to the private sector to run down inventories.
I believe the timing of reducing investment ration matches reduction in Government contribution to GDP.
This still surprises me though as I though healthy consistent sales would steer the rest of the economy.
I always thought that declining inventories were a sign of an improving economy- that companies with declining inventories were bound to increase production in the near future. And that increased production might require, or at least be a signal for, increased investment. What mistakes am I making here?
Hey, Bill. Will you repeat your book launch in Sydney or Newcastle?
‘They have to sell the new viewpoint.’
This is spot on Neil -but they either don’t understand this (their so-called economic advisers might not either0 or are cowering before the Overton Window. Even Sanders with Stephanie Kelton advising had to talk in the ‘conventional’ way about deficits. Someone in politics has to make the first move and tell people money comes from computer key strokes and not from Rich People.
Neil,
Your statement: “changing the viewpoint on the economy from one where people are there to service the economy to one where the economy is there to provide for the people and care for the planet”
I think that most people would support that assertion, whilst acknowledging that this also suggests a more central (government) control. They might also accept that the modern economic process is founded on exploitation; but of what – surely the initial motivation is founded on opportunity – to provide a product or a service. To the extent that labour is needed to accomplish that task may indeed amount to exploitation; but only on one side of the deal? It is just as likely to have a mutual element.
To the extent that an employer can manipulate demand for labour, control could be said to lie in the hands of a capitalist, but how strongly should this be classified as exploitation. The market exerts an extremely powerful influence in how resources are allocated.
From the historic viewpoint of capitalism it could be argued that before the 19th century mankind actually served something akin to a planetary cycle. It was only with the introduction of railways that the industrial revolution was possible.
I was reminded of this by a visit yesterday to Shildon, in County Durham, to see the Flying Scotsman. The world’s most famous steam locomotive proved an evocative example of an era that was initiated just a dozen miles from Shildon with the opening of the world’s first locomotive-hauled commercial railway, the Darlington-Stockton line.
It was the railways that allowed mankind to move from reliance on a rural-dominated existence to a city-style independence and affluence.
We have come a long way since then and experienced both the benefits and costs of capitalism. Emphasise its shortcomings by all means, but that merely exposes the need for alternative concrete proposals, policies and plans that can be implemented.
It is time to make these alternatives quantifiable and measureable; anyone standing up to be counted in such an endeavour can be sure of one thing though – it is likely to be no smoother a ride than modern capitalism, even if an attempt is made to control the market.
Gogs, since the first ancient civilisations and slavery there were affluent classes and urban centres sucking the life out everything.
Industrial revolution just made possible a bigger surplus and more veiled forms of oppression and slavery. At core not much has changed since the first Mesopotamia civilisations. Our social evolution is slow as hell (still faster than our biological one, but slower than our technological one).
“whilst acknowledging that this also suggests a more central (government) control. ”
It’s more collective control of the process via democracy – to provide the containment around and insert the necessary control rods into the nuclear reactor of capitalism. That way we get maximum output without the boom.
Danny Blanchflower has just written an awful and damaging article in the Guardian saying that he has given up on Jeremy Corbyn based on the fact that his PLP have no confidence in him, and also blaming the polls (which incidently went sour for Corbyn after the damaging coup).
https://www.theguardian.com/commentisfree/2016/aug/02/i-advised-jeremy-corbyn-economics-team-learn-fast–no-credible-plan-labour-leadership#comment-80379365
He is pitching his tent in the Owen Smith ground. Owen Smith has just revealed his manifesto, which many have said, contain mostly Corbyns policies.
I am hoping that some one here might be able to explain to me the economics behind Danny Blanchflower, because apart from making snide comments about Corbyn and suggesting rearranging taxes from indirect to direct, he said nothing really. His new found love for “Mr Pfizer” (as cynics are calling Owen Smith due to his corporate lobbying for big Pharma), seem strangely misplaced. One, he is pretending to ape Corbyns policies to take votes, and two, all of his history and voting record does not imply that he is anti austerity, having abstained on the welfare bill that John McDonnell voted against.
I feel that Blanchflower is not being genuine here, that his obvious political stance reveals a greater tendency for a gentler form of Washington Consensus than for socialism. Can anyone here enlighten me?
@Jerry Brown
Big companies have a very efficient planning and as much as they can on “just in time”. Despite that the original drive for “just in time” was the shift from negative real interest rates to very high punitive ditto (Volker), in the 70s the warehouse was a place that generated money. Of course it’s also shorter product cycles today.
We could see when the GFC broke out in the late 2008 how companies instantly cut production for necessary inventory volume, and sold out existing inventory. As a photo nerd one could notice how some e.g. Canon lenses came in short supply and there was a waiting time to get them delivered.
@sndra crawford
This all about brainwashed grown ups triyng to be adults.
The red tories of the PLP had seen the blues win an election and then concluded that they should ape their arm waving.
In the last leadership election they included , as a joke,Jeremy Corbyn, who then, overwhelmingly, illustrated that they had noting to offer.
They have since done everything in their tiny (network based)minds to rectify this appalling bureaucratic mistake.
As the ruthless cowards they are, it has not succeeded, despite they and their acolytes concerted efforts.
Jeremy may not be perfect, but he is the best available.
If losing that well man groomed, camera ready ponce wren lewis or the interest rate maniac blanchflower’s support, I think that is a cost easily born.
@gogs
“From the historic viewpoint of capitalism it could be argued that before the 19th century mankind actually served something akin to a planetary cycle. It was only with the introduction of railways that the industrial revolution was possible.”
That is a tough two sentences, what is the planetary cycle, or even something akin to it?
I think you should read a little john prebble or neil gunn to dissuade you that urbanisation was a matter of opening local railway stations.
“The market exerts an extremely powerful influence in how resources are allocated.”
What is this market?
Only a few years ago if a camel in saudia arabia developed a sniffle we were told that our energy prices must rise. The market ( the poor bastards who have to heat their homes) had pretty much no say.
A few years later the swing monopsonists says we have so much oil we can sell it closer to production costs.
( the poor bastards who have to heat their homes did not influence this)
As I have a memory slightly longer than a goldfish and I can only assume that “the market” is irrelevant.
“It was the railways that allowed mankind to move from reliance on a rural-dominated existence to a city-style independence and affluence.”
If you had any understanding of the loss of personal agency, the horrific death toll of C19 industry and the benefits of the reaction against that (the one that created or repaired assets for current stripping), you might lose your whiggish optimism.
“We have come a long way since then and experienced both the benefits and costs of capitalism. Emphasise its shortcomings by all means, but that merely exposes the need for alternative concrete proposals, policies and plans that can be implemented.”
If you read this and can write that, I can only surmise that you cannot do either very well.
Death camps, Mass surveillance,National destruction, xeonophobia have, without concrete proposals, been very effectively carried out.
/L – Thanks for the reply. I just am having a hard time believing that story. (Which certainly doesn’t mean its not true.) Are you saying that a consumer products company would be producing its product and everything is going along just fine as far as sales and costs and profits when suddenly the CEO reads a newspaper article or something and decides to cut production without any sales indications whatsoever? Just in case there would occur a drop in sales in the future? That doesn’t seem likely to me. But then I’m not a CEO. Now I could understand that in some cases. Say like a weapons manufacturer reading the headline “War is Over, Peace Treaty Signed”.
Jerry Brown. 5 quarters of “shedding inventories” means sales were below expectations as the economy slows so production is cut to trim or shed the inventory that built up.
Will R, thank you. I think you are saying that changes in inventories have to be interpreted along with other indicators of the economy at that time and in the context of recent activity? So if inventory accumulation is negative and product sales have not been increasing over some period of time, then production has already been cut previously? And that bodes poorly for the future state of an economy?
But would you say the opposite also held? 5 quarters of rising inventories means sales were above expectations as the economy grows faster than firms expected so production has increased? I’m not trying to be deliberately obtuse, just am confused here.
“Deliberate obtuseness” is a great description I first heard at Alex Douglas’s “Origin of Specious” blog. I wish I could be so adroit in my writing. Unfortunately, I usually suffer from the inadvertent type of obtuseness.
Jerry Brown, I’m studying my MBA and funnily enlighten just finished operations management with a distinction I’m happy to say 🙂
Just in time (JIT) manufacturing works on a pull system rather than the old style push manufacturing style. It means each later stage institutes the prior stage. So if the demand is lost at the last stage then essentially manufacturing would stop as storage of inventory is considered waste in the process management concepts.
You can see its effects when an earthquake in Japan instantly affected many other companies that depended on inventory from that area affected. It flowed on to cameras etc etc
It’s now referred to as lean manufacturing and some slack is left for key steps of the processes. Google wiki JIT and you’ll find more detail. Toyota pioneered it and it’s one of the reasons we have much better quality cars much cheaper relatively than in the past. It’s actually very interesting to learn about it. Sure YouTube might have more detail. I’d post links but it then awaits moderation so Google will help if interested 🙂