On July 22, 2025, the - 2025 Japanese House of Councillors election - will be…
Japan’s unemployment rate decline is due to fiscal stimulus not ageing
In yesterday’s blog – Time for fiscal policy as we learn more about monetary policy ineffectiveness – I discussed, in part, the way that fiscal and monetary policy in Japan were working in a harmonious way, in contradistinction to the way these two major policy levers are working elsewhere (for example, Australia and the Eurozone). One of the results of that harmony is that the official unemployment rate in Japan has dropped to 3.1 per cent, the lowest since July 1995. I considered the willingness of the Japanese government to introduce and maintain large fiscal stimulus programs under its Prime Minister – Shinzō Abe – to be a major contributing factor in that reduction (down from 5.5 per cent in July 2009). However, a Bloomberg journalist asserts that – Japan’s Plunging Jobless Rate Is All About Aging, not Abenomics (published August 10, 2016). We can explore whether that assertion is true. It will certainly be partly true given the population ageing in Japan. That is what this blog is about today.
The Bloomberg article opens by saying that:
As Prime Minister Shinzo Abe sees it, Japan’s tight labor market is a key success of his economic strategy: the unemployment rate is the lowest in 21 years and the job-to-applicant ratio is the highest in 25 years.
Analysis of data over a longer period indicates that the nation’s aging and declining population is the driving force …
So there is clearly a contestable notion here.
Shinzō Abe assumed office as Prime Minister on December 26, 2012. His so-called ‘crisis-busting cabinet’ was charged with stimulating the Japanese economy.
Abe told the press gathered in Tokyo on the same day that (Source):
With the strength of my entire cabinet, I will implement bold monetary policy, flexible fiscal policy and a growth strategy that encourages private investment, and with these three policy pillars, achieve results.
The willingness to expand the fiscal deficit with increased public spending combined with monetary easing from the Bank of Japan was characterised as ‘Abenomics’.
His first major fiscal statement (aka ‘budget’) introduce a 10.3 trillion yen stimulus package comprised of increased public works spending, some small business handouts and increased military spending.
He muddied the waters in 2013 by introducing a sales tax increase accompanied by a further fiscal expansion on the spending side. The tax rise killed growth and Japan was in recession in the June and September quarters of 2014. The planned second-stage hike in sales tax was deferred.
He repeated the earlier act in early 2015 with another major fiscal stimulus and challenged the conservatives in his party with the catchcry that there would be (Source):
No Fiscal Health Without Economic Revitalization …
The Japanese press – Abe’s Growth-First Fiscal Policy – (September 9, 2015) reported that:
… the Abe government’s new slogan confirms that while senior leaders have previously referred to the need to balance the twin goals of economic recovery and fiscal consolidation, economic growth over the short and medium runs is increasingly seen as the necessary precursor to solving Japan’s fiscal issues.
This is entirely sensible – stronger growth generates higher tax revenue and lower fiscal deficits usually. To stimulate that growth when non-government uncertainty is manifest and private spending cautious, requires higher deficits first.
Clearly, Abe recognised that fundamental fact.
The point of the foregoing is that it is hard to actually pinpoint when the growth spurt under Abenomics actually began. Total employment has risen in net terms over the period since December 2012 – a net shift of 2.1 million jobs (from 62,510 thousand jobs in December 2012 to 64,560 thousand in June 2016).
In this blog – Decomposing the decline in the US participation rate for ageing – I outlined a method for examining how much of the declining unemployment rate was due to participation effects as more older workers exited the American labour market.
We will use that method to examine the assertion that the drop in the Japanese unemployment rate since 2012 is all down to ageing effects.
The ageing of the Japanese labour market
In January 1968, 26.4 per cent of the population above 15 years of age were aged between 15 and 24 years, 22.4 per cent between 25-34 years, 19.3 per cent between 35-44 years, 13.0 per cent between 45-54 years, 10.1 per cent between 55-64 years, and 8.9 per cent above 65 years.
By June 2016, considerable changes have occurred as the following graph testifies.
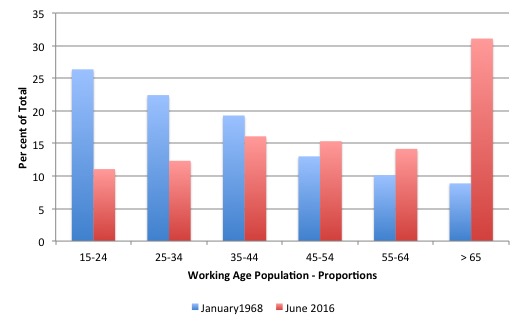
So there is ageing going on.
Labour force participation trends in Japan
The labour force aggregates are as follows:
1. Employment (E) plus Unemployment (U) = the Labour Force (LF).
2. LF plus Not in the Labour Force (NLF) = Working Age Population (WAP).
3. Labour Force Participation Rate (LFPR) = LF/WAP – expressed as a percentage.
4. Unemployment rate (UR) = U/LF.
5. Employment-Population ratio (EPOP) = Employment/WAP.
The LFPR thus is sensitive to the economic cycle because job search rises when times are good and falls when times are bad.
Normally a plunging participation rate during a major cyclical downturn is a cause for concern. It tells us that the discouraged worker effect is dominating such that workers who want to work exit the labour market due to lack of job opportunities.
The discouraged workers differ from the officially unemployed only because they have given up active search. The evidence is strongly supportive of the view that they give up looking because there are insufficient jobs to go around and to protect their self-esteem from the multiple rejections they just stop looking and wait for employment growth to improve.
If they were offered a job they would accept and start work immediately. In that sense, they are functionally no different to someone who is unemployed. The discouraged workers are otherwise known as the hidden unemployed for that reason.
But the LFPR can also be influenced by trend factors (sometimes called structural factors) and the ‘ageing population’ is one such factor. The other is the gender balance in the WAP. For example, participation rates rose dramatically in the 1970s as a result of social changes, which saw a massive influx of married women into the workforce.
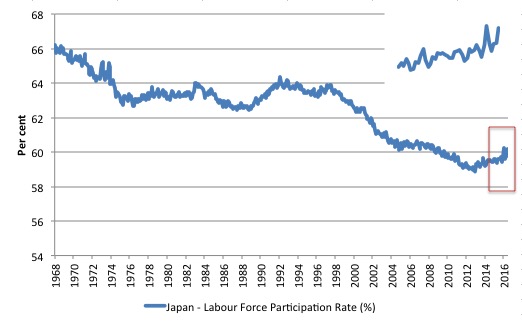
The following graph shows the aggregate participation rate from January 1968 to June 2016. The red rectangle is the Abe period and the inset is a zoomed version of what happened in that period.
So when Shinzō Abe took office the aggregate participation rate was at 58.9 per cent (seasonally adjusted) and by June 2016 it had risen slightly to 60.1 per cent – which tends to tell us that the fall in the unemployment rate has not been due to a falling labour force participation rate generated by increased ageing in the labour force.
The next graph breaks the aggregate down into age groups. The data shows that over the Abe period participation rates across all age groups have increased.
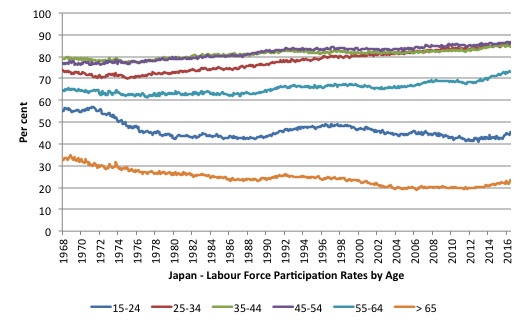
Over the longer period, the two age extremes (15-24 and over 65) have seen their participation rates decline. Even so, the reason the aggregate participation rate has declined is because the composition of the working age population (WAP) has shifted in favour of older workers who have lower participation rates.
Remember the aggregate participation rate is a weighted average of the separate age cohorts.
Decomposing the Trend and Cycle components
What has been the impact of the participation rate shifts since Abe was elected on the unemployment rate?
What has been the impact of the shift in age-composition of the labour force on the participation rate?
The total participation rate (LFPR) is weighted average of the underlying participation rates of the demographic groups that make up the total Working Age Population (WAP). We will stick to using: three broad groups – young workers 15-24 years old; prime-age workers 25-54 years old; and older workers 55 years and over.
The behaviour of the individual age cohorts within the prime-age category (25-34, 35-44, 45-54) is very similar and researchers often reduce the complexity of the problem by aggregating them together with little loss of information.
For those who like formulas we can write the total participation rate as:
LFPR(t) = (w1524 x LFPR1524) + (w2554 x LFPR2554) + (wGT55 x LFPRGT55)
In English this just says that the Total LFPR at time t is equal to the weighted sum of the participation rates of the three demographic groups, where the weights are given by the share of each demographic group in the WAP.
The weights are calculated, for example as: w1524 = Total Population of 15-24 year olds divided by Total WAP. And so on for the other two groups.
The following holds: w1524 + w2554 + wGT55 = 1
The weights proportionately segment the total WAP into the three age groups respective shares.
Like any average, the total is influenced by the LFPR behaviour of the three groups and the weights each group has in the WAP.
For example, we could encounter a situation where the LFPRs for the three groups are unchanged but the total WAP becomes comprised on more of the GT55 group and less of the 1524 groups and if LFPRGT55 < LFPR1524, then the total LFPR will fall just because there are proportionately more people in the WAP who have lower participation rates. So the LFPR can fall not due to changes in the underlying behaviour but because of shifts in the population age composition. The facts are as follows: 1. January 2012: 15-24 weight = 11.1 per cent, 25-54 weight = 44.7 per cent, Greater than 55 weight = 44.3 per cent. 2. June 2014: 15-24 weight = 11 per cent, 25-54 weight = 43.7 per cent, Greater than 55 weight = 45.2 per cent. 3. Conclusion: hardly any shift at all - although the older workers are now slightly higher proportion of the workforce. There is now a slightly higher proportion of older workers seeking work. However, there are also more of these workers in the Working Age Population, which will reduce the weighted average total. We can estimate the impact of the shifting demographic composition of the Working Age Population on the Total LFPR from any point in time quite easily. We will use January 2013 as our participation benchmark (not because it was a peak but because it marked the start of Abenomics), the aggregate participation rate. We can calculate the weighted average participation rate in the following way using that benchmark. Instead of using the current weights as in the previous formula:
LFPR(t) = (w1624 x LFPR1624) + (w2554 x LFPR2554) + (wGT55 x LFPRGT55)
We will use the fixed weights where the relevant weights (proportions in the population) are fixed at their January 2013 values.
In other words, we are then considering the LFPR behaviour for each group weighted by the share of the WAP as at January 2013. The behaviour of the total weighted average then is not due to the age-shift in the population shares.
The formula would be (in this case):
LFPR(t)January_2012 = (w1624January_2012 x LFPR1624) + (w2554January_2012 x LFPR2554) + (wGT55January_2012 x LFPRGT55)
where the term (for example) w1624January_2012 is the share of 15-24 years olds in the WAP as at January 2012.
Then the difference between the two calculations LFPR(t) and LFPR(t)January_2012 tells us the change in the participation rate that is due to changes in the age distribution of the Working Age Population since January 2012.
The following graph plots the two times series – the blue line for the actual or current-weight LFPR(t) and the red-line for the fixed weight series (using January 2012 as the fixed weight).
Not a lot of difference is there?
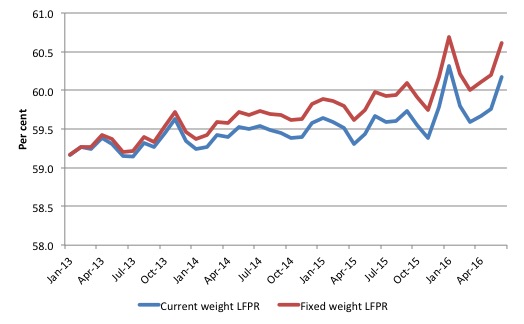
The results suggest if the age composition of the Working Age Population had have remained at the proportions when Abe took office (January 2012) the LFPR in June 2016 would be 60.6 per cent rather than the actual reported LFPR of 60.2 per cent.
The January 2012 LFPR was 59.2 per cent and there has been a 1 percentage point increase to June 2016.
So it is hard to mount the case that the falling unemployment rate is all due to ageing (meaning people leaving the workforce).
What would have the unemployment rate been now if the participation rate had not shifted since Abe took office?
Well, the actual unemployment rate is 3.12 per cent (June 2016). Given the current Working Age Population, the Labour Force would have been 65,560 thousand in June 2016, had the participation rates not shifted.
The actual Labour Force in June 2016 was 66,640 thousand. So an EXTRA 1,080 thousand have come into the workforce as employment has risen (by 2,050 thousand) and unemployment has fallen (by 710 thousand).
If those extra workers had not come into the labour force and the unemployment was at its June 2016 value (2080 thousand) thent he unemployment rate would have been 3.2 per cent – slightly higher due to the lower labour force.
Conclusion
Given the data, it is impossible to make the claim that the “Japan’s Plunging Jobless Rate Is All About Aging, not Abenomics”.
The evidence doesn’t support that ideological assertion at all.
The stimulus has created lots of jobs and allowed more workers to come into the labour force. The rise in employment has significantly outstripped the rise in the working age population and the labour force (with a slightly higher participation rate) and that is the reason the unemployment rate has fallen.
I make no conclusions about the quality of the work that has been created – that is another question for another day.
That is enough for today!
(c) Copyright 2016 William Mitchell. All Rights Reserved.
“Working Age Population (WAP).”
Is the unemployment rate still calculated with can age 65 end point?
“The following graph plots the two times series – the blue line for the actual or current-weight LFPR(t) and the red-line for the fixed weight series (using January 2012 as the fixed weight).”
I don’t see the graph….
Re – your reference to Japan’s rise in employment levels -“I make no conclusions about the quality of the work that has been created – that is another question for another day.”
The entire western world would presumably be interested to learn about how the development of Asian economic power (eg China) will affect its ability to succeed in competitive markets; affecting product and employment profiles. Living standard changes seem to be a natural consequence.
Thus exacerbating the Euro’s natural propensity to disrupt its own brethren.
Dear Phil (at 2016/08/10 at 8.43 pm)
Fixed now.
I am still looking into your other problem with respect to the US.
best wishes
bill
Thanks Bill. Much appreciated.
Prof. Mitchell,
I find your data and analysis persuasive. I am curious if you sent this to the author ( Yoshiaki Nohara ) and if so what he had to say about it.
Best Regards
Unlike the RBA, Mark Carney has stated outright that his monetary policy initiatives will not be enough to stimulate growth and that the government needs to introduce a fiscal stimulus package, although he did not quite say it outright. It should have been clear what he thought was needed, however.
The figures you show are statistically nonsignificant. Of course, one can have statistical significance with meaningless differences. This can happen with an enormous data set where the statistical analysis has not been adjusted to account for the size of the data set. What you show is both statistically nonsignificant and economically meaningful. Good result. Now, let’s lee if Hammond (and Corbyn) can learn from this. I am not very optimistic.
Hi Bill,
just had a quick question on the MMT view of an ageing population in general, which is seen by many (thinking of my geography lecture yesterday) as a problem, with a dependent population and the cost of care picked up, you guessed it, by the taxpayer…(and yes I have read ‘taxpayers don’t pay for anything’). Could you give me a quick idea of an MMT position on whether or not a large % of Gov spending on pensions/ care etc is an issue?
I have been trying to think it through, and my conclusion is that it could be useful as a job creation program in aged care/ health! In this way spending would be aimed at ‘real resource space’ in those sectors, and would provide employment and income. I imagine the fear of an ageing population is tied in with the orthodox fear of debt/ deficit spending. ie How could the young be expected to pay for baby boomer debt AND foot their aged care costs?
However, I am happy to be proved wrong and would appreciate a brief explanation if you think it ties in with this blog.
Thanks,
Michael
I didn’t see it stated explicitly (maybe it is there implicitly), but I wonder if Japan’s official retirement age has changed in the period discussed?
.
Increasing retirement ages certainly seem to have become a common feature in western economies, presumably justified because “we can no longer afford” for people to retire at ages once considered normal.
.
I am actually quite worried about this trend from a social point of view. We are supposed to be living longer, generally speaking, but I believe that extreme old age will only ever apply to a small percentage of the population. Meanwhile, people may be living longer, but they aren’t necessarily living to a healthy old age. And both anecdotally, and from the evidence of the obituary notices, plenty of people are dying at not particularly old ages, e.g. early 70s, 60s or even 50s. (As Woody Allen might say “How can they be dead – they all ate organic rice?” – not meaning to be flippant, but this is the boomer generation (of which I am one)).
.
One consideration is that this trend seems most unjust on the younger generations: their parents and grandparents could retire at 65 (or earlier for women and in many public service jobs), but they are having to work until their late 60s, and if trends continue, into their 70s – This cannot go on.
.
With the insight that MMT provides, that governments are never revenue-constrained, I would hope that in due course, this increase in retirement ages can be halted and even reversed in due course. (Of course, people should always be free to work longer if they wish, but they should not be forced to work into old age if they do not wish to).