Today (April 18, 2024), the Australian Bureau of Statistics released the latest - Labour Force,…
Australian labour market – the part-time employment nation
Last month’s Australian labour force data showed what a part-time employment nation we were becoming. The latest labour force data released today by the Australian Bureau of Statistics – Labour Force data – for July 2016 shows that trend to be intensifying with modest employment growth and collapsing full-time employment growth. With more than 86 per cent of total net jobs created over the last 12 months being part-time, it is clear that Australia is becoming a nation of part-time employment growth with all the attendant negative consequences. The teenage labour market remains in a poor state and requires urgent policy intervention. Overall, with weak private investment now on-going, the Australian labour market is looking in pretty dismal shape and the recently elected Federal government should have introduced a rather sizeable fiscal stimulus immediately upon re-election to provide some fiscal leadership to the nation. This should have included a large-scale public sector job creation program which would ensure teenagers regained the jobs that have been lost due to the fiscal drag over the last several years. There are no signs that our polity understands any of that.
The summary ABS Labour Force (seasonally adjusted) estimates for are:
- Employment increased 26,200 (0.2 per cent) with full-time employment falling sharply by 45,400 and part-time employment rising by 71,600.
- Unemployment fell by 5,500 to 725,500.
- The official unemployment rate fell to 5.7 per cent (0.1 points).
- The participation rate was steady at 64.9 per cent. This is well below its November 2010 peak (recent) of 65.8 per cent.
- Aggregate monthly hours worked increased 3.7 million hours (0.2 per cent).
- The quarterly ABS broad labour underutilisation estimates (the sum of unemployment and underemployment) will next be updated in the September 2016 release. In the May quarter, underemployment rose by 10.8 thousand at 8.4 per cent of the labour force. The total labour underutilisation rate (unemployment plus underemployment) rose by 0.1 per cent to 14.2 per cent. There were 1,067.3 thousand persons underemployed and a total of 1,801.5 thousand workers either unemployed or underemployed.
- The monthly underutilisation estimates show the situation has deteriorated since May. In July 2016, there were 1133.7 thousand underemployed persons or 8.9 per cent of the labour force. Total underutilisation stood at 14.5 per cent.
Employment growth – modest in July
Total (net) employment in July 2016 is estimated to have increased by 26,200 jobs. But full-time employment fell sharply by 45,400 while part-time employment rose by 71,600.
The ABS said that:
The latest Labour Force release shows continued strength in part-time employment growth. Over the past six months there has been an increase of 82,600 people working part-time, compared with a 21,600 decrease in those working full-time …
Which consolidates the interpretation that the Australian economy is becoming dominated by part-time work – with the attendent ramifications of low-pay, precarious attachments and other negative characteristics.
84 per cent of the net jobs created in Australia in the last 12 months have been part-time.
The zig-zag pattern that we have observed over the last 36 months or so – where the employment estimates have been switching back and forth regularly between negative employment growth and positive growth with the occasional spikes – continues.
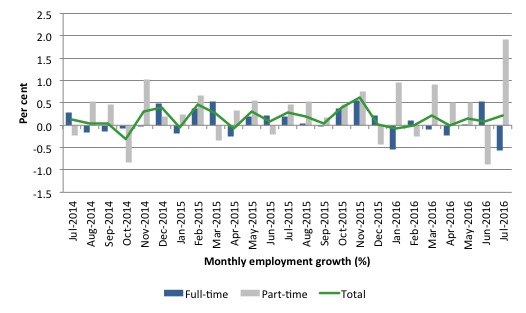
The following graph shows the month by month growth in full-time (blue columns), part-time (grey columns) and total employment (green line) for the 24 months to July 2016 using seasonally adjusted data.
It gives you a good impression of just how flat employment growth has been over the last 2 years. You can also see the dominance of part-time employment growth over the same period, especially in the last year or so.
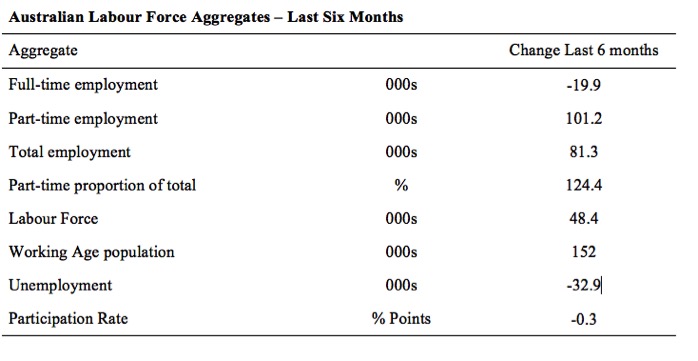
The following table provides an accounting summary of the labour market performance over the last six months. The monthly data is highly variable so this Table provides a longer view which allows for a better assessment of the trends. WAP is working age population (above 15 year olds).
Full-time employment has fallen by 19.9 thousand jobs (net) while part-time work has risen by 101.2 thousand jobs. Thus, 124.4 per cent of the total employment created (net) over the last 6 months has been part-time.
The conclusion – overall there have only been 81.3 thousand jobs (net) added in Australia over the last six months while the labour force has increased by a very modest 48.4 thousand. Employment growth has thus outstripped the sluggish labour supply growth with the result that unemployment has fallen by 32.9 thousand.
Employment growth (particularly the quality of the jobs) has been weak by historical standards given that the labour force growth has been very subdued, and labour force participation has declined markedly (-0.3 percentage points). The participation rate remains at depressed levels.
Overall – a fairly subdued labour market.
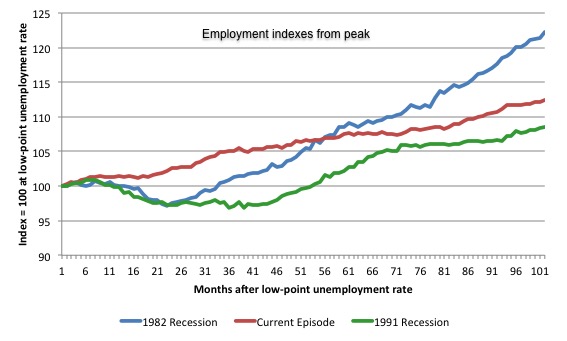
The following graph shows employment indexes for the last 3 recessions and allows us to see how the trajectory of total employment after each peak prior to the three major recessions in recent history: 1982, 1991 and 2009 (the latter to capture the current episode).
The peak is defined as the month of the low-point unemployment rate in the relevant cycle and total employment was indexed at 100 in each case and then indexed to that base for each of the months as the recession unfolded.
I have plotted the 3 episodes for 101 months after the low-point unemployment rate was reached in each cycle – the length of the current cycle.
The initial employment decline was similar for the 1982 and 1991 recessions but the 1991 recovery was delayed by many months and the return to growth much slower than the 1982 recession.
The current episode is distinguished by the lack of a major slump in total employment, which reflects the success of the large fiscal stimulus in 2008 and 2009.
However, the recovery spawned by the stimulus clearly dissipated once the fiscal position was reversed and the economy fell back into producing very subdued employment outcomes.
Since February 2008, employment has grown by a miserly 12.4 per cent, which is a very slow pace in historical terms for such a long period.
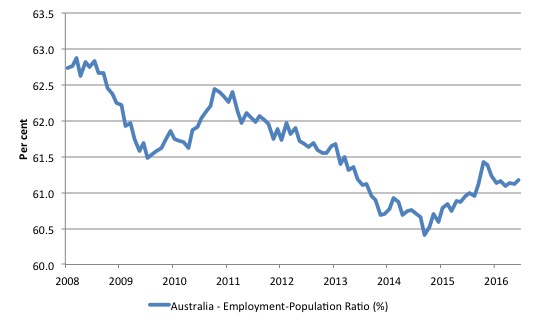
Given the variation in the labour force estimates, it is sometimes useful to examine the Employment-to-Population ratio (%) because the underlying population estimates (denominator) are less cyclical and subject to variation than the labour force estimates. This is an alternative measure of the robustness of activity to the unemployment rate, which is sensitive to those labour force swings.
The following graph shows the Employment-to-Population ratio, since February 2008 (the low-point unemployment rate of the last cycle).
It dived with the onset of the GFC, recovered under the boost provided by the fiscal stimulus packages but then went backwards again as the last Federal government imposed fiscal austerity in a hare-brained attempt at achieving a fiscal surplus.
The ratio began rising in October 2014 which suggested to some that the labour market had bottomed out and would improve slowly as long as there are no major policy contractions or cuts in private capital formation.
However, the peak in November is now gone and the ratio is once again in retreat or barely rising.
The on-going fiscal deficit is still supporting some growth in the economy as the spending associated with the mining boom disappears. But the deficit is clearly too small given the behaviour of the real aggregates.
The series rose by 0.1 points in July 2016 but remains 1.7 points below the May 2008 peak of 62.9 per cent.
Teenage labour market – deteriorates further
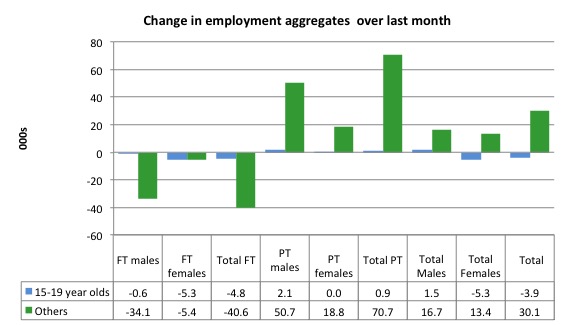
The teenage labour market went backwards again in July 2016 with full-time employment falling by 4.8 thousand and part-time employment rising by 0.9 thousand (net) jobs.
Total employment thus fell by 3.9 thousand (net).
The following graph shows the distribution of net employment creation in the last month by full-time/part-time status and age/gender category (15-19 year olds and the rest)
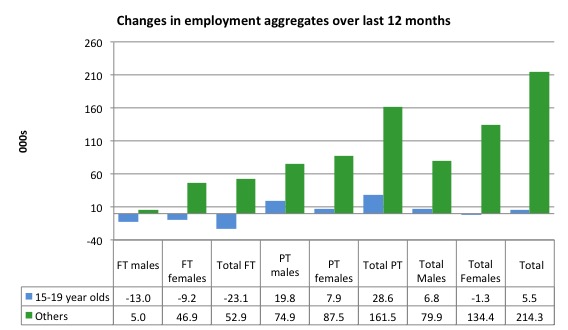
Over the last 12 months, teenagers have gained only 5.5 thousand (net) jobs overall while the rest of the labour force have gained 214.3 thousand net jobs. Remember that the overall result represents a fairly poor annual growth in employment.
However, full-time employment growth for teenagers over the last 12 months has been negative.
The teenage segment of the labour market is being particularly dragged down by the sluggish employment growth, which is hardly surprising given that the least experienced and/or most disadvantaged (those with disabilities etc) are rationed to the back of the queue by the employers.
The following graph shows the change in aggregates over the last 12 months. It is as if the teenagers have not had a stake in the labour market either way (blue bars barely visible).
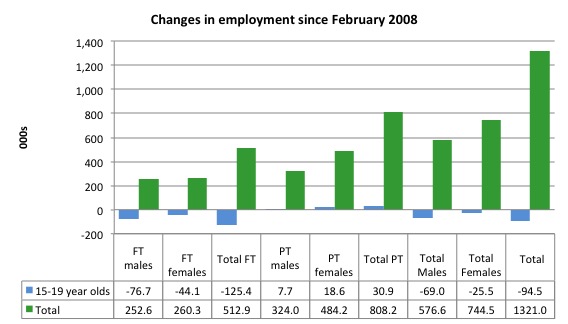
To further emphasise the plight of our teenagers, the following graph extends the time period from February 2008, which was the month when the unemployment rate was at its low point in the last cycle, to the present month (July 2016). So it includes the period of downturn and then the so-called “recovery” period. Note the change in vertical scale compared to the previous two graphs.
Since February 2008, there have been only 1,321 thousand (net) jobs added to the Australian economy but teenagers have lost a staggering 94.5 thousand over the same period. It is even more stark when you consider that 125.4 thousand full-time teenager jobs have been lost in net terms.
Even in the traditionally, concentrated teenage segment – part-time employment, teenagers have gained only 30.9 thousand jobs (net) even though 808.2 thousand part-time jobs have been added overall.
Overall, the total employment increase is modest. Further, around 62 per cent of the total (net) jobs added since February 2008 have been part-time, which raises questions about the quality of work that is being generated overall.
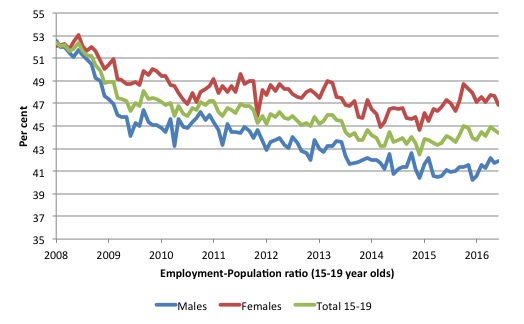
To put the teenage employment situation in a scale context the following graph shows the Employment-Population ratios for males, females and total 15-19 year olds since February 2008 (the month which coincided with the low-point unemployment rate of the last cycle).
You can interpret this graph as depicting the loss of employment relative to the underlying population of each cohort. We would expect (at least) that this ratio should be constant if not rising somewhat (depending on school participation rates).
The facts are that the absolute loss of jobs reported above is depicting a disastrous situation for our teenagers. Males, in particular, have lost out severely as a result of the economy being deliberately stifled by austerity policy positions.
In the last few months, with the part-time employment situation improving, there has been some reversal in the downward trends in these ratios.
The male ratio has fallen by 10.6 percentage points since February 2008, the female ratio has fallen by 5.2 percentage points and the overall teenage employment-population ratio has fallen by 8.0 percentage points. That is a substantial decline in the employment market for Australian teenagers.
The other staggering statistic relating to the teenage labour market is the decline in the participation rate since the beginning of 2008 when it peaked in January at 61.4 per cent. In July 2016, the participation rate was just 54.1 per cent.
That is an additional 107.3 thousand teenagers who have dropped out of the labour force as a result of the weak conditions since the crisis.
If we added them back into the labour force the teenage unemployment rate would be 27.8 per cent rather than the official estimate for July 2016 of 18.1 per cent. Some may have decided to return to full-time education and abandoned their plans to work. But the data suggests the official unemployment rate is significantly understating the actual situation that teenagers face in the Australian labour market.
Overall, the performance of the teenage labour market remains poor. It doesn’t rate much priority in the policy debate, which is surprising given that this is our future workforce in an ageing population. Future productivity growth will determine whether the ageing population enjoys a higher standard of living than now or goes backwards.
I continue to recommend that the Australian government immediately announce a major public sector job creation program aimed at employing all the unemployed 15-19 year olds, who are not in full-time education or a credible apprenticeship program.
Unemployment decreased 5,500 to 725,500
The official unemployment rate fell by 0.1 points to 5.7 per cent in July 2016 as a result of employment growth outstripping the growth in the labour force – that is, the underlying population growth given the participation rate was constant.
Overall, the labour market still has significant excess capacity available in most areas and what growth there is is not making any major inroads into the idle pools of labour.
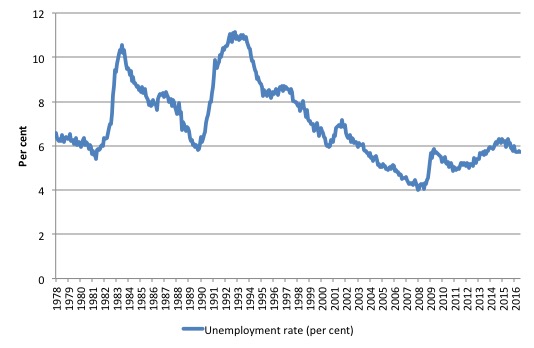
The following graph shows the national unemployment rate from February 1978 to July 2016. The longer time-series helps frame some perspective to what is happening at present.
After falling steadily as the fiscal stimulus pushed growth along, the unemployment rate slowly trended up for some months.
It is now above the peak that was reached just before the introduction of the fiscal stimulus. In other words, the gains that emerged in the recovery as a result of the fiscal stimulus in 2009-10 have now been lost.
Given the weak employment growth, the unemployment rate would be much higher if the labour force was growing as previous trend rates.
Broad labour underutilisation – upwards of 14.5 per cent
The monthly underutilisation estimates show the situation has deteriorated since the May quarterly results were released.
In July 2016, there were 1133.7 thousand underemployed persons or 8.9 per cent of the labour force. The Total underutilisation stood at 14.5 per cent
When the ABS published its quarterly broad labour underutilisation measures for the May-quarter, total underemployment was 8.4 per cent (1,067.3 persons – up by 10.3 thousand since February) and the ABS broad labour underutilisation rate (the sum of unemployment and underemployment) was 14.2 per cent (up by 0.1 percentage points).
So the situation is deteriorating.
The following graph plots the history of underemployment in Australia since February 1978 to the May-quarter 2016.

If hidden unemployment (given the depressed participation rate) is added to the broad ABS figure the best-case (conservative) scenario would see a underutilisation rate well above 16 per cent at present. Please read my blog – Australian labour underutilisation rate is at least 13.4 per cent – for more discussion on this point.
The next update will be for the August-quarter 2016 and will be published published in the September 2016 Labour Force release.
Aggregate participation rate – unchanged at 64.9 per cent and remains at depressed levels
The July 2016 participation rate remained steady at 64.9 per cent. It remains substantially down on the most recent peak in November 2010 of 65.8 per cent when the labour market was still recovering courtesy of the fiscal stimulus.
What would the unemployment rate be if the participation rate was at the last November 2010 peak level value?
The following graph tells us what would have happened if the participation rate had been constant over the period November 2010 to July 2016. The blue line is the official unemployment rate since its most recent low-point of 4 per cent in February 2008.
The red line starts at November 2010 (the peak participation month). It is computed by adding the workers that left the labour force as employment growth faltered (and the participation rate fell) back into the labour force and assuming they would have been unemployed. At present, this cohort is likely to comprise a component of the hidden unemployed (or discouraged workers).
In recent months the gap between the lines has diverged which signals a deteriorating situation.
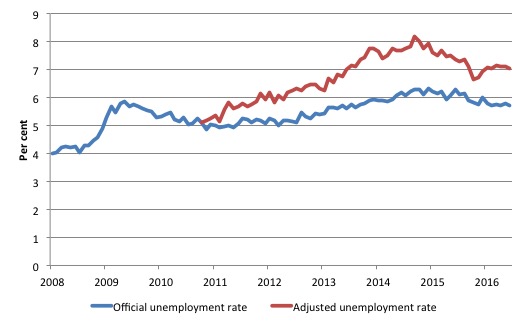
Total official unemployment in July 2016 was estimated to be 725.5 thousand. However, if participation had not have fallen relative to November 2010, there would be 904 thousand workers unemployed given growth in population and employment since November 2010.
The unemployment rate would now be 7.0 per cent if the participation had not fallen below its November 2010 peak of 65.8 per cent. The official unemployment in July 2016 was 5.7 per cent.
The difference between the two numbers mostly reflects, the change in hidden unemployment (discouraged workers) since November 2010. These workers would take a job immediately if offered one but have given up looking because there are not enough jobs and as a consequence the ABS classifies them as being Not in the Labour Force.
There has been some change in the age composition of the labour force (older workers with low participation rates becoming a higher proportion) but this only accounts for less than 1/3 of the shift. The rest is undoubtedly accounted for by the rise in hidden unemployment.
Note, the gap between the blue and red lines doesn’t sum to total hidden unemployment unless November 2010 was a full employment peak, which it clearly was not. The interpretation of the gap is that it shows the extra hidden unemployed since that time.
This gap shrinks as participation rises relative to the November 2010 peak.
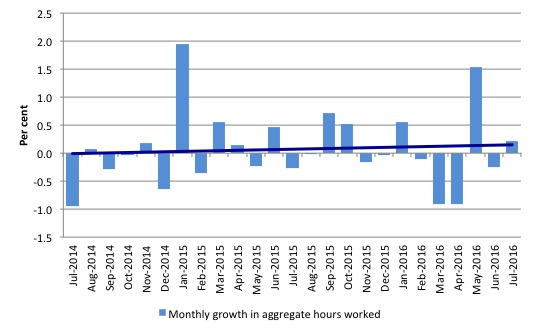
Hours worked – rose by just 0.2 per cent in July 2016
Aggregate monthly hours rose by 3.7 million hours (0.2 per cent) in July 2016 in seasonally adjusted terms after recording negative growth for the previous five months.
The following graph shows the monthly growth (in per cent) over the last 24 months. The dark linear line is a simple regression trend of the monthly change – which depicts a near zero trend
You can see the pattern of the change in working hours is also portrayed in the employment graph – zig-zagging across the zero growth line.
Conclusion
I repeat my standard monthly warning – we always have to be careful interpreting month to month movements given the way the Labour Force Survey is constructed and implemented.
Today’s figures show that while employment growth was only modestly positive in July 2016, the real story is the continuing collapse of full-time employment.
Full-time employment fell sharply by 45,400 in July 2016.
With more than 86 per cent of total net jobs created over the last 12 months being part-time, it is clear that Australia is becoming a nation of part-time employment growth with all the attendant negative consequences.
The monthly ABS underemployment data (not discussed here in detail) shows that underemployment rose by 0.1 points in July to 8.9 per cent (or 1133.7 thousand persons).
The conclusion remains that the overall demand side of the labour market is very weak.
The teenage labour market remains in a poor state even though the 15-19 year olds enjoyed some part-time employment growth.
I consider this situation to warrant immediate attention by the Federal Government. The neglect of our teenagers will have a very long memory indeed and the negative consequences will be stronger given the ageing population.
The Federal government appears unwilling to address this dire issue.
That is enough for today!
(c) Copyright 2016 William Mitchell. All Rights Reserved
Hi Bill
i don’t think a part-time employment nation is something to worry about
actually i think it should be part of your progressive manifesto
i cannot understand why you often stress the need for a JG
and hardly for a reduction of the working hours
I found it interesting that the 2016 Census did not ask people whether their employment was full or part time and whether it was permanent or casual. Why wouldn’t the ABS take the opportunity to get accurate figures of the changes to the workforce?
“I don’t think a part-time employment nation is something to worry about”
Part-time employment is not necessarily underemployment. The latter generally refers to workers who are willing and able to work more, but can’t get the hours.
@Jan,
Presumably some workers are happy to work part-time but I suggest for many others its involuntary and leaves them without adequate income. A reduction on working hours would be beneficial but only if pay was more like fulltime rates.
Dear Jan (at 2016/08/18 at 4:58 pm)
A rising proportion of part-time workers indicate they desire extra hours of work – that is they are underemployed – 1.1 million of them. On Average they desire around 15.1 hours extra work per week.
That is a lot of people who are unsatisfied and underpaid and a lot of hours that are not being used to generate income.
Further, an increasing proportion of part-time jobs are actually casual without entitlements. They are precarious, lowly-paid, offer no hope of holidays, access to mortgage credit and present difficulties to the workers with things like child care etc.
So the trend to being a part-time nation is very disturbing.
Introducing a JG would force the employers to restructure these jobs to match the preferences of the workers or else lose the workforce to the JG where entitlements, security, reasonable pay would be the norm.
best wishes
bill
Hi Bill,
I have spoken to many about the JG and the proposal that the govt. could fund it by creating the currency. While many think the JG is a good idea not one has liked the idea of creating the currency to fund it.Many just don’t understand and those that do are much opposed to printing money.
So my question is this …. would it be possible to calculate the cost of setting up the JG – considering the savings from defunding the job agencies, savings in poverty alleviation programs, job ready training programs etc. Perhaps also considering the extra tax revenue as the money is spent in the economy.
I’m guessing the real cost would be quite affordable.
What do you think?
I never worked as a teen.
Bill,
thanks very much for your reply. I’m from Italy, i’m from a country where underemployment is really high during the last years, so i’m aware of the problem. What i wanted to emphasize is that an orderly reduction of the working hours should be part of a progressive manifesto, just like the JG. I’d like to know your opinion about that and if you will deal with it in your next book. thanks
@Danny Turner, you could get a reasonable estimate of the first-order costs and benefits fairly easily with some back-of-the envelope calculations as below.
Expenses
Wages: 725,490 unemployed x $34,164 annual minimum wage x 1.095 superannuation = $27.14B
Revenues:
Income tax: 0.19 marginal tax x ($34,164 – $18,200) x 725,490 = $2.2B
GST: 0.919 consumption rate* x $31,130.84 salary after tax x 0.1 GST = $2.1B
Net contribution to budget expenditure:
$27.14B – $4.3B = $22.84B
That’s a net cost of 5 to 6% of the current budget, depending on whether you’re measuring against revenue or expenditure. Not far off the cost of the NDIS, which the electorate did show support for.
A more thorough study might look at flow-on effects to the participation rate, company taxes from higher consumption and of course the capacity for existing welfare programs to be replaced by the JG. Honestly I’m skeptical of the huge savings from that last one, since much of the welfare spending is currently targeted at people with no capacity to work (sick and elderly) or may already be working (families with children). And job assistance only takes up $1.9B which is somewhat negligible.
Jan, people want to work that’s the point they can’t get a job to work more which a JG solves without being inflationary like a basic income plus psychologically for humans who want to work it solves many other issues.
Jake, you’re luck your parents gave you money to spend during your teens? Someone was earning it I’m guessing.
Peter, I’m overseas currently but wow if they didn’t ask that. I don’t think the current government wants it known.
Bill,
Are the self employed included in the figures? I ask because this class of employment is ignored in the UK as regards pay, hours worked etc.
Jason i am not against the jg. I know It solves many issues but i would like to see a reduction of the working hours in a progressive manifesto, because in my opinion it will solve many issues as well.
Danny – It does seem that people are stubbornly against “printing money”, but there is little chance of full employment at the current level of money in circulation. Tax redistribution to offset JG spending won’t do the job and won’t be seen as fair anyway. You have to put it to people: high unemployment or printing money. Print money or you children and grand children will never get a proper job. Those are the choices. It is a pain that people won’t engage the grey matter on this point.
Brendanm. I’d be distancing myself from the phrase printing money as it’s not quite what MMT is advocating.
In fact, I don’t think I have read anything from Bill which deems the printing of money as necessary to create full employment.
Bill said:
“Introducing a JG would force the employers to restructure these jobs to match the preferences of the workers or else lose the workforce to the JG where entitlements, security, reasonable pay would be the norm.”
What makes you think Employers wouldn’t seek solutions offshore / overseas ?
“What makes you think Employers wouldn’t seek solutions offshore / overseas ?”
No so much of a problem. The people and resources remain here, so you just put them to some other use. The good companies remain here.
Hello Bill
I heard you talking on the radio, and I am encouraged to hear at last, some-one talking common sense on this subject.
The Australian and State Governements need to address this problem urgently, after all, they are the ones who have contributed to creating it.
The longer they leave it, the worse it will get.
Hi Bill,
Love this post… 18 Aug 2016 (Bill) thanks for all the great information. I currently have 3 part-time jobs and anyone that has to be in this situation isn’t happy about it. Juggling the three employers that pay as little as possible to part-time workers is quite the challenge. I need these three jobs to support myself. Permanent jobs are no longer. Casual employment and contract work (using your own ABN) rules the human resource departments.
The NSW government have a NSW Job Fund that helps worker +65 up. The problem is that people in their prime (aged 40+) without work are likely to become dependent on government pensions to survive in their later years because they can’t get gainful employment to put money away for their retirement.
Kathleen
Job Hunt Helper