Today (March 6, 2024), the Australian Bureau of Statistics released the latest - Australian National…
Australian national accounts – public spending saves nation from negative growth
Last we we learned that investment in Australia has plunged in the June-quarter. Yesterday, we learned that the external deficit has risen and the contraction in net domestic spending would reduce real GDP growth by 0.2 percentage points. Today, the Australian Bureau of Statistics released the – June-quarter 2016 National Accounts data – which showed that real GDP has slowed significantly in the most recent quarter, growing by only 0.5 per cent (down from 1 per cent in the three months to March 2016). The March-quarter result is now looking like an aberration. Without that public spending contribution to growth, which was dominant in the June-quarter, Australia have recorded negative growth in that quarter. The contribution from non-government spending netted out to minus 0.5 percentage points with negative contributions from the external sector and private capital formation and a declining contribution from private households. The on-going negative growth in private investment means that potential output in Australia and future growth rates will be lower than otherwise. Not a positive sign. The data continues to confirm that Australia faces a very uncertain outlook and if public spending is cut in the current quarter then the nation is heading for recession. That should be a huge wake up call for the Federal government which is currently trying to bully the Senate into accepting a $A6 billion cut in federal public expenditure.
The main features of the National Accounts release for the June-quarter 2016 were (seasonally adjusted):
- Real GDP increased by 0.5 per cent after recording a 1 per cent increase in the March-quarter. The annual growth rate is 3.1 per cent, which is barely sufficient to keep unemployment from rising given productivity and labour force growth.
- The annualised extrapolation from the June-quarter result is 2 per cent growth and if that trend is realised then Australia was entering a major slump in the second-quarter.
- The main positive contributor to real GDP growth was Public investment spending, which contributed 0.7 percentage points, followed by Public consumption expenditure (0.3 percentage points) and Household final consumption expenditure (0.2 percentage points).
- The main negative factors were the decline in Private gross fixed capital formation (0.7 percentage point negative impact on growth) and the external sector (0.2 percentage point negative impact).
- Our Terms of Trade (seasonally adjusted) rose by 2.3 per cent in the quarter, but have fallen by a substantial 5.4 per cent over the 12 months to the end of June 2016.
- Real net national disposable income, which is a broader measure of change in national economic well-being rose by 0.6 per cent for the quarter and by 2.3 per cent for the 12 months to the June-quarter 2016, which means that Australians are better off (on average) than they were at that point 12 months ago.
- The Household saving ratio was stable at 8 per cent but remains well below the levels we saw just after the GFC. The problem now is that flat wages are straining households who are resorting to credit to sustain consumption expenditure.
Overall growth picture – slower growth and saved by public sector expenditure
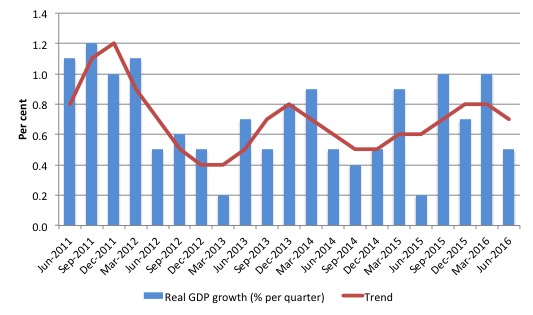
The following graph shows the quarterly percentage growth in real GDP over the last five years to the June-quarter 2016 (blue columns) and the ABS trend series (red line) superimposed.
Growth slowed in the June-quarter 2016 to 0.5 per cent (annualised 2 per cent). The annual growth figure of 3.1 per cent is around trend but is biased by two rather large quarters (September 2015 and March 2016).
The annualised growth from this quarter (if continued) will represent a major slump in the economy.
As we will see later, it was a large boost in public sector infrastructure spending that saved the economy from negative growth this quarter such is the overall weakness of non-government spending.
The mining boom was thought to be in two stages.
First, the investment boom as new productive infrastructure was being constructed (railways, ports, loaders, new sites etc). That boom is over.
Second, the export boom that would result from the enlarged productive capacity. The second stage relied on continued growth in China to boost volumes and the prices remaining at elevated levels.
While exports continued to grow (with an uptick in the terms of trade), the external sector overall subtracted from growth (see below).
Add to that the fact that domestic wages growth is flat and household indebtedness is at record levels and you have a fairly sober outlook.
If the government sector persists in implementing its planned spending cuts then recession looms for the Australian economy.
Analysis of Expenditure Components
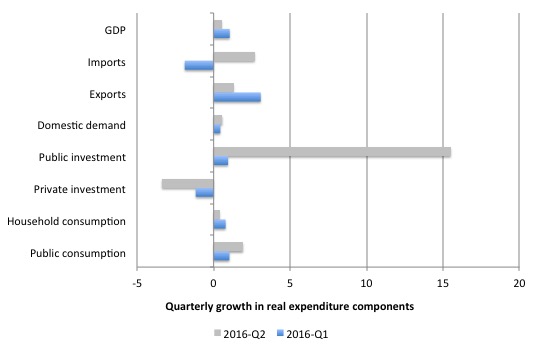
The following graph shows the quarterly percentage growth for the major expenditure components in real terms for the June-quarter 2016 (gray bars) and the March-quarter 2016 (blue bars).
The dominance of the public sector expenditure in this result is clear.
Domestic demand growth barely grew in the June quarter (0.57 per cent) up from 0.43 per cent in the March-quarter 2016.
This was the result of continued growth in household consumption (0.39 per cent growth down from 0.78 per cent) – a substantial decline (which is also likely to be continuing into the third-quarter given last week’s zero retail sales growth).
But it was the increase in public spending that was dominant – public consumption spending grew by 1.92 per cent in the June-quarter 2016 (up from 1.03 per cent) and there was substantial growth in public capital formation (15.5 per cent up from 0.94 per cent).
The ABS inform us that the growth in public investment spending was largely due to the State and Local governments – mostly large transport infrastructure projects – rail and road.
Private investment continued to fall (-3.4 per cent) after a decline of 1.2 per cent in the March-quarter 2016.
The standout growth in exports in the March-quarter slumped was followed by more subdued growth in the June-quarter (1.3 per cent) despite a 2.3 per cent improvement in the Terms of Trade.
Growth in import spending outstripped the growth in exports meaning that the external trade contribution to growth was negative (see below).
Contributions to growth
What components of expenditure added to and subtracted from real GDP growth in the June-quarter 2016?
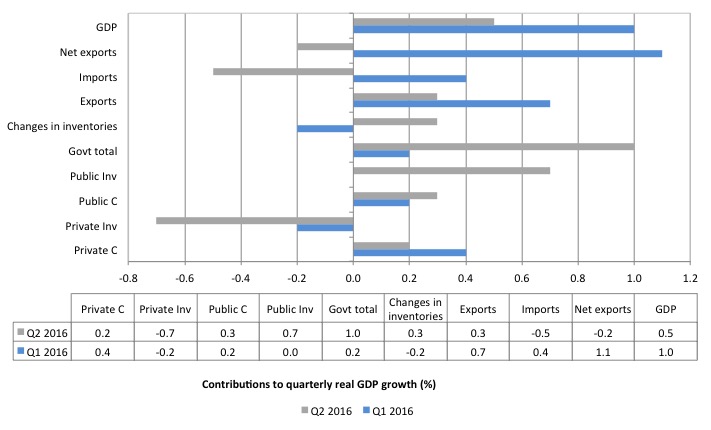
The following bar graph shows the contributions to real GDP growth (in percentage points) for the main expenditure categories. It compares the June-quarter 2016 contributions (gray bars) with the March-quarter 2016 (blue bars).
The reversal in contribution from the external sector is particularly notable. Net exports subtracted 0.2 percentage points from growth in the June-quarter (down from 1.1 percentage points) driven by a slowdown in exports and a rise in imports.
Private household consumption contributed 0.2 percentage points which was a substantial fall relative to the March-quarter contribution.
Public consumption was relatively stable (0.3 percentage points compared to 0.2 in the last quarter).
But it was public investment (capital formation) that shot up from a zero contribution in the March-quarter to 0.7 percentage points in the June-quarter.
The overall contribution of the government sector to growth was 1 percentage points.
Without that public contribution, Australia would be headed for recession and would have recorded negative growth in the June-quarter.
The overall contribution of private investment on growth continued to be negative (-0.7 percentage points), which confirms that the investment cycle associated with the mining boom is well and truly over and non-mining investment is not picking up the slack.
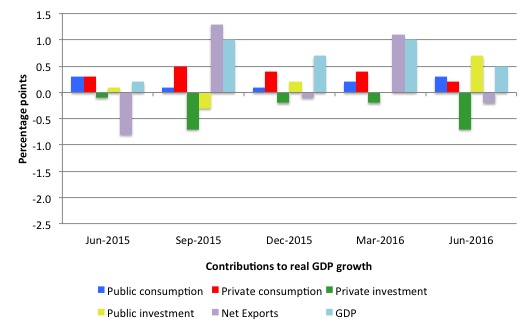
The next graph shows the contributions to real GDP growth of the major expenditure aggregates since the June-quarter 2015 (in percentage points). The total real GDP growth (in per cent) is also included as a reference.
The volatility of the exports contribution is notable as is the slowdown in contribution from household consumption.
Australians are better off now in income terms than they were in June 2015
The ABS tell us that:
A broader measure of change in national economic well-being is Real net national disposable income. This measure adjusts the volume measure of GDP for the Terms of trade effect, Real net incomes from overseas and Consumption of fixed capital.
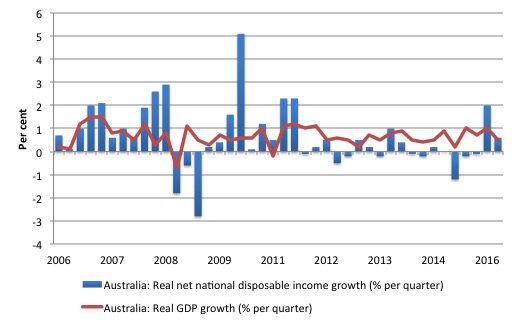
While real GDP growth (that is, total output produced in volume terms) grew by 0.5 per cent in the June-quarter, real net national disposable income growth grew by 0.6 per cent (down from 2 per cent in the June-quarter).
Real net national disposable income growth has been weak since 2011 and has been criss-crossing the zero line for the last three or so years.
Over the last year (to end of June 2016), real net national disposable income has increased by 2.3 per cent which means that Australians are better off in income terms than they were in June 2015.
The following graph shows the evolution of the quarterly growth rates for the two series since the June-quarter 2006. You can see that the divergence between real growth in output (and income that is generated by the economy) and the real net national disposable income (the real income Australians get) over the last few years ended in the March-quarter, even though the growth in real net national disposable income slowed substantially in the June-quarter 2016.
Household saving ratio stable at 8 per cent
The squeeze on wages in Australia is manifesting in two ways. Rising indebtedness and falling saving out of disposable income.
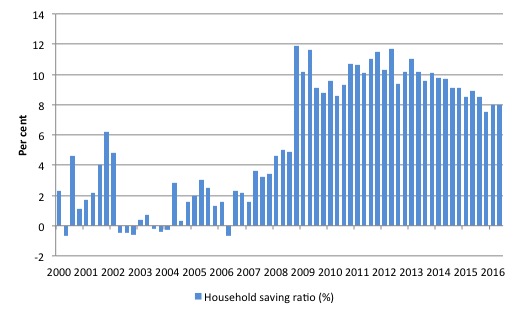
The following graph shows the household saving ratio (% of disposable income) from 2000 to the current period. The household saving ratio was stable at 8 per cent in the June-quarter 2016 arresting the decline from 2013.
Further, even though Household consumption expenditure remains positive and helping maintain overall growth in the face of negative private investment and faltering exports, it is decelerating as a result of subdued real wages.
The decline in the Household saving ratio from its 2011 levels was associated with a renewed rise in household indebtedness – back to record levels.
After the GFC hit, the household sector sought to reduce the precariousness in its balance sheet exposed by the GFC.
Prior to the crisis, households maintained very robust spending (including housing) by accumulating record levels of debt. As the crisis hit, it was only because the central bank reduced interest rates quickly, that there were not mass bankruptcies.
In June 2012, the ratio was 11.6 per cent. Since the December-quarter 2013, it has been steadily falling as the squeze on wages has intensified.
While the recent trend has been downwards, it is unlikely that households will return to the very low and negative saving ratios at the height of the credit binge given that the household sector is now carrying record levels of debt.
At some point, household consumption growth will fall unless growth is supported by public spending (given the poor outlook for private investment and net exports).
This also means that government surpluses which were strong>only were made possible by the household credit binge are untenable in this new (old) climate.
The Government needs to learn about these macroeconomic connections. It will learn the hard way as net exports weaken if it tries to impose austerity.
Real GDP growth and hours worked
Over the last several years, there has been the sharp dislocation between what is happening in the labour market and what the National Accounts data has been telling us.
Growth in employment and hours worked has been very modest over the period while annual real GDP growth has been around 3 per cent.
At those GDP growth rates, employment growth should be much stronger than it has been.
Today’s data shows that GDP per hour worked (productivity of labour) rose sharply in the June-quarter 2016 (2.7 per cent) after rising by 1.3 per cent in the March-quarter 2016.
So while real GDP grew by 0.5 per cent, the rising labour productivity was associated with a sharp decline in hours worked (-1.1 per cent).
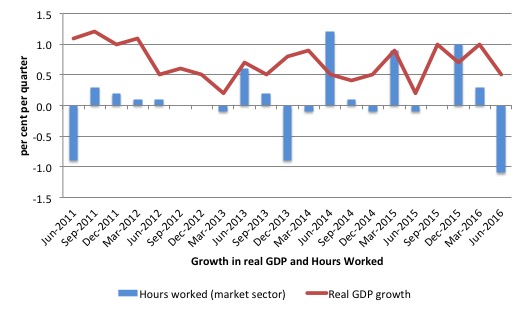
The following graph presents quarterly growth rates in trend GDP and hours worked using the National Accounts data for the last five years to the June-quarter 2016.
You can see the major dislocation between the two measures that appeared in the middle of 2011 persisted throughout 2013 and has reasserted itself in recent quarters.
The GDP growth has driven by capital-intensive exports and more recently, capital infrastructure growth, which is one reason why labour productivity growth has been strong and employment growth weak.
Just in case you think the labour force data is suspect, the hours worked computed from that data is very similar to that computed from the National Accounts.
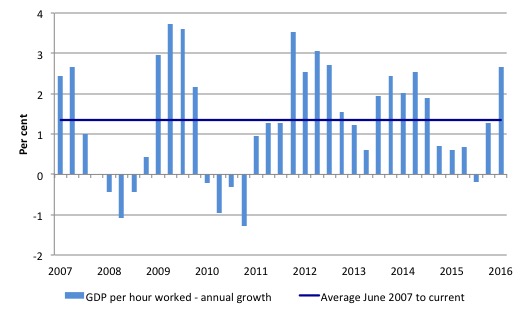
To see the above graph from a different perspective, the next graph shows the annual growth in GDP per hour worked (so a measure of labour productivity) from the June-quarter 2007 quarter to the June-quarter 2016. The horizontal blue line is the average annual growth since June-quarter 2007.
The relatively strong growth in labour productivity in 2012 and the mostly above average growth in 2013 and 2014 helps explain why employment growth has been lagging given the real GDP growth. Growth in labour productivity means that for each output level less labour is required.
In the June-quarter 2016, annual labour productivity growth was 2.7 per cent (above the recent average of 1.3 per cent).
Conclusion
Remember that the National Accounts data is three months old – a rear-vision view of what has passed and to use it to predict trends is difficult
Today’s National Accounts data indicates that the Australian economy weakened in the June-quarter and entered what I believe to be a precarious period notwithstanding the 3.1 per cent annual growth rate (June to June).
That growth rate was distorted by two exceptional quarters (September 2015 and March 2016) and the June result and subsequent data releases (for example, retail sales) suggests that the next year will see below trend growth and elevated levels of labour underutilisation.
The strong export performance in the March-quarter was not repeated even though the terms of trade improved in the June-quarter. I wrote at the time that I suspected next quarter’s net export results would be less favourable. They were – substantially so.
The external sector undermined growth in the June-quarter 2016.
Growth in domestic demand was relatively weak as a result of the continued decline in private investment expenditure and the weakening household consumption performance.
The weak private investment outcomes are undermining future prosperity.
The negative growth in private investment means that potential output in Australia and future growth rates will be lower than otherwise. Again, not a positive sign.
But the stunning result is that without the dominant contribution from the government sector – both in recurrrent spending (consumption) and public capital formation (mostly State and Local transport infrastructure projects) – Australia would have recorded a sharp negative real GDP growth result in the June-quarter.
With domestic wages growth flat and household indebtedness at record levels, I don’t suspect a huge contribution from household consumption in the coming quarters.
Private investment is forecast to contract further.
So if the government sector persists in implementing its planned spending cuts then recession looms for the Australian economy.
That is enough for today!
(c) Copyright 2016 William Mitchell. All Rights Reserved.
Morrison and others are trumpeting that this is a stunning result.
From the talk coming out of the G20 , the global economy appears to be caught in a quagmire. The rumblings from there all sound pretty much like this: declining investment and demand are depressing sales and jobs; as the politicians stand about scratching their heads wondering what could possibly be wrong?
Military spending again saves the liberals from a recession like Hockey did. Yet they can’t see a link? I think they know it’s surely too obvious but they can’t back down.
… recall Jason that it was the Abbott’s mob who would have had those dammned submarines bought off the shelf from Japan.