Today (April 18, 2024), the Australian Bureau of Statistics released the latest - Labour Force,…
Australian labour market – staggering along and in trend deterioration
Yesterday, the ABS released its Wage Price Index data for the September-2016, which showed the record low wages growth is continuing. The latest labour force data released today by the Australian Bureau of Statistics – Labour Force data – for October 2016 shows that predictions that this low wages growth would be good for employment were, unsurprisingly, false. Total employment barely increased and the ABS said the trend to part-time work has intensified. Over the last 12 months, Australia has produced only 102.2 thousand (net) jobs with 136.9 thousand of them being part-time jobs. In other words, full-time employment has fallen by 34.7 thousand jobs over the same period. Australia maintains its status as the nation of part-time employment growth with all the attendant negative consequences. The teenage labour market remains in a poor state and contracted sharply again in October. It requires urgent policy intervention. Overall, with weak private investment now on-going, the Australian labour market is looking in pretty dismal shape and the Federal government should immediately renounce its ill-informed austerity narrative and announce a rather sizeable fiscal stimulus to provide some fiscal leadership to the nation. This should include a large-scale public sector job creation program which would ensure teenagers regained the jobs that have been lost due to the fiscal drag over the last several years. The deteriorating data is staring us all in the face now! There is no room for nuance.
The summary ABS Labour Force (seasonally adjusted) estimates for October 2016 are:
- Employment increased by 9,800 (0.1 per cent) with full-time employment increasing by 41,500 and part-time employment decreasing by 31,700.
- Unemployment fell by 2,000 to 705,100.
- The official unemployment rate remained steady to 5.6 per cent.
- The participation rate remained steady at 64.4 per cent. It had previously fallen by 0.4 pts in the last two months and remains well below its November 2010 peak (recent) of 65.8 per cent.
- Aggregate monthly hours worked increased 14.3 million hours (0.86 per cent).
- In the August quarter, underemployment rose by 38.1 thousand at 8.7 per cent of the labour force. The total labour underutilisation rate (unemployment plus underemployment) rose by 0.1 per cent to 14.3 per cent. There were 1,0110.1 thousand persons underemployed and a total of 1,8815.2 thousand workers either unemployed or underemployed.
Employment growth – fairly subdued
While the ABS recorded a decline of 1 thousand persons employed in trend terms, it estimated in seasonally-adjusted terms, that total (net) employment in October 2016 increased by 9,800 jobs with full-time employment increasing by 41,500 and part-time employment decreasing by 31,700.
I indicated several months ago that Australia was becoming a part-time employment nation. That trend has consolidated.
The ABS said that in terms of its trend data:
In October 2016, trend employment decreased by 1,000 persons to 11,946,600 persons, the first decrease in the trend series since November 2013. This slight fall in trend employment reflected an increase in part-time employment of 8,400 persons being more than offset by a decrease in full-time employment of 9,500 persons.
Since December 2015 we have seen a continued decline in trend full-time employment and an increase in part-time employment, with a corresponding increase in the share of hours worked by part-time workers. This shift to part-time employment has been more pronounced for males compared to females.
Over the past year, part-time employment has increased from around 31 per cent of employment to 32 per cent. That’s a relatively large shift, if you consider that it was around 29 per cent 10 years ago.
Since December 2015, there are now around 132,700 more persons working part-time, compared with a 69,900 decrease in those working full-time.
The combination of very weak pay outcomes and an increasing bias towards part-time and casualised work has major ramifications for the nation, where the household sector is now bogged down with record levels of indebtedness. A perfect storm is brewing.
In seasonally-adjusted terms, 134 per cent of the net jobs created in Australia in the last 12 months have been part-time.
Over the last 6 months this trend intensified, with full-time employment going backwards and part-time employment accounting for 183 per cent of the net job creation (see below).
The zig-zag pattern that we have observed over the last 36 months or so – where the employment estimates have been switching back and forth regularly between negative employment growth and positive growth with the occasional spikes – continues.
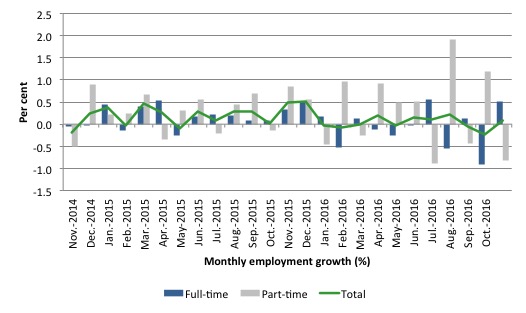
The following graph shows the month by month growth in full-time (blue columns), part-time (grey columns) and total employment (green line) for the 24 months to October 2016 using seasonally adjusted data.
It gives you a good impression of just how flat employment growth has been over the last 2 years. You can also see the dominance of part-time employment growth over the same period, especially in the last year or so.
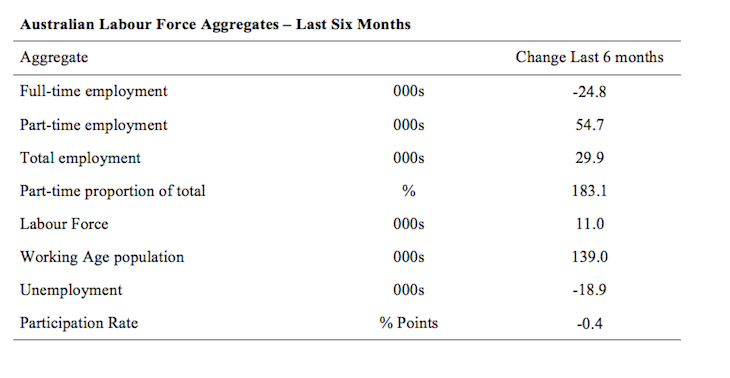
The following table provides an accounting summary of the labour market performance over the last six months. The monthly data is highly variable so this Table provides a longer view which allows for a better assessment of the trends. WAP is working age population (above 15 year olds).
Full-time employment has fallen by a massive 24.8 thousand jobs (net) while part-time work has risen by 54.7 thousand jobs.
The conclusion – overall there have only been 29.9 thousand jobs (net) added in Australia over the last six months while the labour force has barely increased (up 11 thousand). Employment growth has thus outstripped the sluggish labour supply growth with the result that unemployment has fallen by 18.9 thousand.
Employment growth (particularly the quality of the jobs) has been weak by historical standards given that the labour force growth has been very subdued, and labour force participation has declined markedly (-0.4 percentage points). The participation rate remains at depressed levels.
Overall – a fairly subdued labour market.
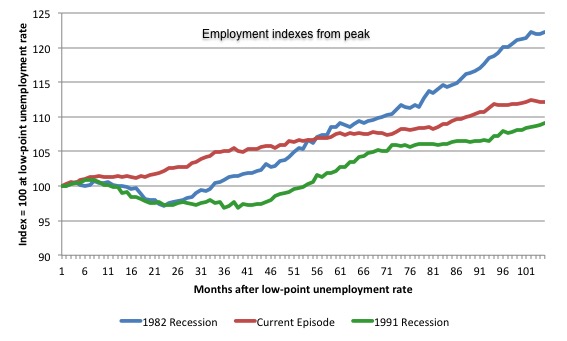
The following graph shows employment indexes for the last 3 recessions and allows us to see how the trajectory of total employment after each peak prior to the three major recessions in recent history: 1982, 1991 and 2009 (the latter to capture the current episode).
The peak is defined as the month of the low-point unemployment rate in the relevant cycle and total employment was indexed at 100 in each case and then indexed to that base for each of the months as the recession unfolded.
I have plotted the 3 episodes for 104 months after the low-point unemployment rate was reached in each cycle – the length of the current cycle.
The initial employment decline was similar for the 1982 and 1991 recessions but the 1991 recovery was delayed by many months and the return to growth much slower than the 1982 recession.
The current episode is distinguished by the lack of a major slump in total employment, which reflects the success of the large fiscal stimulus in 2008 and 2009.
However, the recovery spawned by the stimulus clearly dissipated once the fiscal position was reversed and the economy fell back into producing very subdued employment outcomes.
Since February 2008, employment has grown by a miserly 12.2 per cent, which is a very slow pace in historical terms for such a long period.
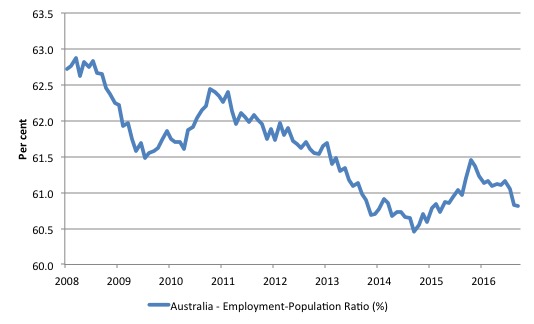
Given the variation in the labour force estimates, it is sometimes useful to examine the Employment-to-Population ratio (%) because the underlying population estimates (denominator) are less cyclical and subject to variation than the labour force estimates. This is an alternative measure of the robustness of activity to the unemployment rate, which is sensitive to those labour force swings.
The following graph shows the Employment-to-Population ratio, since February 2008 (the low-point unemployment rate of the last cycle).
It dived with the onset of the GFC, recovered under the boost provided by the fiscal stimulus packages but then went backwards again as the last Federal government imposed fiscal austerity in a hare-brained attempt at achieving a fiscal surplus.
The ratio began rising in October 2014 which suggested to some that the labour market had bottomed out and would improve slowly as long as there are no major policy contractions or cuts in private capital formation.
However, the peak in November is now gone and the ratio is once again in retreat or barely rising.
The on-going fiscal deficit is still supporting some growth in the economy as the spending associated with the mining boom disappears. But the deficit is clearly too small given the behaviour of the real aggregates.
The series remained steady in October 2016 at 60.8 per cent and remains a staggering 2.1 points below the April 2008 peak of 62.9 per cent.
So for those commentators who were praising the rise in the EPOP ratio over 2015, they will have to reappraise their assessments. The labour market is deteriorating.
Teenage labour market – sharp contraction in October
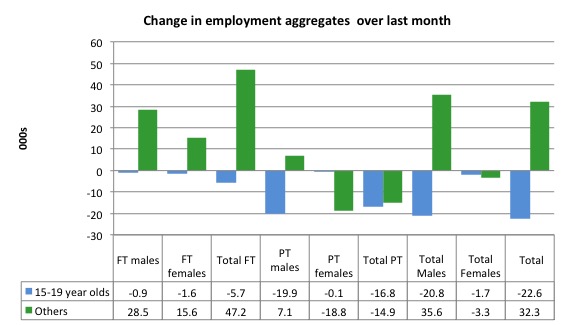
The teenage labour market saw full-time employment fall by 5.7 thousand and part-time employment fall by 16.8 thousand (net) jobs in October 2016.
Total employment thus fell by 22.6 thousand (net) continuing the poor performance of this segment of the labour market.
The following graph shows the distribution of net employment creation in the last month by full-time/part-time status and age/gender category (15-19 year olds and the rest)
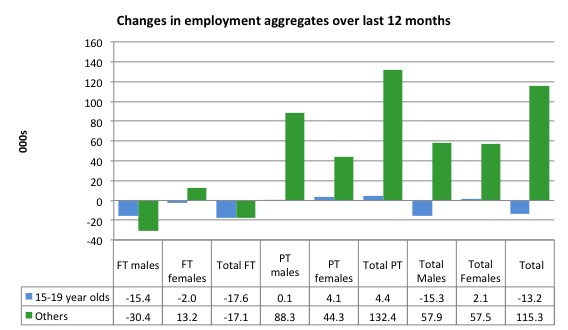
Over the last 12 months, teenagers have lost 13.2 thousand (net) jobs overall while the rest of the labour force have gained 115.3 thousand net jobs. Remember that the overall result represents a fairly poor annual growth in employment.
Full-time employment for teenagers over the last 12 months has been declined – down by 17.6 thousand.
The teenage segment of the labour market is being particularly dragged down by the sluggish employment growth, which is hardly surprising given that the least experienced and/or most disadvantaged (those with disabilities etc) are rationed to the back of the queue by the employers.
The following graph shows the change in aggregates over the last 12 months. It is as if the teenagers have not had a stake in the labour market either way (blue bars barely visible).
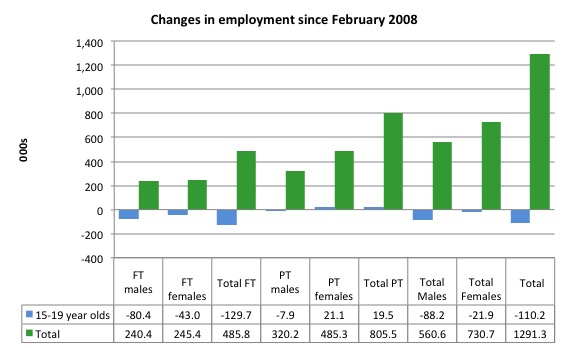
To further emphasise the plight of our teenagers, the following graph extends the time period from February 2008, which was the month when the unemployment rate was at its low point in the last cycle, to the present month (October 2016). So it includes the period of downturn and then the so-called ‘recovery’ period. Note the change in vertical scale compared to the previous two graphs.
Since February 2008, there have been only 1,291.3 thousand (net) jobs added to the Australian economy but teenagers have lost a staggering 110.2 thousand over the same period. It is even more stark when you consider that 129.7 thousand full-time teenager jobs have been lost in net terms.
Even in the traditionally, concentrated teenage segment – part-time employment, teenagers have gained only 19.5 thousand jobs (net) even though 805.5 thousand part-time jobs have been added overall.
Overall, the total employment increase is modest. Further, around 62 per cent of the total (net) jobs added since February 2008 have been part-time, which raises questions about the quality of work that is being generated overall.
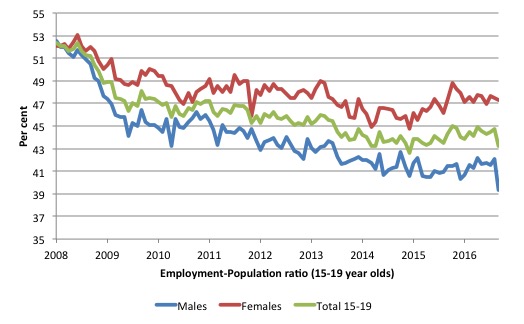
To put the teenage employment situation in a scale context the following graph shows the Employment-Population ratios for males, females and total 15-19 year olds since February 2008 (the month which coincided with the low-point unemployment rate of the last cycle).
You can interpret this graph as depicting the loss of employment relative to the underlying population of each cohort. We would expect (at least) that this ratio should be constant if not rising somewhat (depending on school participation rates).
The facts are that the absolute loss of jobs reported above is depicting a disastrous situation for our teenagers. Males, in particular, have lost out severely as a result of the economy being deliberately stifled by austerity policy positions.
In the latter months of 2015, with the part-time employment situation improving, there was some reversal in the downward trends in these ratios.
However, it appears that the ratios are now flattening out (females) or in further decline (males and total).
The male ratio has fallen by 13.2 percentage points since February 2008, the female ratio has fallen by 4.8 percentage points and the overall teenage employment-population ratio has fallen by 9.1 percentage points. That is a substantial decline in the employment market for Australian teenagers.
The other staggering statistic relating to the teenage labour market is the decline in the participation rate since the beginning of 2008 when it peaked in January at 61.4 per cent. In October 2016, the participation rate was just 52.7per cent (a decline of 2.4 points since August).
That is an additional 137.6 thousand teenagers who have dropped out of the labour force as a result of the weak conditions since the crisis.
If we added them back into the labour force the teenage unemployment rate would be 29.6 per cent rather than the official estimate for October 2016 of 17 per cent.
Some may have decided to return to full-time education and abandoned their plans to work. But the data suggests the official unemployment rate is significantly understating the actual situation that teenagers face in the Australian labour market.
Overall, the performance of the teenage labour market remains extremely poor. It doesn’t rate much priority in the policy debate, which is surprising given that this is our future workforce in an ageing population. Future productivity growth will determine whether the ageing population enjoys a higher standard of living than now or goes backwards.
I continue to recommend that the Australian government immediately announce a major public sector job creation program aimed at employing all the unemployed 15-19 year olds, who are not in full-time education or a credible apprenticeship program.
Unemployment fell by just 2,000 to 705,100 reflecting the poor employment growth
The official unemployment rate remained steady at 5.6 per cent in October 2016.
Overall, the labour market still has significant excess capacity available in most areas and what growth there is is not making any major inroads into the idle pools of labour.
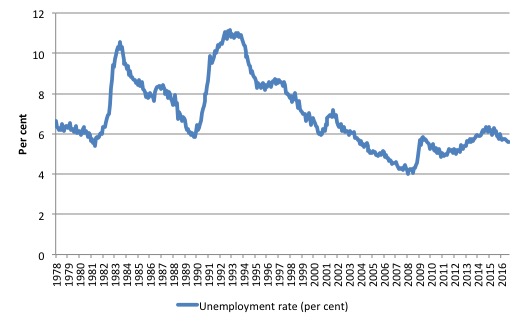
The following graph shows the national unemployment rate from February 1978 to October 2016. The longer time-series helps frame some perspective to what is happening at present.
After falling steadily as the fiscal stimulus pushed growth along, the unemployment rate slowly trended up for some months.
It is now above the peak that was reached just before the introduction of the fiscal stimulus. In other words, the gains that emerged in the recovery as a result of the fiscal stimulus in 2009-10 have now been lost.
Given the weak (negative) employment growth, the unemployment rate would be much higher if the labour force was growing as previous trend rates (see analysis below).
Broad labour underutilisation – 14.3 per cent
The monthly underutilisation series shows that (in unadjusted terms), broad labour underutilisation (the sum of unemployment and underemployment) stood at 13.5 per cent (males 11.8 per cent, females 15.5 per cent).
The breakdown is:
1. Unemployment 5.4 per cent (males 5.4 per cent, females 5.4 per cent).
2. Underemployment 8.2 per cent (males 6.5 per cent, females 10.1 per cent).
The ABS published its quarterly broad labour underutilisation measures for the August-quarter in last month’s data release.
In the August-quarter, total underemployment was 8.7 per cent (1,110.1 persons – up by 38.1 thousand or 3.6 per cent since May) and the ABS broad labour underutilisation rate (the sum of unemployment and underemployment) was 14.3 per cent (up by 0.1 percentage points).
There were 1,110.1 thousand persons underemployed and a total of 1,815.2 thousand workers either unemployed or underemployed.
The rising underemployment is consistent with the trend where Australia is becoming a part-time employment nation.
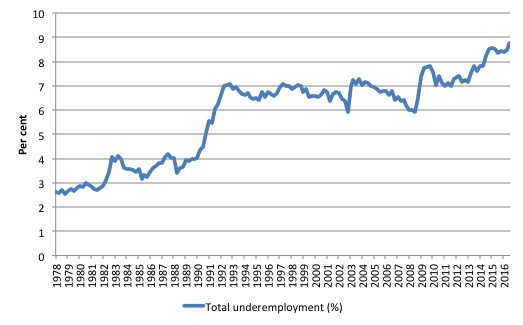
The following graph plots the history of underemployment in Australia since February 1978 to the February-quarter 2015.
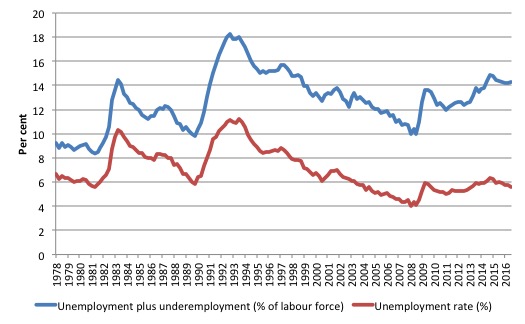
The next graph shows the evolution of the broad underutilisation rate over the same period. You can see the three cyclical peaks corresponding to the 1982, 1991 recessions and the more recent downturn.
Unemployment was a higher proportion of the two earlier peaks but underemployment now dominates the current cycle (just).
The other difference between now and the two earlier cycles is that the recovery triggered by the fiscal stimulus in 2008-09 did not persist and as soon as the ‘fiscal surplus’ fetish kicked in in 2012, things went backwards very quickly.
The two earlier peaks were sharp but steadily declined. The last peak fell away on the back of the stimulus but turned again when the stimulus was withdrawn.
If hidden unemployment (given the depressed participation rate) is added to the broad ABS figure the best-case (conservative) scenario would see a underutilisation rate well above 16 per cent at present. Please read my blog – Australian labour underutilisation rate is at least 13.4 per cent – for more discussion on this point.
The next update will be for the November-quarter 2016 and will be published published in the December 2016 Labour Force release. In between those releases, monthly estimates are available.
Aggregate participation rate – steady at 64.4 per cent and remains at depressed levels
The October 2016 participation rate remained steady at 64.4 per cent. It had previously fallen by 0.4 pts in the last two months and remains well below its November 2010 peak (recent) of 65.8 per cent.
The participation rate remains substantially down on the most recent peak in November 2010 of 65.8 per cent when the labour market was still recovering courtesy of the fiscal stimulus.
What would the unemployment rate be if the participation rate was at the last November 2010 peak level value?
The following graph tells us what would have happened if the participation rate had been constant over the period November 2010 to October 2016. The blue line is the official unemployment rate since its most recent low-point of 4 per cent in February 2008.
The red line starts at November 2010 (the peak participation month). It is computed by adding the workers that left the labour force as employment growth faltered (and the participation rate fell) back into the labour force and assuming they would have been unemployed. At present, this cohort is likely to comprise a component of the hidden unemployed (or discouraged workers).
In recent months the gap between the lines has diverged which signals a deteriorating situation.
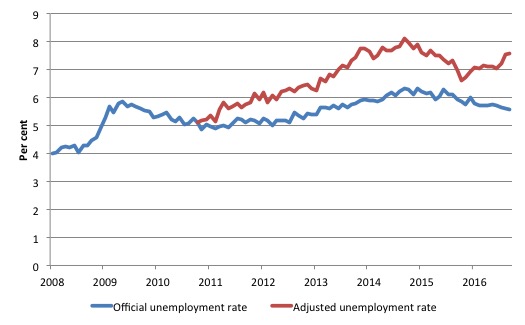
Total official unemployment in October 2016 was estimated to be 705.1 thousand. However, if participation had not have fallen relative to November 2010, there would be 978.9 thousand workers unemployed given growth in population and employment since November 2010.
The unemployment rate would now be 7.6 per cent if the participation had not fallen below its November 2010 peak of 65.8 per cent. The official unemployment in October 2016 was 5.6 per cent.
The difference between the two numbers mostly reflects, the change in hidden unemployment (discouraged workers) since November 2010. These workers would take a job immediately if offered one but have given up looking because there are not enough jobs and as a consequence the ABS classifies them as being Not in the Labour Force.
There has been some change in the age composition of the labour force (older workers with low participation rates becoming a higher proportion) but this only accounts for less than 1/3 of the shift. The rest is undoubtedly accounted for by the rise in hidden unemployment.
Note, the gap between the blue and red lines doesn’t sum to total hidden unemployment unless November 2010 was a full employment peak, which it clearly was not. The interpretation of the gap is that it shows the extra hidden unemployed since that time.
This gap shrinks as participation rises relative to the November 2010 peak.
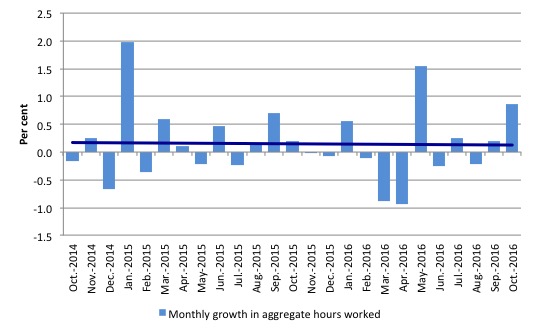
Hours worked – rose by 0.9 per cent in October 2016
Aggregate monthly hours rose by 14.3 million hours (0.86 per cent) in October 2016 in seasonally adjusted terms.
The following graph shows the monthly growth (in per cent) over the last 24 months. The dark linear line is a simple regression trend of the monthly change – which depicts a slight negative trend
You can see the pattern of the change in working hours is also portrayed in the employment graph – zig-zagging across the zero growth line.
Conclusion
I repeat my standard monthly warning – we always have to be careful interpreting month to month movements given the way the Labour Force Survey is constructed and implemented.
Today’s figures show that the Australian labour market is looking in pretty dismal shape.
Total employment barely increased and the ABS said the trend to part-time work has intensified.
Over the last 12 months, Australia has produced only 102.2 thousand (net) jobs with 136.9 thousand of them being part-time jobs. In other words, full-time employment has fallen by 34.7 thousand jobs over the same period. Australia maintains its status as the nation of part-time employment growth with all the attendant negative consequences.
The teenage labour market remains in a poor state and contracted sharply again in October. It requires urgent policy intervention.
Overall, with weak private investment now on-going, there is an urgent need for stimulus from the Federal governemnt.
A good starting point would be the introduction of a large-scale public sector job creation program, which could prioritise teenager employment in the first instance.
Even major financial market players like Bill Gross are calling for a Job Guarantee to resolve the interminable decline in working class living standards.
Speaking about the US, Gross said in his November Investment Outlook – Populism Takes a Wrong Turn – that:
Not having voted for either establishment party’s candidate, I write in amazed, almost amused bewilderment at what American voters have done to themselves …
Almost 72% agreed that “the American economy is rigged to the advantage of the rich and powerful”. Count me among them, yet in voting to deny Hillary Clinton the Henhouse, they “unwittingly” (lack of wit), let Donald Trump sneak in the side door. His tenure will be a short four years but is likely to be a damaging one for jobless and low-wage American voters …
But could a Clinton Administration have done much better? Probably not. Both the Clinton Democrats and almost all Republicans represent the corporate status quo that favors markets versus wages; Wall Street versus Main Street …
Neither party as they now stand has bold policies beyond the reach of K Street Lobbyists. To my mind, there are better solutions than either party’s election platform, such as a Keynesian/FDR job corps or a Kennedyesque AmeriCorps that puts people to work helping other people. Such programs were never emphasized by either candidate. Let’s supplement welfare with a patriotic “Help America” jobs program, even if government organized.
Digest that. I couldn’t agree more.
Unfortunately, our Federal government is bereft of progressive ideas such as those proposed by Bill Gross and is unwilling to address the parlous state of the labour market.
As Brexit and Trump revealed, the establishment (neo-liberal) elites ignore the plight of the weak and vulnerable (a growing cohort) at their own peril. Their demise cannot come sooner enough in Australia.
That is enough for today!
(c) Copyright 2016 William Mitchell. All Rights Reserved
So the Ford factory closure wasnt included in these figures ?
I doubt if the regime will do anything except continue with trying to find ways of cutting spending based on their ideology that business will somehow create jobs when the “environment” is attractive.
In the meantime Morrison and others put a spin on the figures that all is going well and as usual the mainstream media do not question them as they should.
I had the misfortune of flicking over to the ABC last night to hear Ticky Fullerton and some are bottom feeder discussing the economy and believe it or not rising interest rates and inflationary risks.
Ideological prostitution is the only reason someone as well educated would sink to this level. She should know better and start questioning people rather than praising them for being clueless bottom feeders.
Don’t worry. Our salvation was announced two days ago by Treasurer Scott Morrison and the Austrakian Business Council: “Tax cuts for multinationals would lead to stronger growth, better corporate profits and therefore higher wages”
I’m so relieved, aren’t you?
@Kathy Heyne:
.
However, as far as I remember, corporation tax is considered to be a “bad tax” by Warren Mosler and Randall Wray (because it puts nageative pressure on employee wages, and positive pressure on customer prices).
.
I’m not sure what Bill’s position on it is though.
Hi Bill
In your post you claim that there is “… an increasing bias towards part-time and casualised work “. Would you happen to know of data that shows that casualisation of the workforce has also increased?
The ABS labour force data does indicate that part-time employment has been steadily increase for several decades. Furthermore, since the start of the year, employment growth has been entirely part-time, but there is no indication that there has been a shift towards casualisation. In fact, casualisation, which the ABS defines as persons who are not entitled to paid sick and/or holiday leave (or who identify as casual), has been fairly stable at around a quarter per cent of the work force for most of the 2000s. While we could say that this is ‘too high’, it doesn’t appear to be the case that it has ‘increased’ as you suggest.
For instance, see: https://theconversation.com/factcheck-has-the-level-of-casual-employment-in-australia-stayed-steady-for-the-past-18-years-56212
Cheers
Mark
Dear Mark (at 2016/11/25 at 10:47 am)
You questioned the claim I made that casual work has been increasing and referred to an article on The Conversation to refute that claim.
The data they draw on comes from the ABS where the relevant publication (the only one that provides data of this type) is 6105.0 Australian Labour Market Statistics.
From Table 1 Employment Type: Employed persons by Sex, Full-time/part-time and Age, August 1992-August 2007 and November 2008-November 2013 we see that for Employees without paid leave entitlements (the proxy for casual work):
1998 1,696.1 thousand (total 8,555.6 thousand) proportion = 19.8 per cent.
2013 2,302.3 thousand (total 11,573.8 thousand) proportion = 19.9 per cent.
So between those time spans there has been no change.
But you forget to mention in your comment that the Conversation Fact Check was responding to a claim by an industry employer body (AiG) who have a vested interest in making out that there has not been an increase in casual employment as a proportion of the total.
That group consistently tries to use the wage setting tribunals in Australia to reduce working conditions and suppress wage rises.
So the choice of this sample (1998 to 2013) is very convenient and deliberately made to suppress the reality.
In fact, the actual ABS data set runs from 1992 to 2013 (being the latest version of the series). Analysis of this full period (which is the actual cycle since the 1991 recession) gives a different story and one that is consistent with my claim that casual employment has risen in the cycle as a proportion of total employment.
Employees without paid leave entitlements:
In 1992, employees without paid leave entitlements (1,294.3 thousand) comprised 16.9 per cent of total employment.
By 2013 (the latest data available), this proportion had risen to 19.9 per cent (2302.3 thousand).
best wishes
bill