Today (March 6, 2024), the Australian Bureau of Statistics released the latest - Australian National…
Australian national accounts – inexorably marching towards recession
In the June-quarter, it was only the contribution of public spending that allowed the Australian economy to avoid negative growth. That contribution disappeared in the September-quarter and given the fiscal settings and the negative investment contributions it was obvious that Australia would slide closer to recession – recording negative growth for the first time since the September-quarter 2011. The fact is that the non-mining part of the economy is already in recession and has been for some time. Today, the Australian Bureau of Statistics released the – September-quarter 2016 National Accounts data – which showed that real GDP had indeed slumped to record a negative 0.5 per cent outcome. Annual growth (last four quarters) has fallen to 1.8 per cent, but the September-quarter outcome is closer to where we are now rather than what happened towards the end of last year and earlier this year. The Australian economy has been marching inexorably towards recession for the best part of this year and government refuses to budge from its attempts to impose fiscal austerity. Madness is a euphemism for their policy conduct. Incompetent also comes to mind. the September-quarter result has been driven by a negative contribution from private capital formation, net exports and now public spending. The only on-going positive contribution to growth came from household spending. My experimental research (which I will blog about when I am more certain of the methodology) show that when we take out the mining sector, Australia has been in recession or near it for some quarters and only the government contribution has made the difference between the two states. The on-going negative growth in private investment means that potential output in Australia and future growth rates will be lower than otherwise. Not a positive sign. The data continues to confirm that Australia faces a very uncertain outlook and with the Federal government intent on imposing austerity, then the nation is probably already recession overall (given the National Accounts data is already three months old). That should be a huge wake up call for the Federal government which is currently trying to bully the Senate into accepting massive cuts in public expenditure.
The main features of the National Accounts release for the September-quarter 2016 were (seasonally adjusted):
- Real GDP decreased by 0.5 per cent after recording a 0.5 per cent increase in the June-quarter. The annual growth rate is 1.8 per cent, which is well below the rate that is required to keep unemployment from rising given productivity and labour force growth.
- The annualised extrapolation from the September-quarter result is minus 2 per cent growth – that is recession. Another quarter like the last and Australia will enter recession.
- The main positive contributor to real GDP growth was Household final consumption expenditure (0.3 percentage points).
- The main negative contributing factors were the decline in Private gross fixed capital formation (0.6 percentage point negative impact on growth), Public capital formation (-0.5 points negative impact on growth), and the external sector (0.2 percentage point negative impact).
- The public sector overall (consumption and investment) undermined growth in the September-quarter by 0.5 points.
- Our Terms of Trade (seasonally adjusted) rose by 4.5 per cent in the quarter and 1.5 per cent over the 12 months to the end of June 2016. This is a reversal of the recent negative trend and only serves to show how bad today’s figures are.
- Real net national disposable income, which is a broader measure of change in national economic well-being rose by 0.8 per cent for the quarter and by 3.2 per cent for the 12 months to the September-quarter 2016, which means that Australians are better off (on average) than they were at that point 12 months ago.
- The Household saving ratio (from disposable income) fell from 8 per cent to 6.3 per cent and remains well below the levels we saw just after the GFC. The problem now is that flat wages are straining households who are resorting to credit to sustain consumption expenditure.
Overall growth picture – negative growth returns – recession next unless policy changes
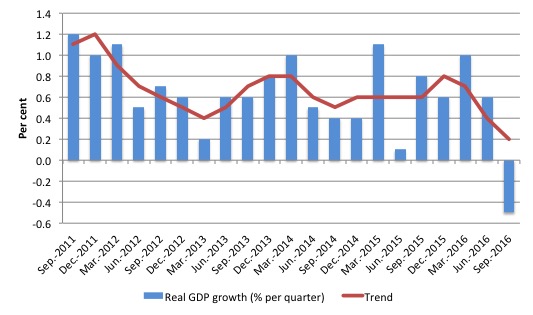
The following graph shows the quarterly percentage growth in real GDP over the last five years to the September-quarter 2016 (blue columns) and the ABS trend series (red line) superimposed.
Growth was negative in the September-quarter 2016 – minus 0.5 per cent (annualised minus 2 per cent).
The annual growth figure of 1.8 per cent is down from 3.1 per cent in the June-quarter and shows how far the economy has slipped. It is now well below trend growth and well below the figure required to maintain stable unemployment (much less reduce it).
The annualised growth from this quarter (if continued) means Australia will enter a deep and totally unnecessary recession that has been chosen by the Federal Government, which claims it is intent on pursuing a fiscal surplus.
The automatic stabilisers are already working against that and the ABS announced yesterday that Taxation revenue fell a further 15.3 per cent in the September-quarter against a very small increase in spending.
In the June-quarter, it was the large boost in public sector infrastructure spending that saved the economy from negative growth such was the overall weakness of non-government spending. As we will see soon, that contribution turned negative and so went the aggregate growth position.
While exports continued to grow (with an uptick in the terms of trade), the external sector overall subtracted from growth (see below).
Add to that the fact that domestic wages growth is flat and household indebtedness is at record levels and you have a fairly sober outlook.
If the government sector persists in implementing its planned spending cuts then recession looms for the Australian economy.
The graph clearly shows that the trend has been downwards for 4-quarters now and will hit zero by the time we learn about the current December-quarter data unless there is a dramatic shift in government policy. It must announce renewed stimulus or face recession.
Analysis of Expenditure Components
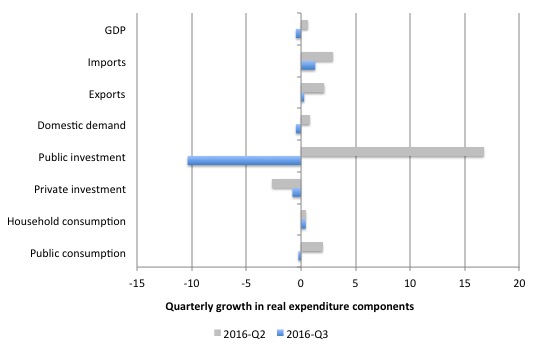
The following graph shows the quarterly percentage growth for the major expenditure components in real terms for the September-quarter 2016 (blue bars) and the June-quarter 2016 (grey bars).
The large swing in public sector expenditure is clear and largely responsible for the negative growth overall.
Domestic demand growth fell by 0.47 per cent in September-quarter down from 0.81 per cent in the June-quarter 2016.
This was the result of continued growth albeit modest in household consumption (0.44 per cent growth down from 0.0.46 per cent).
Private investment continued to fall (-0.8 per cent) after a decline of 2.6 per cent in the June-quarter 2016. Perhaps we are at the end of this large decline in private capital formation.
Exports fell from 2.1 per cent growth in the June-quarter to 0.28 per cent in the September-quarter despite the 4.5 per cent improvement in the Terms of Trade.
Growth in import spending outstripped the growth in exports meaning that the external trade contribution to growth was negative (see below).
Contributions to growth
What components of expenditure added to and subtracted from real GDP growth in the September-quarter 2016?
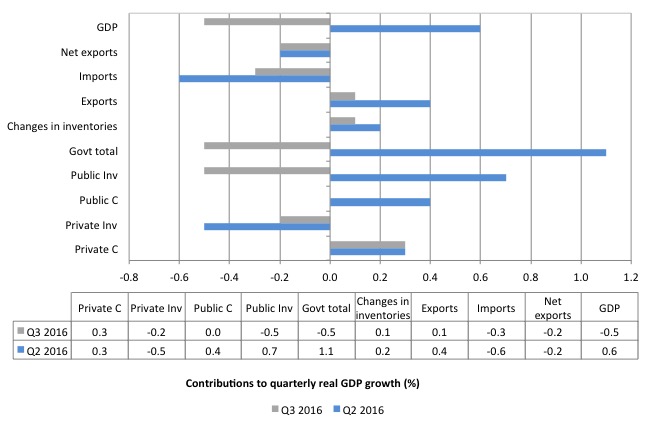
The following bar graph shows the contributions to real GDP growth (in percentage points) for the main expenditure categories. It compares the September-quarter 2016 contributions (gray bars) with the June-quarter 2016 (blue bars).
Net exports subtracted 0.2 percentage points from growth in the September-quarter (stable negative contribution) driven by a decrease in the contribution from exports being outstripped by a falling (negative) contribution from imports.
Private household consumption contributed a stable 0.3 percentage points to growth but this has fallen in the course of 2016.
The public consumption contribution fell to zero (down from 0.4 percentage points in the last quarter).
But it was public investment (capital formation) undermined growth by 0.5 points after contributing 0.7 points to growth last quarter.
The overall contribution of the government sector to growth was negative at 0.5 percentage points. The swing in government contribution reflects the lumpiness of large public infrastructure purchases (up last quarter, down September) and the failure of the Federal government to adjust its fiscal settings towards stimulus.
The overall contribution of private investment on growth continued to be negative (-0.2 percentage points), which confirms that the investment cycle associated with the mining boom is well and truly over and non-mining investment is not picking up the slack.
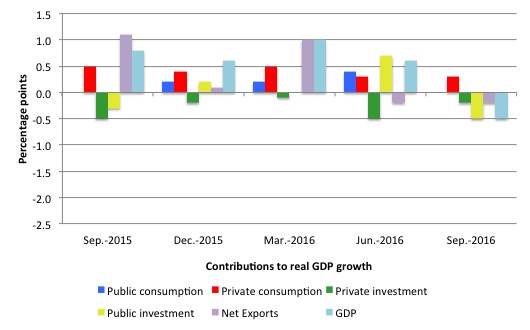
The next graph shows the contributions to real GDP growth of the major expenditure aggregates since the September-quarter 2015 (in percentage points). The total real GDP growth (in per cent) is also included as a reference.
Only household consumption has not turned negative in the last quarter.
Australians are better off now in income terms than they were in June 2015
The ABS tell us that:
A broader measure of change in national economic well-being is Real net national disposable income. This measure adjusts the volume measure of GDP for the Terms of trade effect, Real net incomes from overseas and Consumption of fixed capital.
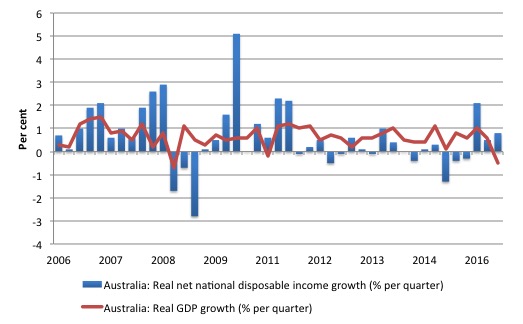
While real GDP growth (that is, total output produced in volume terms) fell by 0.5 per cent in the September-quarter, real net national disposable income growth grew by 0.8 per cent (down from 0.6 per cent in the June-quarter). This is largely the result of improving terms of trade over this period.
Real net national disposable income growth has been weak since 2011 and has been criss-crossing the zero line for the last three or so years.
Over the last year (to end of June 2016), real net national disposable income has increased by 3.2 per cent which means that Australians are better off in income terms than they were in June 2015.
The following graph shows the evolution of the quarterly growth rates for the two series since the September-quarter 2006.
Household saving ratio fell to 6.3 per cent
The squeeze on wages in Australia is manifesting in two ways. Rising indebtedness and falling saving out of disposable income.
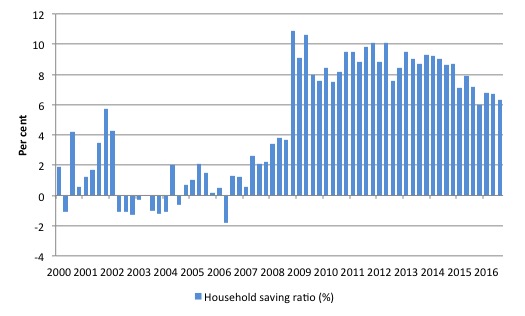
The following graph shows the household saving ratio (% of disposable income) from 2000 to the current period. The household saving ratio fell to 6.3 per cent in the September-quarter 2016 from 6.7 per cent in the June-quarter.
The ratio has been falling since the June-quarter 2014.
Further, even though Household consumption expenditure remains positive and helping maintain overall growth in the face of negative contributions from private investment, government and net exports, it is clearly growing modestly as a result of the subdued real wages outcomes.
The decline in the Household saving ratio from its 2011 levels was associated with a renewed rise in household indebtedness – back to record levels.
After the GFC hit, the household sector sought to reduce the precariousness in its balance sheet exposed by the GFC.
Prior to the crisis, households maintained very robust spending (including housing) by accumulating record levels of debt. As the crisis hit, it was only because the central bank reduced interest rates quickly, that there were not mass bankruptcies.
In June 2012, the ratio was 11.6 per cent. Since the December-quarter 2013, it has been steadily falling as the squeze on wages has intensified.
While the recent trend has been downwards, it is unlikely that households will return to the very low and negative saving ratios at the height of the credit binge given that the household sector is now carrying record levels of debt.
At some point, household consumption growth will fall unless growth is supported by public spending (given the poor outlook for private investment and net exports).
This also means that government surpluses which were strong>only were made possible by the household credit binge are untenable in this new (old) climate.
The Government needs to learn about these macroeconomic connections. It will learn the hard way as net exports weaken if it tries to impose austerity.
Real GDP growth and hours worked
Over the last several years, there has been the sharp dislocation between what is happening in the labour market and what the National Accounts data has been telling us.
Growth in employment and hours worked has been very modest over the period while annual real GDP growth has been around 3 per cent.
At those GDP growth rates, employment growth should be much stronger than it has been.
Today’s data shows that GDP per hour worked (productivity of labour) fell by 0.9 per cent in the September-quarter 2016 after rising by 1.3 per cent in the June-quarter 2016.
So even though real GDP fell by 0.5 per cent, the falling labour productivity was associated with a rise in hours worked (0.5 per cent).
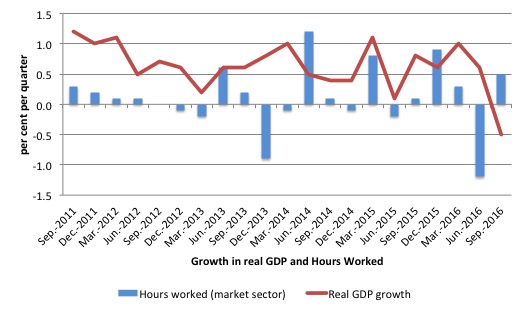
The following graph presents quarterly growth rates in trend GDP and hours worked using the National Accounts data for the last five years to the September-quarter 2016.
You can see the major dislocation between the two measures that appeared in the middle of 2011 persisted throughout 2013 and has reasserted itself in recent quarters.
The GDP growth has driven by capital-intensive exports and more recently, capital infrastructure growth, which is one reason why labour productivity growth had been strong and employment growth weak.
Just in case you think the labour force data is suspect, the hours worked computed from that data is very similar to that computed from the National Accounts.
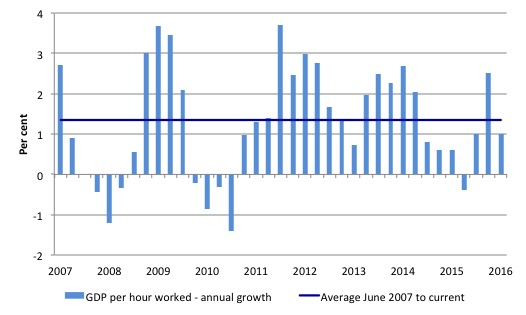
To see the above graph from a different perspective, the next graph shows the annual growth in GDP per hour worked (so a measure of labour productivity) from the September-quarter 2007 quarter to the September-quarter 2016. The horizontal blue line is the average annual growth since September-quarter 2007.
The relatively strong growth in labour productivity in 2012 and the mostly above average growth in 2013 and 2014 helps explain why employment growth has been lagging given the real GDP growth. Growth in labour productivity means that for each output level less labour is required.
In the September-quarter 2016, annual labour productivity growth was down to 1 per cent (below the recent average of 1.3 per cent).
Conclusion
Remember that the National Accounts data is three months old – a rear-vision view of what has passed and to use it to predict trends is difficult
Today’s National Accounts data indicates that the Australian economy was in negative growth territory in the September-quarter and is marching inexorably towards recession under current policy settings.
The annual growth rate of 1.8 per cent is a distortion given the exceptional March-quarter 2016 result. The June-quarter result and today’s data suggests that Australia is probably already near recession if not actually enduring that state.
The strong export performance earlier in the year has not repeated even though the terms of trade improved in the September-quarter.
The external sector undermined growth in the September-quarter 2016.
Growth in domestic demand was relatively weak as a result of the continued decline in private investment expenditure and the subdued household consumption performance.
The weak private investment outcomes are undermining future prosperity.
The negative growth in private investment means that potential output in Australia and future growth rates will be lower than otherwise. Again, not a positive sign.
With domestic wages growth flat and household indebtedness at record levels, I don’t suspect a huge contribution from household consumption in the coming quarters.
Private investment is forecast to contract further.
So if the government sector persists in implementing its planned spending cuts then a recession will take us into the New Year.
And if that turns out to be the case, then incompetence is the only assessment of this government that would be valid.
That is enough for today!
(c) Copyright 2016 William Mitchell. All Rights Reserved.
I can already hear the neo-liberal mongs arguing that wages are too high and we need to get rid of minimum wages, penalty rates, and unfair dismissal laws. On top of that we need to increase the eligibility for the aged pension to 75yrs, abolish unemployment benefits, privatise health care, water, Electricity, Gas, Law enforcement.. and so on.
Too much government regulation has stopped the free market from functioning correctly and that’s what has caused this dire situation with respect to the national accounts to occur.
No matter how bad it looks for them, no matter how ridiculous the lies they always manage to pass the blame onto the poor and vulnerable of society.
Hi Bill,
Does the household savings ratio include superannuation contributions? If so, there is even less of a buffer than your chart implies (since these contribution have been increasing). It’s hard to see Household Consumption bouncing back any time soon of that is the case?
We have been saved by the Parliament. Imagine how much worse unemployment and the recession would be if many of Abbott’s cuts were not blocked during the previous term and if Turnbull’s cuts and the plan for a surplus weren’t blocked or delayed in this term. What an appalling federal government we have when the more their actions are blocked the better the economy is able to perform.p
If we are teetering on recession, why not combine gov’t money creation (deficit expansion) and lower/nil domestic tax rates? I have read a blog of yours about taxes pay for nothing, then why not use these as a two pronged attack for the stimulus of the Australian economy. I realise the LNP want to reduce company tax rates, however many of those are offshore and are in asset classes that don’t reach our economy, so their contribution would be limited to me.
“But the fact that the -0.5% print for growth was well below consensus, the worst quarterly growth outcome since the GFC, and at the lower end of even the most pessimistic economist’s expectation was disquieting.
But the verdict from Australia’s financial economics fraternity appears to be that Q3’s weak print was a one off and the economy will bounce back in Q4 and into 2017.” Westpac’s chief economist Bill Evans said the result “significantly overstates the fragility of the Australian economy” He also said The SME index showed some solid gains in New South Wales (+11.2% to 110.4), Queensland (+14.4% to 100.2), and South Australia (+37.1% to 87.6). Business insiders Australia.
I assume this is just spin for the readers Bill?
@slorter
Yes they’ll spin 7 years of stagnation into a state best described as “solid gains” and don’t worry after all its “one off”. They’ve perfected use of the homeopathic prescription language.
You cant win elections if chief economists like Mr Evans go around reporting stuff like the inflation rate was going negative earlier this year (-0.2 per ~april) as a cause for alarm.
How lucky Australia is to have these large concentrated financial sectors propping up growth. That always ends well.
I’m looking forward to the Government announcing a newer, bigger, more efficient, Eco-friendly Future Fund -which is effectively and imaginary tin shed in Canberra full of money only this time with solar roof panels.
Spending is the only answer in the short term and the government need to stop the nonsense and just get on with it. Stop waiting for the private sector to come to the rescue because it can’t happen when government spending is lacking.
According to Dun and Bradstreet and their spokesman The Kouk (Stephen Koukoulas), their data is telling them that Australian small-medium enterprises are currently growing nicely and that they are employing and investing. And that they expect to do so increasingly into Q1 2017.
This stands starkly in contrast with the slowest wages growth on record, dismal employment growth and ongoing casualization and an ongoing disinflationary environment even with the lowest interest rates in half a century.
Some SME owners have told me that this quarter just gone is one of the best they’ve ever had. Of course, a few anecdotes mean little in the overall big picture.
It does seem a tad curious though.
A quick review of that D&B business performance-expectations chart shows that since 2009 at least, positive expectations have only ocassionally been matched by or exceed by equal or better actual outcomes.
Watson, in an economy run according to MMT principles total net national government spending is maintained at a level to ensure full employment (stimulus and Job Guarantee program) and that inflation remains below target. Net spending can be in the form of additional spending, tax cuts or both. As you suggest tax cuts for the major corporations are not as economically beneficial as tax cuts for those less well off, as weak consumption demand is a major economic shortcoming. Taxes in total at similar levels to now would probably apply in a MMT compliant economy. The same level of government spending as now without any taxation at all would be hugely inflationary and is therefore not practical.
Andreas, thanks for your reply, glad to hear taxation is part of MMT. Personally I would be happy to see the end of taxation as it creates a divide between those who can play the system and those who cant. Is the risk of inflation overplayed in todays society? I know Venezuela shows it can be a problem, however are these often related to geopolitical differences rather than availability of money.
“Personally I would be happy to see the end of taxation as it creates a divide between those who can play the system and those who cant”
Hi Watson.
I’m not sure how this would work since the value of our currency is driven by taxation. It’s little more than worthless tokens but for the fact that out sovereign government is able to demand a “tribute” back to them in the very same medium that exists only because they spend it into existence first. That gives it value since nothing can now happen without it. That explanation is pretty rough since I’m not a trained economist, only an interested layperson – but it’s more or less correct I think.
I can’t see rampant, consumer spending binge-driven inflation becoming a problem for us any time soon.
Watson you need to read more about MMT starting with warren Mosler’s free book: http://moslereconomics.com/wp-content/powerpoints/7DIF.pdf this is the go to read to start with for understanding MMT.
I recommend you also watch this short 3 min clip about modern money: http://youtu.be/bTZGU9s0idM
There’s a more detailed extended 30 min clip with narration here: https://youtu.be/bHQCjFebIf8
That should help you get a firmer grounding on how MMT works.
Thanks for your reply LWHBP, what u say makes sense. Would there be benefits to removing the Australian dollar, if we moved to local currencies rather than a single one controlled by a single govt (who does what the vested interests want it to), would there not be more democratic allocation of resources? I’m only thinking out aloud here, however a local currency controlled by its locally elected members may have more relevance than a single currency for all.
Not too sure Watson – I think that would necessitate the creation of hundreds of little “sovereign nations” which might get needlessly complex and problematic. In a place like Australia, each one would have to recognise all the others with rates of exchange etc. I think it would create a huge and enormously complicated edifice – many of the resources we all need may be able to be sourced nationally but not within our local area, I think you would find that much of what you need could only be sourced from another “country” (maybe only all of a hundred km away or even less!) who uses a different currency to the one you use – will everyone recognise each others local currencies and how much yours is worth versus theirs?
I think Australia is best off as a single country with a single currency issued by a single sovereign – though I do agree that governments can be (and are!) compromised by vested interests. Check out Malcom Turnbull, Scott Morrison and around 95% + of the rest of them with their great big investment property portfolios, merrily watching – and facilitiating though policy – endless price growth, long after your typical young working couple can no longer realistically afford a family home in the areas where about half of this countries population lives. Criminal!
Thanks for the links and discussion folks, we live in hope some common sense may appear on the economic horizon.
What about nominal GDP growth ? and does that mean anything anyway ? Morrison claimed nominal GDP growth was +0.05%
Dear Mark Kinnear (at 2016/12/08 at 8:50 pm)
It just means inflation is running at the very low rate of 1 per cent. Real GDP = Nominal GDP + Inflation.
So real GDP was -0.5, nominal GDP +0.5, inflation 1.0
An inflation rate that low means things are very weak.
best wishes
bill