I have received several E-mails over the last few weeks that suggest that the economics…
It is just ridiculous to starve public investment funding
On Monday (December 19, 2016), my blog – US central bank decision to raise interest rates doesn’t make much sense – examined the recent interest rate hike in the US and made a case that it didn’t appear, on the basis of the evidence at hand, to be a well-reasoned policy decision. In researching the case I was struck by how far public gross capital formation has fallen in the US, particularly at the State/Local level as mindless austerity takes its toll. Governments find it easier to cut capital spending than recurrent spending because the ‘costs’ of the those spending cuts are not immediately obvious to the population and, typically, do not manifest until after the political cycle exhausts. Cutting pensions, school outlays, and other recurrent targets usually brings an immediate political outcry because the impacts are immediate. But it takes time for public infrastructure to degrade from lack of maintenance and replacement. Eventually it does degrade and in some cases becomes unusable. Then the costs of repair/replacement are usually higher than if the resource had have been maintained and replaced according to reasonable engineering schedules. The US Bureau of Economic Analysis (BEA) publishes a very interesting data series that allows us to examine the ageing of the capital assets (public and private) on an annual basis back to 1925. I thought I would explore that dataset to inform the proposition that neo-liberalism has been associated with degraded public infrastructure and the loss of service (to the non-government sector) that accompanies such degradation. The results of my enquiry are fairly stark.
I wrote about that sort of policy mypopia last week in this blog – Austerity is the enemy of our grandchildren as public infrastructure degrades.
Average age of public infrastructure assets in the US
The BEA Table 7.7A Current-Cost Average Age at Year end of Government Fixed Assets, 1925-2015 provides annual estimates of the vintage of public infrastructure. The data is quite detailed.
Clearly, the older the asset the more likely it will fail or deliver degraded services. Everytime I visit the US (about annually at least) I notice that the inner cities are increasingly more rundown – drains, paths, roads, public transport facilities etc.
The data confirms what one sees informally.
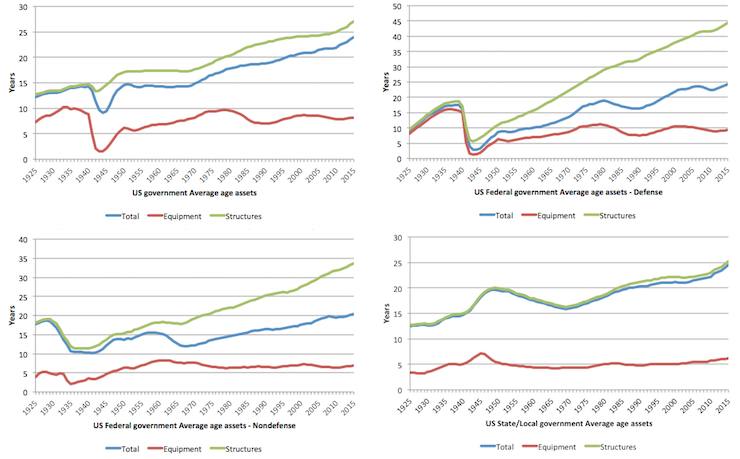
The following graph shows the estimates of average age from 1925 to the end of 2015 for the Government as a whole broken down by total, equipment and structures; the Federal government similarly broken down but also divided in defense and non-defense, and the State/Local government sector.
It appears that policy towards equipment has been fairly constant throughout the last 90 years (with an interruption during World War 2 (predictably).
Governments at all levels in the US turnover their equipment (on average) after 10 years or so.
What is striking, however, is the steady increase in the average age (in years) of the public structures (bridges, roads, transport infrastructure, hospitals, schools etc).
And more striking is that the average age while trending up since the 1940s accelerateg in more recent years, indicating a lack of new investment.
I am not an engineer but I would be more inclined to conclude that these trends are more associated with fiscal stringency than any notion that the structures are designed to last longer.
Movements in Gross public investment
The BEA Table 3.9.3. Real Government Consumption Expenditures and Gross Investment, Quantity Indexes combined with the NBER Recession Dating information allows us to examine the behaviour of US government gross capital expenditure (investment) over past cycles.
The assertion is that the current cycle is quite distinct from the previous cycles as the neo-liberal spin doctors went crazy in the recovery period and the austerity mindset enveloped government policy makers at the Federal and State/Local levels.
The widespread promotion of the myth that the US government would soon run out of money and the unwillingness of the US Federal government to use its currency-issuing capacity (once the elites in Wall Street were saved) to help State and Local governments struggling with revenue in the recession, saw gross investment spending cut severely in the so-called recovery period following the peak in the December-quarter 2007.
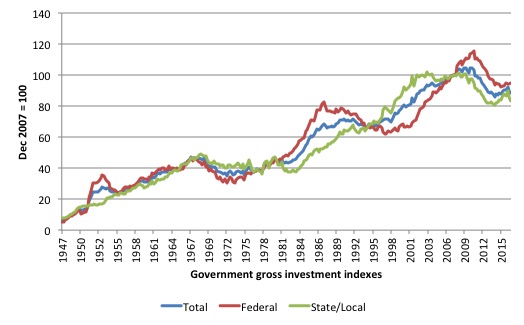
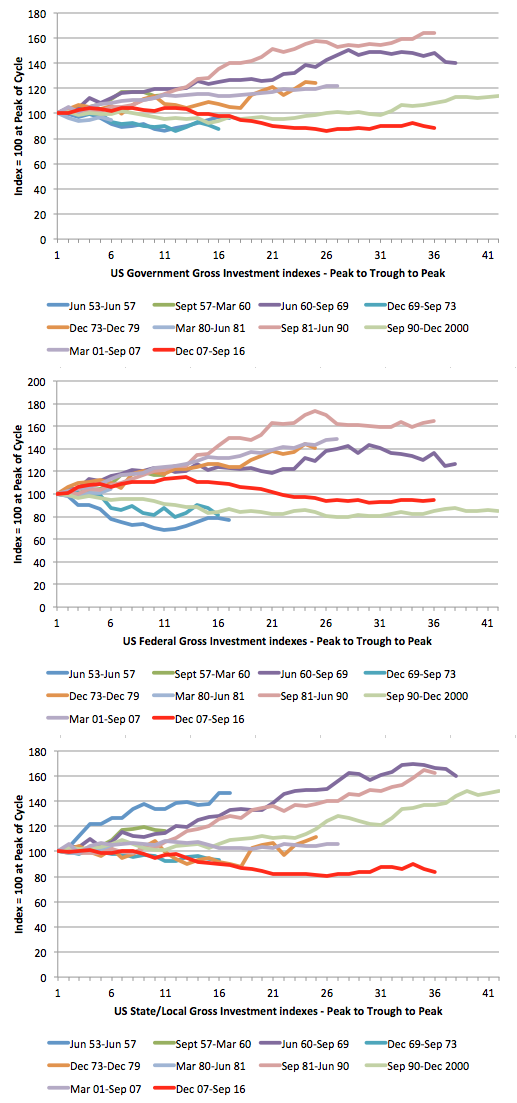
The following series of graphs tell their own story. They present gross investment indexes from the March-quarter 1947 to the September-quarter 2016 indexed to 100 at the pre-GFC peak (December-quarter 2007).
The first graph shows gross investment in the US for total government, Federal and State/Local. The patterns are quite interesting.
I will provide some more ‘political’ information below, but what stands out to me are the Clinton cuts in the late 1990s, which helped him achieve fiscal surpluses but contributed to the ageing public infrastructure, and, ended in recession anyway.
The other (diabolical) feature is the response during the GFC at all levels of government. The dramatic decline over the Obama period in gross investment and the starvation of investment at the State/Local level is beyond belief really given the state of the economy.
It is clear that these ‘political’ choices contributed to the accelerated ageing of the US public infrastructure.
This effect is when we can really say the choices made by the current generation undermine the prosperity of the next generations. By allowing public infrastructure to age as a result of cuts in public investment, the different levels of government are guaranteeing a reduction in the well-being (other things equal) of our children and their children.
That intergenerational impact has nothing to do with running deficits, other than the deficits are too small relative to non-government spending.
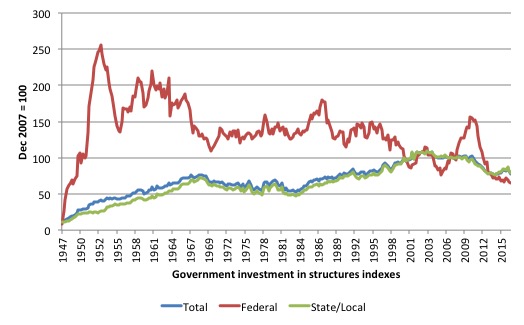
The next graph shows the breakdown of structures investment by level of government. We see that there has been a steady decline in gross investment in structures by the Federal government which accelerated under Clinton and was pro-cyclical under Obama.
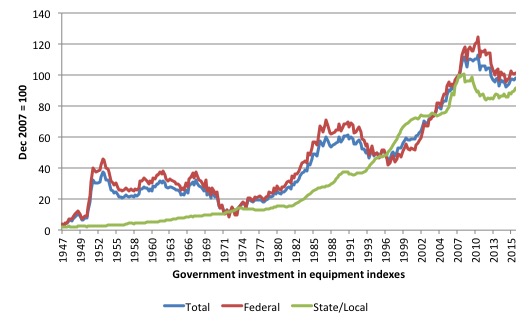
The final graph shows the breakdown of equipment investment. Clinton and Obama stand out again.
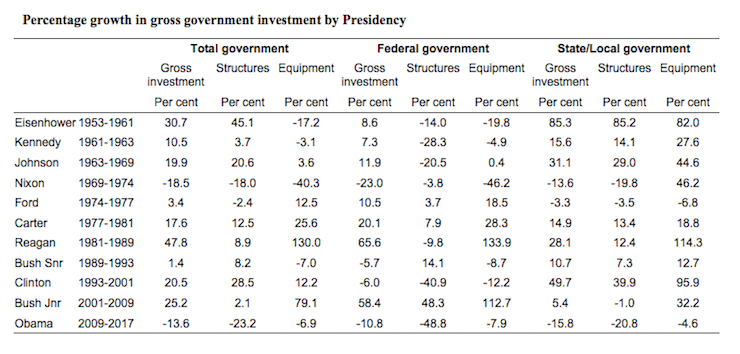
The following Table computes the percentage growth in gross government investment (broken down into total, structures and equipment) for Total government, Federal and State/Local corresponding to the different presidencies since 1953.
One might conclude that it was the Republican presidents who were the Keynesians and better looked after the health of the public infrastructure (at the federal level).
Bill Clinton came to office on January 20, 1993 and vacated 8 years later in 2001. Over his period in office, federal public investment in structures fell by 40.9 per cent. Only the Obama regime has been able to top that.
Clinton’s surpluses were driven by these huge cuts in federal investment and the massive buildup of private credit that kept growth in revenue positive.
Of course, this ended in grief with recession and, ultimately, the GFC (as the credit chickens came hometo roost).
Cyclical response of public investment
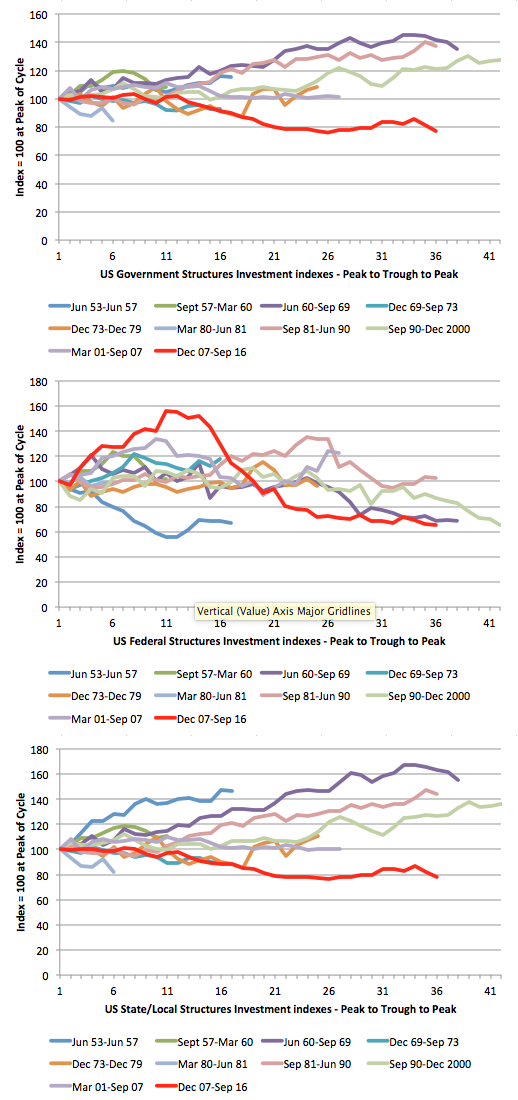
The final thing I was interested in looking at was the cyclical response of public investment over history. That is, how has it behaved from the peak to trough and recovery period of the successive cycles as dated by the NBER (link above).
I produced two graphs.
1. Gross public investment by level of government (Total, Federal, and State/Local) charted for each cycle from the Peak quarter, through the trough up until the quarter before the next peak.
2. The same analysis for structures (second graph).
While there are some variations over time, the Obama GFC and aftermath stands out as an indictment against neo-liberal fiscal hysteria.
The GFC has been the worst recession in this series of recessions (starting at December 1948 peak) yet the pro-cyclical nature of the Obama regime’s investment spending is evident.
The US Federal government could have supported the State and Local governments more to prevent what is a very pro-cyclical slump in gross investment at that level.
Pennies cut now will surely require many dollars later as the public infrastructure that has been starved of funds degrades and stops working.
The message from the graph below on structures is the same. US public infrastructure structures are getting older very quickly and yet at a time that unemployment was very high and wages growth flat, the US government (at all levels) decided to allow those structures to get even older on average because fiscal austerity was more important than responsible government.
Conclusion
So that ends my little trek down the assets and investment data for now.
As I have said on many occasions, even if one is besotted with minimising public spending, cutting investment in basic public infrastructure and allowing it to deteriorate to the point that it stops servicing the public is myopic.
It ends up costing more to replace and fix up that it does to continue regular maintainence/upgrade cycles.
And in the meanwhile, the service quality coming from the assets degrades.
It is just ridiculous really.
Updates – MMT Macroeconomic Textbook
We signed a contract last week with Macmillan Palgrave for the next version of our MMT macroeconomics textbook. We will deliver the final manuscript by the end of February (we are working hard on it at present) and it will be published in the second half of 2017 (in time for the North American academic start).
This version will cover the introductory year and the second year of a university-level macroeconomics
We published the first version of our MMT textbook – Modern Monetary Theory and Practice: an Introductory Text earlier this year. It is an introductory text only. It is intended as an introductory course in macroeconomics and the narrative is accessible to students of all backgrounds. All mathematical and advanced material appears in separate Appendices.
The next version will contain an additional 10 Chapters and include a lot more advanced material to supplement the material presented in the introductory text.
The current book covers a very detailed introductory macroeconomics course based on Modern Monetary Theory (MMT) and provides a very thorough grounding for anyone who desires a comprehensive introduction to the field of study.
The next expanded edition which Macmillan Palgrave will publish will introduce advanced topics and more detailed analysis of the topics already presented in the introductory book.
Updates – Our latest book on Reclaiming the State
Regular readers will have been aware that we (Italian journalist Thomas Fazi and myself) are close to completing our manuscript for my next book, which traces the way the Left fell prey to what we call the globalisation myth and formed the view that the state has become powerless (or severely constrained) in the face of the transnational movements of goods and services and capital flows.
Social democratic politicians frequently opine that national economic policy must be acceptable to the global financial markets and, as a result, champion right-wing policies that compromise the well-being of their citizens.
In Part 3 of the book, which we are now completing, we aim to present a ‘Progressive Manifesto’ to guide policy design and policy choices for progressive governments.
We also hope that the ‘Manifesto’ will empower community groups by demonstrating that the TINA mantra, where these alleged goals of the amorphous global financial markets are prioritised over real goals like full employment, renewable energy and revitalised manufacturing sectors is bereft and a range of policy options, now taboo in this neo-liberal world are available.
Anyway, we now have negotiated a publishing contract with Pluto Books and it is expected the book will be available for sale worldwide around July/August 2017 (hopefully).
We have to deliver the final manuscript by February 2017. I will provide updates when publication dates are available. We have been negotiating to keep the price down as low as possible.
Updates – Blog Ranking
I was informed last week that based on:
- Google reputation and Google search ranking
- Influence and popularity on Facebook, twitter and other social media sites
- Quality and consistency of posts
- Feedspot’s editorial team and expert review
My blog has been ranked 40th in the top 100 Economics Blogs.
You can see the rankings HERE.
New Economic Perspectives (UMKC) was ranked 36th, which means two MMT blogs are in the top 40.
I don’t promote much through social media and do not have a Facebook account (why anyone would when they sell your private information for profit is beyond me) so perhaps it is “consistency of posts” that has earned the ranking 🙂
Anyway, there is a lot of misinformation being spread by those blogs above us and hopefully our spread increases in the coming year.
Another company (FocusEconomics) which ranks blogs etc has told me recently that they will be featuring my blog as one of the Top Economics and Finance Blogs of 2016/2017.
Who knows what any of these rankings actually mean. But it is probably better to be highly ranked than not mentioned at all!
That is enough for today!
(c) Copyright 2016 William Mitchell. All Rights Reserved.
Professor Mitchell, don’t you realize that we in the U.S. are more productive than we used to be and have newer and better technology and are more wealthy now also? So of course we cannot afford to maintain things like we would like to. If only the government could get some money somehow…
If things looked bad under Bill Clinton, G W Bush and Obama, the downward slide of the U.S. into the sewer is about to accelerate under Trump. It looks like the promised massive investment in infrastructure is being planned from the outset to be a scam of epic proportions to enrich the private partners such as Goldman Sachs in the preferred Public Private Partnership development model.
Bill Black – Associate Professor of Economics at UMKC discusses this aspect:
https://www.youtube.com/watch?v=3gouEq-tr34&feature=youtu.be
And congrats on the blog ranking. Your blog is consistently extraordinary in the quality and quantity of analysis in my opinion. Plus you are also almost always right. Except for occasional lapses in the quiz questions.
Don’t worry Bill, I’m happy to keep taking the Facebook bullet for you and linking relevant blogs (I have the Labor party in my feed, I’m hoping someone will pay attention!).
Poor Obama, though – inherits the GFC and had to deal with a hostile Republican congress for most of his term. It would be interesting to see the data broken up in to Congress majorities instead of presidents.
I was troubled to see that you listed “renewable energy” as your second priority for public purpose. I hope I’m not being picky but that sounds worryingly like the misguided EU targets. What matters is protecting the climate and ensuring energy security. The EU targets for renewable energy have resulted in a move away from nuclear power to instead having wind and solar together with the inevitable gas back up for when it is dark and not windy. That has dire consequencies for CO2 emissions, energy security and energy costs. Wind can make sense for providing <25% of electricity but trying to get a high proportion of electricity supply from wind and solar has never been demonstrated to work despite considerable efforts. In the EU we have the crazy situation where targets and subsidies ignore the need to cut consumption via efficiency etc and instead target production of more wind and solar electricity as though that were an end in itself. IMO gas should be reserved for developing countries to provide cheap electricity and in the developed world we should go nuclear as the only proven way to transition away from fossil fuels in time (France and Sweden transitioned away from fossil fuels to nuclear in the 1970s and 1980s).
Coming from New York City, we were taught the Myth that: ‘The Federal Reserve always acted independently of the White House, Congress etc.’ and having lived through a 21% percent prime rate during Carter… I was a believer…. (and thereafter voted for Ronald Reagan) Being a cynical New Yorker, I have the impression that Ms. Yellen wanted to raise the rate since Sept. but declined to do so, in fear of how it may adversely impact the economy, the current administration & election cycle. And, in light of the marketing boom after the election of Pres Elect Trump, she executed her diabolical plan and the world did not end… OF course, the Speaker of House (Ryan) would like to advance the funds for infrastructure BUT wants it ‘revenue neutral’ which means – something ‘cut or subtracted’…. Funny thing, every time Pres Obama went to a “climate conference’ he doled out ‘billions’ ! ??? If I was on standing on line to accept his check – I’d believe in global warming! Congrats on your FB rating and appreciate the irony of you NOT having a FB account!? (we’re around the same age and I don’t have one either for the same reasons) Certainly, this fact and status supports Chris Hedges assertion that social media is a ‘virtual hallucination’ but your should do an FB page for your band… (caught your vid on Youtube) In Indonesia now keenly awaiting the next meltdown and studying for your quiz.. Many thanks for your informative blogs and emails. I know it’s quite time consuming. I will direct all my friends on FB to vote for you forthwith. Thanks Again, all the best for the New Year and much success with your new book launch.. After that, you’ll be ready for a TV reality show…. HERETIC : HIGH PRIEST OF FINANCE.. (kind of like my favorite show in Oz,,, ‘Rake’ but more irreverently religious as Economics goes – the new post industrial age religion.)
Congratulations on the blog ranking, and also congratulations to New Economic Perspectives. Let’s hope you both get even higher in time.
.
I must echo Stone in favour of nuclear power. For many years (decades even ) I was strongly against it, and pinned all my hopes on renewables. But while there is still a place for renewables, there is no chance they will displace the majority of fossil fuel power sources. The only way to do that is with nuclear, and the good news is that we don’t have to wait for fusion, because molten salt reactors look like a realistic way to go (with or without thorium). There is no reason at all why the USA and the UK at least aren’t going full-speed ahead on developing a range of prototypes, and figuring out what is best in practice. There is at least one UK design which (subject to regulatory approval) could go ahead tomorrow if the will and the funds were there. It uses almost no new, unknown, technology, and the physics is well established. Apparently, the UK’s Harwell and the USA’s ORNL were actively collaborating on MSR in the 60s and 70s. What seemed to kill it in the UK was the “success” of the fast breeder reactor at Dounreay. That apparently generated power for 20 years and then was shut down, and the site is slowly being decommissioned. No more FBRs were built in Britain. There were in passing a whole catalogue of problems which you can read about in Wikipedia.
.
The nuclear industry hasn’t exactly done itself many favours over the years, and no wonder people are sceptical. However, it really does seem that MSRs can be built with much more inherent safety than the early generations of reactors, and they are also much more fuel efficient, and offer a way to deal with existing waste. The only thing that might stop them other than regulatory problems is a lack of real resources, specifically skilled and knowledgeable people. We know that governments like the USA and the UK can “afford” to build them if they want to. They can afford to educate the necessary people too.
Mike Elwood, the problem with nuclear is only governments will underwrite them for insurance with no limits to liability. The private sector as far as I know won’t underwrite them for insurance as the risks are so huge and timeframes longer than modern human history for the waste storage. That’s the biggest problem. Fukushima is still a disaster in radioactive water being collected and leaking. There needs to be a discussion on how much that will cost long term. Chernobyl finally just got a concrete bunker recently and again how long and at what cost had that disaster added up to. I’m still not confident in humans ability particularly with neoliberal economics behind the scenes cutting costs short term at long term expense.
Congratulations on getting top ratings for this blog (again). You (and the group at UMKC) clearly put a great deal of thought into every entry and we’re very fortunate to have such high quality resources available. I always get thanks from people for referring them here for trustworthy information.
Mike Ellwood: People keep telling me about the wonderful new nuclear technology and that all my fears are unwarranted. Perhaps the new technology is worth taking a close look at, the idea of having a fireplace that never needs re kindling and doesn’t contribute to agw is appealing here in Canada, though I can’t help but wonder if starting down the soft energy path of renewable s wouldn’t deliver better long term results in terms of employment and wiser use of our remaining real resources.
I can see were a clean source of abundant energy while solving one problem might just perpetuate others.
We need an energy mix of renewables, nuclear, gas and storage. The tech already exists, the resources are there, we just lack the will and political leadership.
Jason H, I struggle to see how you conclude that nuclear power has a poor safety record. Your argument seems analogous to saying that we should travel by motorbike and not by train because 200 people were killed in the Quintinshill rail disater. Chernobyl was a disaster, Chernobyl was a screw up in a floundering communist country. The Banqiao Dam collapse is a comparable event in renewable energy history and killed 171000 people.
The Fukushima “nuclear disaster” did not kill anyone. It was a massive screw up but compare it to the “business as usual” 23000 deaths per year in the EU from coal power plant air pollution. burning wood in power stations gets touted as a way to provide reliable “renewable” electricity. That would create at least as much air pollution as coal. How many deaths from air pollution are worth one death from radiation in your view? Is it a million? A billion?
People talk about energy storage riding to the rescue for intermittent wind and solar. For heating, low grade heat can be stored effectively underground (see Drake Landing) BUT there is no feasible technology on the horizon for electricity storage on the scale that would be needed. The UK would require at least 8TWh of storage if we were to have a wind and solar and tide based electricity system. If all geographically feasible sites for pumped storage hydro were developed, then that would only provide the UK with 100GWh (ie only 1/80th that required).
Stone: What scale is “needed”? Could it be that if we took a close look we might actually get by with far less energy? An amount that could be met with renewable energy sources with simpler less hazardous technology.
All of the pro nuclear arguments I have been hearing, and there are many popping up all of the sudden, possibly due to electric vehicle market wishers trying to reinvent Fordism, assume away the possibility that if we put our minds to it we could do without fossil fuels and nuclear energy altogether. This is something I believe to be a real possibility based upon personal observations.
J Christensen, as I said, the UK has the geographic potential to have 100GWh of pumped hydro electricity storage. That would be 1/80th the amount of energy storage required for a wind/solar/tidal based electricity supply system to meet current UK electricity demand. If you are expecting UK electricity use to reduce by 98.75%, then yes, a colossal fleet of windturbines and solar PV and tidal generators and pumped hydro systems could provide reliable electricity at 1.25% of current use levels.
You say that renewable energy is “simpler”. Providing reliable electricity from wind/solar/tide is not only not simple, it is a pipe dream with current technology.
In my view we need to do what we can do with current technology. That is to make realistic cuts in energy usage (say 30% cuts). Have very tight restrictions on energy efficiency. So only small low powered fuel efficient cars can be sold. Only small AAA+ freezers can be sold. Have free public transport and big fossil fuel taxes. Building regulations to Passivehaus standard. Try and supply all heating and cooling of buildings and water from wind and solar via inter-seasonal heat/cold stores (see Drake Landing as an example). BUT that still leaves a LOT of energy demand. We need reliable electricity to power electric trains, machines, electronics etc etc. Nuclear has been shown to work at the scale we need. France and Sweden built their nuclear power fleets in the 1970s and 1980s at a pace per capita that would do the job for everywhere now.
Further to my previous comment, the key point about wind/solar/tidal power is that it is extremely easy to use it to provide lots of electricity as and when nature dictates but extremely hard indeed to use it to provide reliable electricity. If you want electricity <70% of the time, then it makes sense. Otherwise it doesn't and no foreseeable technological advance can change that.
Stone: I live in Ontario Canada. Some of the coldest most desolate northern locations here have seen the best results in terms of carbon offset through use of renewable s. In those areas, economic realities have been a big driver toward using these technologies, there is little hope of getting a nuclear plant and a grid anywhere near these locations anyway. In one location in the arctic, they have managed to reduce fossil fuel use about 23% in less than 2 decades using mostly wind and solar development. They have not just reduced the carbon footprint from their own use of energy, but also the carbon footprint of the heavily subsidised industry that produced and delivered fuels.
In Ontario, the average residential PV installation already offsets more than the equivalent of 2300 Kg of coal use per annum, and it’s possible to sell what you don’t use back through the grid. In fact the addition of so much new energy to the grid occasionally results in industrial consumers in Canada and some northern US states getting energy for free. Storage would be nice but it seems like most of the energy can be consumed somewhere on the grid.
But none of this is really my point. Do I think we will perish if we have far less energy available? No. I think necessity will still be the mother of new invention going into the future and if we return to a system that rewards people for finding real solutions to real market failures we will continue to develop better living standards despite vastly less energy consumption.
I’m not a fan of the idea of trying to maintain the same living modalities we developed into around fossil fuels or nuclear. I’m eager to see us return to thinking and working at real jobs in a real economy again. I haven’t tried it yet but I know other people who live on off grid power and I think I could manage on the equivalent of 2300 Kg of coal per annum; that seems reasonable to me.
Ontario, went for nuclear technology in a big way in the 1960’s and 70’s and we had only a few notable incidents in that time; however what really brought the nuclear industry down was the cost involved in maintaining and eventually upgrading the plants as they grew older. These costs were not factored into the energy pricing correctly it seems.
Electricity was so cheap many abandoned oil and coal for electric heating. A mistake many homeowners have paid dearly for; although a few smart people noted that in winter and fall the wind seems to blow more and so put up a wind turbine to heat the home with the electric heating systems.
Those plants once sustained a large manufacturing sector but once the publicly subsidised cheap energy left so did the industry and the jobs and Ontario went from a very prosperous province to a struggling province. I’d like to see us moving forward and not falling into the trap of repeating old mistakes.
We need to develop around the little surpluses nature can bring us with investments of our own efforts. Breathing new life into hard energy consumption just guarantees we will continue to destroy nature in ways beyond AGW.
J Christensen, I think a big confusion comes from extrapolating from 25% wind and solar to trying to rely on them totally. I agree wind and solar will produce electricity efficiently as and when nature dictates and can be used to reduce fossil fuel use some of the time. If we say that we will ruin the climate in 50years if we use x amount of fossil fuels, then displacing 25% of the fossil fuels with wind and solar will give us 72years and then we will have our ruined climate. What we need though is to transition to a system where we STOP using fossil fuels SOON.
Unless you can see a way to do entirely without electricity for days at a time, then wind and solar won’t work.
The problem you mention about “correct” pricing of nuclear power comes from what discount rate to use for the cost of capital. Because nuclear power plants have a very long life and almost all of the cost comes at the start, the overall cost of the power is predominately determined by the financing discount rate. In the 1970s, nuclear power was a government enterprise and so was funded at the rate of government borrowing -so a discount rate similar to the inflation rate. Today, in Europe anyway, there is this notion that it needs to be funded privately at a discount rate that takes into account the political risk that some Angela Merkel type politician will close the plant when it still has 50years of life left in it. That means a collossal financing cost. That isn’t a real constraint. It is just political nonsense. France and Sweden have thrived with their nuclear power systems. They didn’t create a cost drag. They saved tens of thousands of lives that otherwise would have been lost to air polution.
I’m desperate to try get across the nature of the obstacle ahead of trying to totally replace fossil fuels with wind/solar/tide based electricity supply (rather than with nuclear which has been shown to work ever since the 1970s).
Consider solar power in the UK. Solar PV in the UK has an 11% capacity factor. That means that over the course of a year, the panels produce an average power output 11% of the maximum output they produce when it is at its most sunny. So if you want to have 11% of UK electricity supply from solar, then some of the time ALL of UK electricity demand will be met by solar and ALL other supply will need to be unused. Likewise with wind power that has a 25% capacity factor. At some times there will be strong winds, bright sun and a spring tide. That means that as you try to displace a significant proportion of annual fossil fuel production, you end up having situations where more and more solar/wind/tide power has to be left unused because it is at the wrong time. To try and get the final 15% replaced requires so much over-capacity that you run up against the constraint that it takes more energy to build the systems than you get out of them.
Obviously hydro and volcanic geothermal energy are different but very few parts of the world have the geography. Unless you live in Norway or Iceland or Costa Rica or somewhere like that, you don’t have that option.
Public infrastructure becomes obsolete and in need of replacement for three main reasons:
– The facility has deteriorated and become either at risk of collapsing or very expensive to maintain,
– The facility no longer meets current design standards and is unnecessarily hazardous to its users,
– It has inadequate capacity to meet present and projected demand.
Just before and after World War II there was a rapid increase in car ownership in the USA and at the same time there was a shift from rail to road freight haulage. This rapid increase in demand gave rise to the Interstate system and many other roads and bridges. Some of these facilities are now obsolete for one of the reasons stated above but many are not. Although their original life span was assumed to be about 30 years, these facilities are useable after 50 or 60 years. Just because the level of investment has fallen, one cannot assume that the level of service has fallen, too.
Mr Stone,
In regard to your statement Dec 23rd post: ‘The Fukushima “nuclear disaster” did not kill anyone’
Sir, I beg to differ with you – there were several deaths due to radiation contamination and I believe the Mayor of Fukushima died after a year from exposure.. The Fukushima is far worse than currently reported. (if you are really interested, I can provide you with the citations.. I am not making this up…)
There should indeed be great cause for concern related to ‘safety issues’ with nuclear considering the increase in volcanic activity and earthquakes – which are on the rise and plenty of data available that supports this.
What is often overlooked as it relates to energy alternatives is: Natural Gas – which is abundant, clean and efficient. Although overlooked in the USA, the Inpex project as well as the latest massive gas pipeline project connected with Australia & Japan (which should be online within a year I think…they just finished the final fabrication in Thailand.. but these projects tend to always be late)
Going forward, we should remain optimistic – such as the roll-out of energy produced vis a vis ‘electromagnetics’ – there are working units however, not released to the general public – for many reasons. Expect roll-outs and commercial units available within the next 15 years.. Considering the debt ‘overhang’ – in the trillions in the oil and gas industry – it will take time to sort this out and it has to be otherwise, if it implodes, it will be like the subprime crisis and defaults. (the MNC’s involved are consolidating, liquidating assets etc. – so they are on it. ) There is also a good interview with the former CEO of Shell, who admits we’ve reached peak oil ‘consumption’ and its demand is expected to decrease over the next decade. He knows what he’s talking about and senior directors in the O&G industry concur and are acutely aware of this, unless of course there is a major World War. (sorry Hilary)
You may wonder, ‘If EM energy production is available, why aren’t we seeing it? Same reason why in the 1970’s the US govt had computer with clock speeds over 600 and the current models (govt) are 20-30X faster than the CPU you are using to read this.. (BTW John Searle in UK has a working prototype) but there are many reasons why the planning connected thereto is done long term as to not create chaos in the existing global models.. (see below the VLOOP – if a tube train could travel 1200-1500 MPH – what would that do to the airline industry? – you get the point- your economists)
Meanwhile, in UAE – Elon Musk is working on a protoype VLOOP – transport that incorporates MagLev with a Vacuum tube – which can attain a speed of approx 1200mph (actually it can faster but the challenge is ‘slowing it down – it’s operate in a Vacuum & you should have studied Physics 101) http://www.arabianbusiness.com/after-all-hype-what-s-future-for-hyperloop-one–653311.html (although the article is a bit critical – new technology takes time especially cutting edge.. but achievable,,,because it already exists..)
I appreciate the comments in this blog and am encouraged by the critical thinking, and debate in exploring alternatives to meet the demands and challenges for future generations – you’re the future leaders and you have your work cut out for you.. Unless you’re planning to take that ‘one-way’ trip to Mars..
Respectfully,
stephen
I think an intransient congress contributed to the lack of Infrastructure spending for both Obama and Clinton, they don’t mind spending as long as its by ‘their’ teams president.
congrats,great news on the high ratings.
stephen,
“Also, in a May 11 e-mail to CNSNews.com, Jaya Mohan, information officer for the United Nations Scientific Committee on the Effects of Atomic Radiation (UNSCEAR), said “no deaths directly caused by radiation exposure after the accident at the Fukushima-Daiichi nuclear power plant have been reported.””
That’s 11 May 2016.
Whatever you have been reading is likely scare stories.
This is from a nuclear power plant built in the wrong place and that had its life expectancy extended far too far.
It’s like saying we should stop using modern cars because a Jaguar E type has dodgy brakes.
Modern nuclear plants are better than ones built in the 1970s. Just like everything else.
Natural Gas generates greenhouse emissions – both of methane from leaks and CO2.
Disregarding the continuing severity of Fukushima in particular the radioactive water problem is a grave mistake: http://mobile.nytimes.com/2016/03/11/world/asia/japan-fukushima-nuclear-disaster.html
By all means say you want nuclear power but please read up on it first. We are talking time scales way beyond modern humans for the waste.
If you have seen the horrific deformation of babies from Chernobyl which that will be occurring for many generations over hundreds if not thousands of years. Japan will have the same problem in these areas. I don’t think it’s worth the risk.