During the recent inflationary episode, the RBA relentlessly pursued the argument that they had to…
All net jobs in US since 2005 have been non-standard
The Australian labour market has been characterised over the last 12 to 24 months by the dominance of part-time employment creation with full-time employment contracting. Over the last 12 months, Australia has produced only 84.9 thousand (net) jobs with 107.2 thousand of them being part-time jobs. In other words, full-time employment has fallen by 22.2 thousand jobs over the same period. This status as the nation of part-time employment growth carries many attendant negative consequences – poor income growth, precarious work, lack of skill development to name just a few disadvantages. Further, underemployment has escalated since the early 1990s and now standard at 8.3 per cent of the labour force. On average, the underemployed part-time workers desire around 14.5 extra hours of work per week. If we look at the US labour force survey data quite a different picture emerges, which is interesting in itself. Does this suggest that the US labour market has been delivering superior outcomes. In one sense, the answer is yes. But recent research based on non-labour force survey data (private sampling) suggests otherwise. That research finds that “all of the net employment growth in the U.S. economy from 2005 to 2015 appears to have occurred in alternative work arrangements.” That is, standard jobs have disappeared and are being replaced by more precarious, contract and other types of alternative working arrangements. The trend in the US has not been driven by supply-side factors (such as worker preference) but reflects a deficiency in overall spending. Not a good message at all.
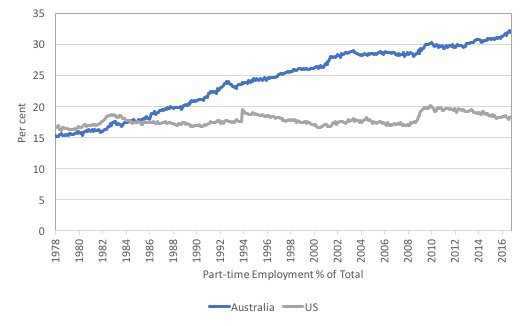
The first graph sets the puzzle up. It shows part-time employment as a percent of total employment in the US and Australia from February 1978 to November 2016 (it is seasonally-adjusted, monthly labour force data).
The sample is determined by the Australian labour force data (the current coherent survey data started in February 1978). Even before 1978, the US ratio was slowly rising from 13.5 per cent in January 1968 and by January 1970 it had reached 14.9 per cent.
From that point, it rose to 16.6 per cent by February 1978 compared to Australia’s ratio of 15.3 per cent. By November 2016, the respective ratios were 18.3 per cent (US) and 31.8 per cent (Australia).
Quite a divergence.
A related fact is that the proportion of part-time workers in the US are in that state for economic reasons (not enough hours being offered by the employers), which is a US proxy for underemployment, has remained very stable since January 1968 allowing for cyclical swings (it rises in a downturn as one would expect).
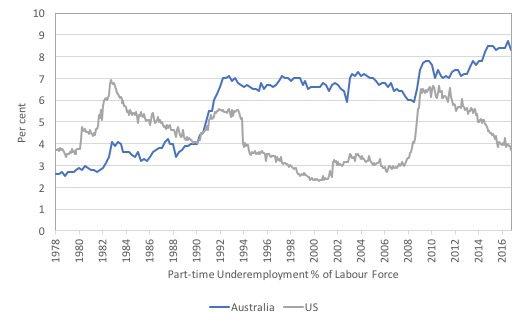
The following graph plots the history of underemployment in the US and Australia since February 1978 to November 2016.
It is clear that the US underemployment rate has a tendency to return to around 3.0 to 3.5 per cent after rising during recession (1982, 1992, 2002 and the GFC). In November 2016, that category as a per cent of the total labour force was 3.7 per cent.
However, Australia’s labour market has behaved quite differently in this respect. Underemployment was around 2.8 to 3 per cent prior to the 1991 recesion, which was our worst downturn since the Great Depression.
It rose rapidly during that recession as firms converted full-time employment into part-time jobs among other adjustments. It has never come back to the pre-1991 levels.
The step-level rise was more or less maintained until the GFC slowdown (Australia did not have an official recession during the GFC) and has risen again as a result of the deficient aggregate spending, while the US recovery has been marked by a falling unemployment and underemployment rate.
So, it is clear that the Australian labour market has increasingly generated part-time jobs at the expense of full-time employment (as proportions) and underemployment has become an entrenched problem.
It is also clear that these trends have not occured in the US even though the cyclical patterns (rising part-time ratios and underemployment) are similar.
Does this mean that the quality of employment in the US has overall been higher (equating quality with full-time jobs)?
The answer is that other things have been going on in the US that the Labour Force survey data does not disclose, which suggest that the quality of employment has declined dramatically.
I read a paper earlier in the year – The Rise and Nature of Alternative Work Arrangements in the United States, 1995-2015 – which was published on March 29, 2016 by Lawrence Katz of Harvard University and Alan Krueger of Princeton University.
It is a paper that has received very little attention but is explosive in its research findings.
The researchers used data derived from “a version of the Contingent Worker Survey as part of the RAND American Life Panel (ALP) in late 2015”. They aligned the survey sample with the “Current Population Survey (CPS) according to age, gender, race/ethnicity, education and household income group” (using appropriate weights).
The American Life Panel (ALP) is “a nationally representative, probability-based panel of over 6000 members ages 18 and older who are regularly interviewed over the internet for research purposes”. The data is free to use, which is a bonus.
The aim of this particular study was to “monitor trends in alternative work arrangements” (non-standard and contingent forms of work), which the authors suggest:
… is crucial to understanding the forces affecting the U.S. economy and the quality of life of American workers.
These non-standard workers include “temporary help agency workers, on-call workers, contract company workers, and independent contractors or freelancers”.
The BLS hasn’t done this sort of surveying since 2005 and thus to see what the impact of the GFC and its aftermath has been, the researchers used the ALP framework to survey
The research fills the gap in information which has prevented researchers (reliant on BLS data in the past) from finding:
… evidence of a strong, unambiguous shift toward nonstandard or contingent forms of work-especially in contrast to the dramatic increase in wage inequality.
The utility of the research, in part, is to help us understand why wage (and income) inequality has risen so much in the US in recent years.
The BLS data I looked at earlier (above) suggests that part-time work and underemployment has not escalated in the US. In Australia, these rising trends have contributed to lower quality work and rising wage inequality.
The study in question compared the results of the 2015 Rand survey (tailored for this purpose) to the last BLS survey of this type in 2005.
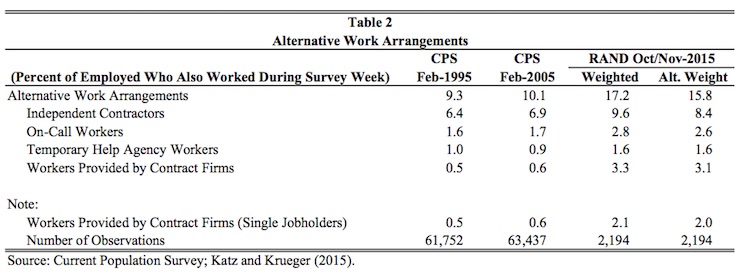
The research on alternative work arrangements in October/November 2015 (compared to the BLS CPS 1995 and 2005 survey results) was presented in Table 2, which I reproduce here.
The categories on non-standard work are:
(a) “Independent Contractors … who report they obtain customers on their own to provide a product or service as an independent contractor, independent consultant, or freelance worker.”
(b) “On-Call Workers report having certain days or hours in which they are not at work but are on standby until called to work.”
(c) “Temporary Help Agency Workers are paid by a temporary help agency.”
(d) “Workers Provided by Contract Firms are individuals who worked for a company that contracted out their services during the reference week.”
The findings are alarming:
1. “the percentage of workers engaged in alternative work arrangements – defined as temporary help agency workers, on-call workers, contract company workers, and independent contractors or freelancers – rose from 10.1 percent in February 2005 to 15.8 percent in late 2015.”
The authors write that:
A striking implication of these estimates is that all of the net employment growth in the U.S. economy from 2005 to 2015 appears to have occurred in alternative work arrangements.
This result is derived from the fact that the BLS CPS estimates that US employment rose by “9.1 million (6.5 percent) over the decade”.
The research finds that:
The increase in the share of workers in alternative work arrangements from 10.1 percent in 2005 to 15.8 percent in 2015 implies that the number of workers employed in alternative arrangement increased by 9.4 million (66.5 percent), from 14.2 million in February 2005 to 23.6 million in November 2015.
Thus, these figures imply that employment in traditional jobs (standard employment arrangements) slightly declined by 0.4 million (0.3 percent) from 126.2 million in February 2005 to 125.8 million in November 2015. Unfortunately, we cannot determine the extent to which the replacement of traditional jobs with alternative work arrangements occurred before, during or after the Great Recession. But it appears that as of late 2015, the labor market had not yet fully recovered from the huge loss of traditional jobs from the Great Recession.
2. The comparable data from the BLS between 1995 and 2005 “showed hardly any change in the percent of workers engaged in alternative work arrangements”.
3. “The percentage of workers hired out through contract companies showed the sharpest rise increasing from 0.6 percent in 2005 to 3.1 percent in 2015.”
4. “about 0.5 percent of workers indicate that they are working through an online intermediary, such as Uber or Task Rabbit … the online gig workforce is relatively small compared to other forms of alternative work arrangements, although it is growing very rapidly”.
5. “About twice as many workers selling goods or services directly to customers reported finding customers through offline intermediaries than through online intermediaries.”
6. There has been “a notable rise in the share of workers in alternative work arrangements who are women.”
7. “the share of alternative workers who are college graduates, multiple jobholders, or Hispanics display notable increases.”
8. “Construction and professional and business services were the two most prevalent industry groups among those in alternative work in 1995 and 2005, but the educational and health services industry has surpassed them over the last decade.”
9. “The largest number of workers in alternative arrangements is found in sales occupations”.
10. “Workers in all educational categories experienced a rise in the likelihood of working in an alternative work arrangement.”
11. “the incidence of alternative work is greater among workers who are predicted to have higher wages.”
The overall conclusion of the research is that the dramatic rise in alternative work arrangements is not the result of “supply-side factors” (preference of workers, ageing of labour force, etc).
The trend is being driven by deficient spending overall in the economy and the resulting rationing and restructuring of traditional work.
As noted above, they conclude that their research suggests that “as of late 2015, the labor market had not yet fully recovered from the huge loss of traditional jobs from the Great Recession.”
How does this square with recent glowing statements by the outgoing President?
On December 16, 2016, the US President held a – Press Conference by the President – where he waxed lyrical about the state of the US labour market under his Presidency.
He said (among other achievements) that:
As I was preparing to take office, the unemployment rate was on its way to 10 percent. Today, it’s at 4.6 percent — the lowest in nearly a decade. We’ve seen the longest streak of job growth on record, and wages have grown faster over the past few years than at any time in the past 40 …
Since I signed Obamacare into law, our businesses have added more than 15 million new jobs.
Think about that statement in relation to the Katz-Kreuger research findings.
The reality is that the US employment-population rate has fallen by 3.2 percentage points since the pre-GFC peak (December 2007). In November 2016, the ratio was 59.7.
While total employment is now 5.4 million higher than the December 2007 level (3.7 per cent), if one converts the decline in the employment-population ratio into workers who are no longer working, we find the number to be 8,150 thousand jobs.
Since President Obama took office (January 20, 2009), the employment-population ratio has fallen by 0.9 percentage points. Converting this into a number of jobs gives 2,292 thousand (2.3 million).
So the result of the fall in the employment-population ratio since President Obama took office has seen 2.3 million workers in employment.
Some will have retired (reflecting an ageing population effect) but in the past I have estimated that to be around 40 per cent of the decline in the participation rate.
The remainder is employment that has disappeared.
And most of the jobs generated in the last decade are non-standard with full-time opportunities vanishing.
Conclusion
That type of research is important because it fill gaps that the national statistical agencies leave, mostly because austerity-obsessed governments cut their operating budgets, which compromises the scale of their survey activity.
We learn that while the CPS data (in the first two graphs) makes it look as those things are looking superior in the US when compared to Australia’s decline into a part-time employment nation, the reality is somewhat different.
Traditional employment in the US is being rapidly replaced with precarious (non-standard) jobs and workers can no longer look forward to a stable employment history in full-time work unless governments change their attitude to policy.
That is enough for today!
(c) Copyright 2016 William Mitchell. All Rights Reserved.
wow.these insecure jobs are the first to go when a recession comes round again too.
It is not just the shortfall of income (a shortfall that includes tax revenues) that poses a problem for workers. There is also the associated loss of employee benefits that standard employment can bring such as structured contractual holidays, pension provision, sick pay, overtime and unsocial hours premiums all of which serve to support the relative decline (and absolute in many cases) of disposable income for an increasing number of of the workforce across and increasing number of professions like teaching.
There is a sequence working from employment, to jobs, to work and most recently transactions (e.g. Uber drivers). This all points to one thing – capitalism is not working for a growing proportion of the population.
Where does the 2.3 come from? A little confusing on real job creation. If employment ratio constant then 8.1 MM new jobs but only 5.4 created. But 40% of 8.1 is justified due to retirement. So please do the maths so we can see where the 2.3 comes from. Thanks