For years, those who want selective access to government spending benefits (like the military-industrial complex…
Policy changes needed to arrest decline in fortunes for low-pay British workers
Its hard to keep track of the variety of ways that this neo-liberal era has screwed workers. The latest report from the UK Institute of Fiscal Studies (January 13, 2017) – Two decades of income inequality in Britain: the role of wages, household earnings and redistribution. I read that report after I had studied the latest income distribution figures from the British Office of National Statistics (January 10, 2017) – Household disposable income and inequality in the UK: financial year ending 2016. The latter suggests that income inequality has decreased in Britain since . The former revealed that in the last two decades there has been a “four-fold increase” in the prime-age males (25-55 years) working part-time on low wages. But closer scrutiny of the figures reveals that they are not inconsistent because the falling inequality is not the result of low-wage workers improving their position. Anyway, this is another legacy of New Labour – screw the workers you claim to represent. It is just another part of the scam of Blairism exposed.
The ONS data released last week suggests that:
median UK household disposable income was £26,300 in the financial year ending 2016 … After taking account of inflation and changes in household structures over time, the median disposable income has increased by £600 higher than the previous year and £1,000 higher than the pre-downturn value of £25,400 in 2007/08 …
Should we concentrate on median or mean household income?
Most researchers use median household incomes to track household income because it “provides a better measure of how people’s well-being has changed over time”.
The median is the middle point of a sample, in which half the sample are above the median and half are below. The mean is sensitive to extreme values and skew in a sample and sometimes that reduces its capacity as a central tendency.
Income distribution is considered to be a ‘skewed distribution’ where a small number of persons receive very high incomes and a much larger number earn much smaller (disproportionate) amounts.
In this case, average income is misleading and is pulled up by extraordinary incomes received by just a few people at the top of the distribution
The median is better in these cases because “it represents the middle of the income distribution” and as the ONS write “the median household income provides a good indication of the standard of living of the “typical” household in terms of income.”
The ONS also tell us that, in terms of median equivalised household disposable income:
The year-on-year growth rate is broadly in line with the average growth rate per year for the past 40 years with median household income growing from £12,300 at an average rate of 2.1% per year between 1977 and 2015/16
In terms of the changes in the distribution of income over time, we learn that:
1. “Over the past year, median disposable income for the poorest fifth of households rose by £700 (5.1%). In contrast the income of the richest fifth of households fell by £1,000 (1.9%) over the same period”.
2. The effect of the GFC “varied considerably across the distribution”.
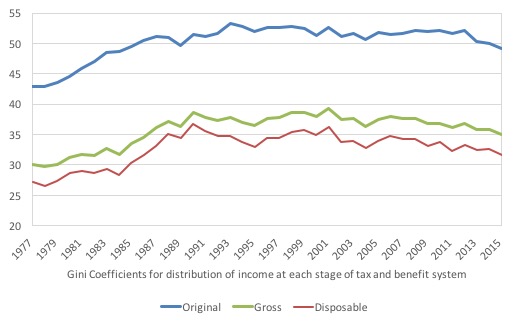
The ONS provide Gini coefficients from 1977 to 2016. The Gini coefficient is a summary measure of income inequality and can vary in percentage terms between 0 (perfect equality) and 100 (one person has all the income).
So a smaller Gini indicates a lower degree of income inequality.
Please read my blog – Inequality continues to rise in Australia – for more discussion on this point.
The following graph shows the time series from 1977 to the 2015-16 financial year. The data reverted from calendar year to financial year in 1994-95 (so the last observation, for example, is for the 2015-16 financial year).
Since the GFC, income inequality in the UK has fallen somewhat even in terms of the unredistributed (original) household income measure (blue line).
In terms of the redistributive impacts of fiscal policy (taxes and cash transfers), the ONS write that:
… overall, income inequality, as measured by the Gini coefficient, increased considerably during the 1980s, but since then the changes have been smaller in scale …
There has been some variation in the extent to which cash benefits and direct taxes together work to decrease income inequality. In 1977, they had the effect of decreasing inequality by 36.6% … This impact increased during the early 1980s and by 1984 cash benefits and direct taxes together decreased the Gini coefficient by 41.6%. This increase in their impact meant that the rise in inequality of disposable income was not as large as that for original income over this period. However, during the late 1980s, their redistributive impact weakened, and by 1990, they reduced the Gini by only 28.4%, accelerating the growth in inequality of disposable income. Most recently, there has been a slight increase in the effect of cash benefits and direct taxes in reducing income inequality, with their impact on reducing the Gini rising from 32.6% in the financial year ending 2007 … to 35.8% in 2015/16.
To help us understand what is driving the reduction in income inequality in the UK, particularly since the GFC, we need to look at the fortunes of different income cohorts.
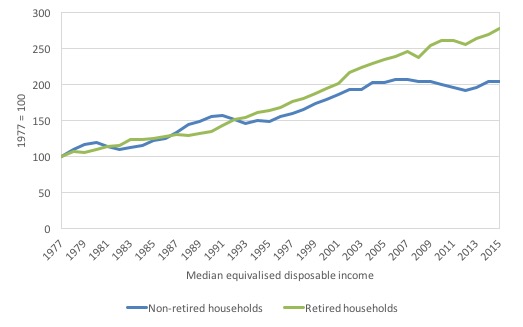
The following graph shows the time series of median equivalised disposable income in real terms (2015/16 prices)for retired households and non-retired households from 1977 to the 2015-16 financial year. The last observation is for the 2015-16 financial year as in the Gini graph.
It tells one part of the story. Both cohorts enjoyed similar growth in real median disposable income up until 1992, whereupon the growth in median income for workers started to lag behind the growth of real income for retirees.
That divergence became pronounced in the period leading up to the GFC and in its aftermath. From 2006-07, real median disposable income for workers has fallen by around 2.2 per cent, while it has grown by a substantial 16.5 per cent for retirees.
This helps to explain much of the reduction in overall income inequality in the UK as I will explain below.
The ONS say that:
since 2007/08, the median income for retired households … is now £2,500 higher than in 2007/08. By contrast, the median income for non-retired households … [is] … £300 lower in 2015/16 than in 2007/08.
Why has this divergence occurred?
1. “a rise in both the amounts received and the number of households reporting receipts from private pensions or annuities.”
2. “an increase in average income from the State Pension, due in part to the effect of the ‘triple lock'”.
The BBC report (November 6, 2016) – State pension triple-lock should be scrapped, say MPs – explains that:
The “triple-lock” on state pensions … has protected the incomes of the older generation since 2010 … The triple-lock guarantees that pensions rise by the same as average earnings, the consumer price index, or 2.5%, whichever is the highest …
3. “The fall in average disposable income for non-retired households after the economic downturn reflected largely a fall in income from employment (including self-employment).”
In other words, the cash transfer system has protected retired households even though overall earnings for workers have been lagging badly over the last decade, while the impact of the GFC on employment and the quality of work has damaged the capacity of workers to enjoy income growth.
Other interesting movements in inequality within cohorts are observed.
1. As a result of the redistribution policies, “inequality is much lower for retired households than for non-retired households”.
2. “this reduction, due principally to the state retirement pension”.
We can now better understand the trends I noted above in terms of the fall in the real median disposable income for the top quintile (top 20 per cent) and the slight rise for the bottom quintile (the lowest 20 per cent of income recipients).
ONS say that:
Over the past year, median disposable income for the poorest fifth of households rose by £700 (5.1%). In contrast the income of the richest fifth of households fell by £1,000 (1.9%) over the same period.
The highest 20 per cent of income earners have largely been impacted by “a fall in average income from employment (including self-employment) for this group following the economic downturn”.
But, the lowest quintile has been aided by an “increase in average income from employment”.
Two things are important here. First, the top 1 per cent have seen their real incomes rise even though the top 20 per cent experienced falling incomes in the year to April 2016.
Second, the bottom quintile benefited from higher state pensions and other payouts rather than a rise in low-pay earnings.
And, of course, since 1977, the top 20 per cent have enjoyed 230 per cent growth in their real median disposable income while the bottom 20 per cent have only enjoyed a 200 per cent growth.
The ONS data clearly shows that the redistributive arm of fiscal policy boosted the real median disposable income at the lowest level through cash transfers.
It should be emphasised that the trends in low-pay receipt of government tax and transfer benefits are now heading in reverse as the suite of austerity changes start to impact. We will see next year how that plays out.
The Institute of Fiscal Studies (IFS) report (cited in the Introduction) provides a complementary view of what has been happening at the bottom end of the income distribution and the message is very disturbing.
There are two documents available from the IFS:
2. Full IFS Working Paper W17/01.
The IFS “study earnings and income inequality in Britain over the past two decades, including the period of relatively “inclusive” growth from 1997-2004 and the Great Recession.”
They utilise information from the UK’s Family Resources Survey (FRS) published by the Department for Work and Pensions.
The impact measure they focus on is “net household equivalized income”, which “sums all the sources of income received by each member of the household, deducts direct taxes and adds benefits and tax credits, and then equivalises using the modified OECD equivalence scale”.
Individuals “are the unit of analysis”.
Equivalisation adjusts for family structure through a weighting scheme where adults are weighted more than children. It is designed to produce a comparative measure of household income across difference household structures.
This document explains the OECD approach.
The results of their research are summarised as follows:
1. “Twenty years ago only 1 in 20 men aged 25 to 55 with low hourly wages worked part-time. Today 1 in 5 of this group work part-time: a four-fold increase (see Figure). This is the result of a steady trend – not just the recent recession.”
This trend has not spilled over to middle- and high-income workers (less than 1 in 20 work part-time).
2. This trend means that “for men low hourly wages and low hours of work increasingly go together. This has become an important driver of inequality in their pay.”
So, at the top of the distribution “hourly wages of high-earners grew faster than those of middle-earners” and “men with low hourly wages are now working fewer hours per week”.
This trend “predates the recession”.
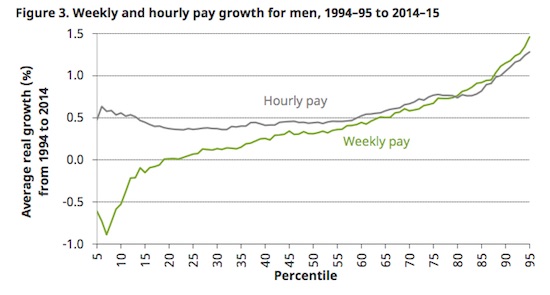
IFS present this graph (their Figure 3) to show the distributional impacts of changing male hourly and weekly pay since 1994.
Not only have low-paid male workers suffered wage stagnation while the top end of the distribution have seen strong growth in hourly pay, the low-paid male workers have also had to endure “the largest falls in their number of hours worked.”
In 1994, 11 per cent of low-paid males (bottom 20 per cent of distribution) worked part-time. By 2014-15, this proportion had risen to around 25 per cent.
As a result, there has been “a substantial increase in weekly pay inequality between men”.
The other staggering result is that the loss of hours worked for the low-paid has not been concentrated among the older or younger workers, who typically dominate the part-time cohort, but “it has happened among prime-age men too”.
The trend has also not distinguished on the basis of marital status or those with children. Low-paid workers of all descriptions are now losing working hours as total spending in the economy continues to lag behind the necessary levels to ensure a stronger labour market.
Government austerity is certainly contributing to this trend.
3. Consistent with the ONS results which focus on short-term movements in inequality, the IFS found that:
Despite rising earnings inequality among working households, inequality in total net household incomes (including benefits and after taxes) across the vast majority of the population is actually lower than 20 years ago. Key reasons for this include tax credits boosting the incomes of low earners, a catch-up of pensioners with the rest of the population, and falling rates of household worklessness.
So overall inequality fell because pensioners were provided with growth in cash transfers even though low-pay males went backwards.
But the top 1 per cent have moved further ahead of the rest:
The ‘racing away’ of the very top of the income distribution began in the 1980s, but continued steadily throughout the 1990s and most of the 2000s, until the onset of the Great Recession.
The big jump in share of household income accuring to the top 1 per cent occurred during Margaret Thatcher’s period of office. The share went from around 3.5 per cent to around 6 per cent. Under New Labour, the share rose further to over 8 per cent and has consolidated around that level.
Conclusion
While British Labour quibbles around the edges with his wage plans, what is really needed is quite radical action. These trends in low-pay for males (with prime-age men now trapped as well) can be reversed in a number of ways.
First, they are the result of a persistent lack of spending in the economy which has created a pool of underutilised labour. If employers in the non-government sector are forced to compete against each other for labour then the situation would change relatively quickly.
Second, a Job Guarantee could eliminate many non-government employers who survive by paying workers low pay and offering them low hours.
These employers would have to restructure their work places or face a loss of workers to full-time employment in the Job Guarantee, where socially acceptable incomes could be earned.
The combination of policies would introduce a dynamic efficiency (lifting productivity and skill levels) and provide low income workers with much better outcomes.
That is enough for today!
(c) Copyright 2017 William Mitchell. All Rights Reserved.
From the data it is clear that the Conservatives (and Blairites) serve the top 1%, presumably because this cohort control the most powerful lobbyists, and they make sure retirees are well looked after so as to get elected, whilst everyone else is left with declining wages, worse job conditions and job security and high unemployment.
Yes, the answer is to unwind the worst aspects of 30+ years of neoliberalism, democratic reform to get the money out of politics, an improved mass media to enable a better informed electorate, much more ongoing well targeted government spending to wake the economy from its torpor, good industrial/commercial/trade policy and a MMT style Job Guarantee system.
For an example of a catastrophic outcome un terms of incomes distribution see the case of Spain: https://www.google.es/url?sa=t&source=web&rct=j&url=http://documentos.fedea.net/pubs/eee/eee2016-24.pdf&ved=0ahUKEwjAnYryrMbRAhVHuBQKHVyzCIYQFgghMAM&usg=AFQjCNE6u9beeAzObRAiOf3_l7vKI3kJZg&sig2=7OztTGgRzbMCDUevpg_GyQ
In the UK housing is surely a major factor in inequality and the transfer of wealth to property owners which means that one of the least socially productive activities is syphoning out of the rest of the economy.
I wanted to ask Bill what the MMT view on Land Value tax would be and how a 40 year housing bubble can be ‘safely’ deflated. Maybe by a combination of a vast social housing building project combined with strict rules about buying-to-let?
The worry is that, using some of these figures as justification, the Tory Gov will attempt to ‘level down’ rather than ‘level up’ relative incomes between age-groups, and the next target to come under attack will be UK State pensioners.
Although benefitting from the Triple Lock in recent years, their pensions rose from a very low base indeed, and at around £150pw, are still woefully inadequate.
Wages should rise of course, but that shouldn’t mean that (already inadequate) pensions be allowed to stagnate, or, even worse, get reduced.
Pensioners are useful conduits for public spending, as they spend every penny right back into the economy, most likely within the week – not only because what they receive is a pittance anyway, but what is there to save for? A rainy day?
For pensioners reliant solely on the State Pension, it’s already bucketing down!
Quite apart from being able or enabling jobs for everyone willing to work, the government should enact a UBI which covers everyone over 18. Not everyone is able or willing to work in what might be seen to be menial dead end jobs. A UBI would do away with pensions and welfare and be vastly simpler than all that, although some allowance for special needs should remain.
My contention is that the cost to the economy in doing this would be relatively neutral. The increased spending power and GDP would rise and boost the economy. This would defeat the mainstream “can’t afford it” mantra.
Everybody would have to have a bank account to get it. Anyone already employed will benefit extra over one unemployed but it means the incentive to work will be little affected. Just the stress will go down.
John Doyle- Housing Costs in the UK bugger all attempts to ‘improve’ the situation. Even with a UBI or a JOb Guarantee, the cost of housing still ensures vast inequality and rentier ‘liposuction’ of the entire economy.
Until that is solved everything is a bit like pissing in the wind. Corbyn’s idea of a vast housebuilding project with at least a 50% social housing component is could as long as there are strict rules surrounding any rentier activity.
But people will vote against that out of fear of negative equity affecting their already mortgaged up to the hilt house!
For decades no-one has come up with anything to deal with this due to depoliticisation of politics and shyster coward politicians who are themselves on the make with housing portfolios.
It seems state distributional impacts with tax credits and protected pensions can
reduce inequality.
My vote is for rent contrils ,capital controls (residential rules for land purchase ) allied
to direct direction of resources for housing to tackle the rentier problem.
It is certainly vital to have full voluntary employment but progressive taxation is a must.
Universal citizens dividend can be a part of that along with higher taxes on higher incomes.
It is the universal aspect of the state pension which undermines the divide and rule
strategies of the elite to separate the deserving and undeserving.
The generational blame game must be avoided too.One much overlooked facet of the
generational economic decline in much of the OECD countries is the role of the Bank
of baby boom mum and dad.As we start to die out generational decline is likely to accelerate
much of our wealth and property will flow upwards to the wealthy.
Many children of millennial will find the bank of mum and dad empty.
I am dubious that increases in the state pension have very much effect on the median incomes of pensioners because it is currently around £8,500 per annum, and a 2.5% increase in that isn’t going to make an awful lot of difference. Added to that, annuities have generally declined, making pesnioners in fact worse off in general. So I think more research would be necessary to descover why the data appear to indicate that pensioners’ incomes have risen faster than those of others (ignoring the 1%). Possibly it may be something to do with final salary schemes which are now being phased out.
Bill
Your informative insight into the income distribution figures and inequality report is a valuable alternative perspective on a subject that is at the centre of current political and economic debate. It provides a counterpoint to the initial press coverage which generally sought to counteract recent condemnation of the elite 1%.
The ordinary citizen meanwhile scratches his head in confusion, striving nonetheless to avoid straying into street level discussion about something that has the hallmarks of irreconcilable lunacy. But inasmuch as he/she understands the basis for all this perplexity, there is one unavoidable fear – loss of livelihood, and its impact on ones family.
That is why political voices need to engage in open discussion about the ramifications of Brexit – the proposed extent of trade tariffs and the impact of trade deals; their impact on employment.
We are already seeing for instance the impact that globalization has on male employment as manufacturing is exported to developing countries. This impact can be seen in increasing numbers of men working in a consumer goods environment (previously female dominated), some of which is merely part-time.
Erecting trade barriers, as Mr Trump requires, will raise issues about global productivity rates and their impact on home country living standards, not least in comparing them with the developing manufacturing powerhouses of the world.
In tandem with these changes, there are enormous challenges confronting just what each country produces and how it goes about making sure its citizens become equipped skillfully to meet new consumer demands.
Simon Cohen
“..and how a 40 year housing bubble can be ‘safely’ deflated..”
One answer might be that it is not actually a bubble. A bubble is something that can burst, whereas the UK has a genuine lack of housing supply which will keep prices high for many years, unless the UK can build many more houses, or until the baby-boomers ‘pass beyond retirement’ and release housing stock into the economy.
Kind Regards
Nigel Hargreaves
“I am dubious that increases in the state pension have very much effect on the median incomes of pensioners because it is currently around £8,500 per annum”
If memory serves me correctly, the government have now abolished means-testing for pensioners, which means all pensioner get the State Pension on top of whatever private pension they receive.
Please correct me if I am wrong.
Kind Regards
CharlesJ
That’s always been the case, and as as from 6th April this year all pensioners who have 35 years of contributions get the same, £155 a week, regardless of whether they have made any additional contributions. There was a graduated contribution scheme which started in the mid-eighties that which was supposed to give an enhanced pension. You could opt to have these additonal contributions forwarded to a private scheme, which I did as I felt more inclined to trust Standard Life than the government. That has proved correct as I now get a private pension on top of my state one. I still maintain that when that increases by 2.5% (assuming inflation has not crept up to more than that) it will make very little difference to the inequality between median pensions and those of the people at the top who have been the recipients of defined benefit pensions or, of course, have been remunerated in work several million a year (in some cases a month or even week). In fact I think I am correct in saying that defined benefit pensions are also index linked – I know my father’s civil service pension was.
Hello Simon Cowen, The government can quite simply build more housing so that there will be enough to go round. An initiative for economic growth as well. The rents can be capped.