The Australian Bureau of Statistics (ABS) released the latest - Consumer Price Index, Australia -…
Inflation rises in Euro Area – but don’t claim it is the ECB’s doing
Eurostat released the latest inflation data for the Eurozone last week (March 2, 2017) for February 2017 – Euro area annual inflation up to 2.0%. As the title reveals the Euro area inflation rate rose from 1.8 per cent in January 2017 to 2 per cent in February 2017. The mainstream narrative is already emerging – ‘see we told you that all that central bank bond purchasing would (eventually) be inflationary’ – type of stories. Bloomberg (March 5, 2017) waded in early with the headline – Draghi Seen Keeping Cool on Stimulus Drive Amid Inflation Surge. I expect a bevy of mainstream economists who haven’t worked out yet they have nothing sensible to add to the public debate will chime in like those wind-up toys that children play with and argue they ‘knew it all along’ – QE would be inflationary. Well I am sorry to say that the data tells us if a significant element of the cost structure rises so will inflation – simple as that. The slight uptick in inflation in the Euro area does not support the mainstream argument that building bank reserves will flood the economy with ‘money’, which then drives inflation.
The Eurostat facts:
1. “Euro area annual inflation is expected to be 2.0% in February 2017, up from 1.8% in January 2017”.
2. “Looking at the main components of euro area inflation, energy is expected to have the highest annual rate in February (9.2%, compared with 8.1% in January), followed by food, alcohol & tobacco (2.5%, compared with 1.8% in January), services (1.3%, compared with 1.2% in January) and non-energy industrial goods (0.2%, compared with 0.5% in January).”
Eurostat provided the following graph that really says it all.
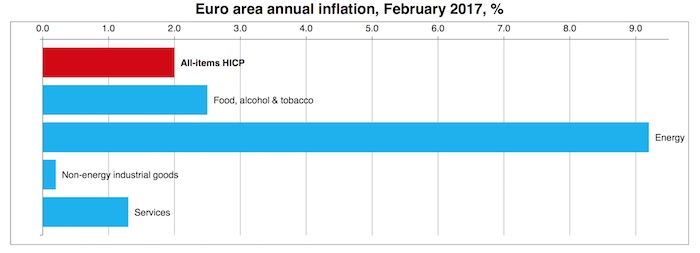
In terms of the basket-weighting of the inflation index, Energy is 95.3/1000 so movements in its prices are very influential in determining the headline Harmonised Index of Consumer Prices (HICP).
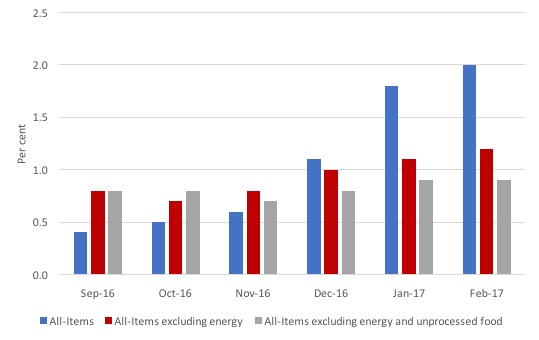
If we exclude Energy price movements the annual inflation rate to February 2017 drops to 1.2 per cent, up from 1.1 per cent.
If we further exclude unprocessed food, which inflated by 5.2 per cent in the 12 months to February 2017 (weather issues), the Euro area inflation rate drops to 0.9 per cent in the 12 months to February 2017, unchanged from January and only 0.1 points higher than it was a year ago.
The following graph shows the movements in the All-Items HICP (annual rate of change), and the same series excluding energy (red), and then excluding both energy and unprocessed food (grey).
Inflation has risen a bit in the last year or so but it just returning to more normal levels after recording a negative result at this time last year as energy prices start to normalise.
The Bloomberg article mentioned in the introduction reports the results of survey of economists who claim that “After the inflation rate quadrupled to 2 percent in just four months, pressure has built on policy makers to map out an exit from unconventional stimulus that started in the summer of 2014”.
In fact, the unconventional monetary policy developments began in May 2010, when the ECB introduced the Securities Markets Program, buying massive quantities of troubled government bonds including saving Italy from running out funds.
I agree with the ECB boss, Mario Draghi that the inflation “spike is mainly due to energy and underlying price pressures remain weak”.
Credit developments in the Euro Area
Another way of examining the underlying developments is to examine credit developments in the Euro area.
For those who are unfamiliar with the range of so-called ‘unconventional’ monetary policy developments in the Euro area over the last several years might read this blog – The ECB could stand on its head and not have much impact – where I document the various policies and ECB statements about them.
I have also considered these policy changes in these blogs (among others):
1. Further evidence that ECB monetary gymnastics have not stimulated lending.
2. The ECB could stand on its head and not have much impact.
3. ECB’s expanded asset purchase programme – more smoke and mirrors.
4. The folly of negative interest rates on bank reserves.
5. Building bank reserves will not expand credit.
6. Building bank reserves is not inflationary.
I updated my monetary dataset from the ECB yesterday to update my knowledge of credit developments in the Euro area.
Mario Draghi and his officials have claimed in the past that the QE and related policy initiatives would drive down bank lending rates (see See) which would would have a substantial impact on “confidence, credit and the economy”.
And, eventually, drive the inflation rate up.
When I last tested that claim (using data up to Deember 2015), the date did not support the ECB line.
Now some 13 months later, we can further assess the impact.
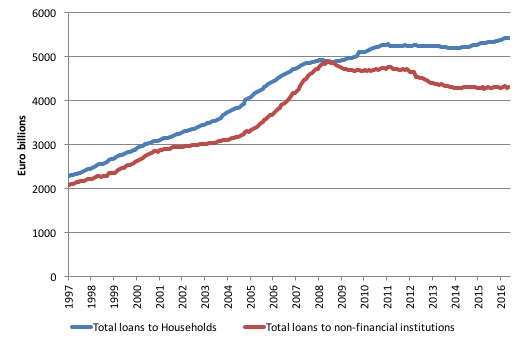
The first graph shows the total loans to households and non-financial institutions (that is, businesses that produce goods and services rather than shuffle money) in the Euro area from September 1998 to January 2017 (this is the entire sample provided by the ECB Statistics Warehouse.
The data is not “adjusted for sales and securitisation”, which the ECB define as “Adjustment for the derecognition of loans on the MFI balance sheet on account of their sale or securitisation.” In other words, the risk is sold off to some other speculator or another. They only started making that adjustment in January 2009.
The data shows the boom then the crash. While the household credit aggregate is now higher than before the crash and is steadily rising, business borrowing remains well down and despite the ECB manoeuvres appears to be going nowhere up.
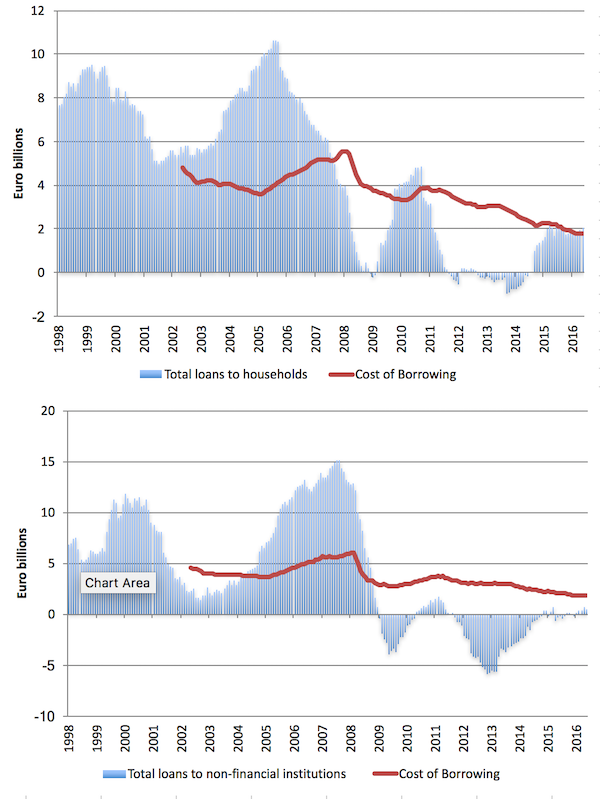
The next graph shows the annual percentage change in borrowing by households (upper panel) and non-financial institutions (lower panel) from September 1998 to January 2017. The red lines are the respective cost of borrowing for each sector (which is only available from January 2003).
There you see the credit binge in both sectors prior to the crisis and the subsequent collapse.
It is clear that the Cost of Borrowing has been steadily declining as interest rates fall and banks repress margins given the lack of borrowers.
But, household credit growth is steady and business credit growth is virtually non-existent.
It is clear that the malaise in Europe has not yet lifted: firms are reluctant to invest (and hence borrow) because of slow sales, while households have also been subdued in their borrowing given the elevated and persistent levels of mass unemployment, the hangover of the credit binge (that is too much debt already), and the general policy uncertainty where Brussels appears not to have a clue as to which way to turn.
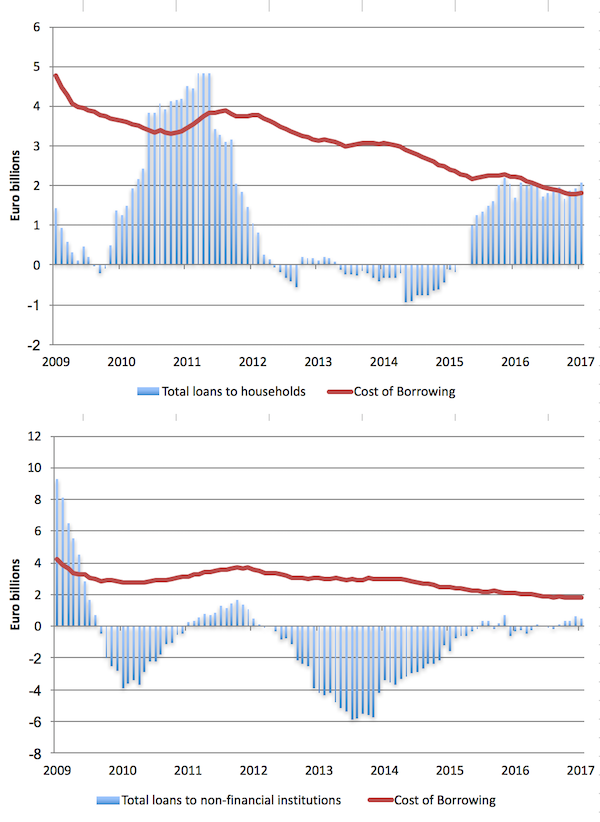
The final graph zooms in on the annual change in borrowing and the cost of borrowing for households (upper panel) and non-financial institutions (lower panel) from January 2009 to January 2017. It gives you a better idea of what is happening now, while the previous graph gave a good historical view of the credit binge and its aftermath once GFC hit.
In the last few months, loans to households have barely changed after increasing in late 2015. This is even though the cost of borrowing continues to be low.
In the case of non-financial institutions, while the contraction in borrowing was abating, the most recent results suggest that any hope for recovery does not appear to be forthcoming, despite very favourable cost of borrowing conditions and a manic central bank intent on capturing headlines with their acronym soup of non-conventional monetary policy manipulation.
Conclusion
Given the scale of the monetary policy interventions over the last year or two one would have expected a much stronger growth in loans, particularly for non-financial institutions if the logic of the central bank was sound.
The central bank can clearly use its currency-issuing capacity to prevent a massive financial meltdown. It can clearly stop governments in the Eurozone from going bankrupt as it did between 2010 and 2012 with the Securities Markets Program.
But what monetary policy in any of its forms cannot do is reverse a major recession where mass unemployment and income losses create deep pessimism among households and firms.
This is especially the case where the relevant fiscal authority (a questionable term in the case of the Eurozone) is intent on maintaining a straitjacket of austerity, which chokes off any green shoots in economic activity.
The big motor is fiscal policy and because of the flawed design in the Eurozone it is dysfunctional in the extreme. Central bank policy shifts can do little to counter the damage that fiscal austerity is doing in Europe.
Today, I am giving another presentation at the University of Maastricht entitled – “The Failure of Economics: theory and reality”. Basically, I will outline how mainstream macroeconomics is no better than fake news.
The difference is that while Fake News appears to be influencing the political cycle, the Fake Knowledge peddled by my professional colleagues under the guise of New Keynesian theory damages millions of people – rendering them jobless and pushing ever more people into poverty.
Last night, I presented a public lecture in Maastricht, which was recorded and I hope to get the footage and make it available here. Stay tuned.
Over the next several days (until the end of next week, in fact), I am quite busy in Europe (heading to Malta later this week) and my blog might be variable in timing and length (including no blog at all!).
That is enough for today!
(c) Copyright 2017 William Mitchell. All Rights Reserved.
The only rational conclusion to be drawn is the the EU is so committed to class war, and so hostile to the social contract, that it’s willing to commit institutional suicide rather than concede an inch to social democracy.
Pretty convincing, Dr. Mitchell.
The household and non-financial institution graphs were mind-blowing for me. Clearly, we have a huge drop in borrowing the the Eurozone after the GFC. If we see data like that in our molecular biology lab, we’d jump onto that and expand our studies from it. I am pretty sure some heterodox economists have known/done it.
I have been reading Debunking Economics by Steve Keen. I read and try my best to explain it to my family when my father picks up my mother and me from work.
Steve Keen debunks supply and demand curves in chapter 1-3 (supply demand curve was taught in my high school, no proof needed of course). He cited Eitemman and Guthrie 1952, which shows that only 5 percent firms follow MC=MR in reality.
I had a chance to listen to Thomas Frank about Bill Clinton yesterday. He said that when NAFTA was being discussed, economists wrote letter to Clinton saying that NAFTA was a good idea. They turned out to be wrong, of course.
Start to think that neoclassical economists are big part of the problem the West faces that do not have the proper attention. People get mad at politicians but never the economists that give them bad advice. Before learning a bit about economics, I thought economists had sound theories.
The silver-lining for me is that economists make me question my assumptions when i conduct my experiments. I do not want to do crappy science like they do.
France is at 3.6% of gdp for it’s deficit spending. Isn’t this part of the reason for the slight uptick in 2016? The Eurocrats don’t want Marine Le Pen to win the French election so they are letting Hollande exceed the 3% limit without making a big fuss. If some variety of neo-liberal wins that election you can expect this small fiscal bump to go into reverse.