It's Wednesday and I discuss a number of topics today. First, the 'million simulations' that…
The poor are getting poorer in the US
Yes, the ‘politics of envy’. That is one of the epithets that the neo-liberal apologists use to defend the fact that the top-end-of-town are increasingly seizing the major proportion of any growth in wealth. They claim that shifts in the distribution of wealth and income do not matter if the levels of each distributional cohort (say, a decile or quintile) are all moving up. They ask the question: Why should a poor person care if a rich person is getting much richer as long as the poor are becoming less poor in absolute terms? The facts are that in advanced countries, the wealth accumulation of the last three decades has not been particularly beneficial to the poorest members of society. The rich have experienced massive gains in wealth even if the poor have enjoyed modest gains. But in the US, not only has the wealth distribution moved heavily towards the top end, the bottom 50 per cent now have less wealth than they had before the GFC began and have not increased their wealth since 1989 (when comparable data is available). And further, even if the bottom end of the distribution improved their absolute position, it still remains a major problem for wealth to be increasingly concentrated among the rich. It erodes the democratic process and increases social polarisation.
I was listening to a radio program the other evening (while driving) where the presenter hammered on about what she claimed to be the stupidity of the progressive obsession with distributional issues (wealth and income). She had an American conservative commentator on who claimed that everyone in the US were wealthier now as a result of the increasing neo-liberalisation of the economy since the 1980s.
He was referring to the financial deregulation that really took hold in the last 1980s and beyond.
I had recalled reading a document analysing the US distribution of wealth from last year which had led me to believe that the poor have become poorer in the US over the 8 or 9 years.
So I did some digging back in my notes to see whether my recall was contrary to what the radio program had been saying. This is what I came up.
On August 18, 2016, the US Congressional Budget Office released a report – Trends in Family Wealth, 1989 to 2013.
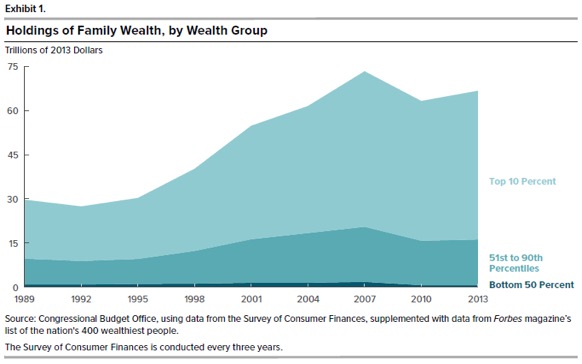
The headline fact is that in real terms, family wealth in the US in 2013 was $US67 trillion up from $US30 trillion in 1989.
The distribution of this wealth has become more skewed over the last 30 years.
The CBO publication tells us that:
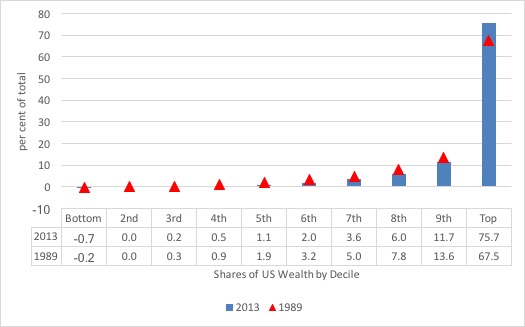
In 2013, families in the top 10 percent of the wealth distribution held 76 percent of all family wealth, families in the 51st to the 90th percentiles held 23 percent, and those in the bottom half of the distribution held 1 percent … The distribution of wealth among the nation’s families was more unequal in 2013 than it had been in 1989 …
For instance, the difference in wealth held by families at the 90th percentile and the wealth of those in the middle widened from $532,000 to $861,000 over the period (in 2013 dollars). The share of wealth held by families in the top 10 per- cent of the wealth distribution increased from 67 percent to 76 percent, whereas the share of wealth held by families in the bottom half of the distribution declined from 3 percent to 1 percent.
So the progressive case, that wealth inequality in the US has been rising is clearly correct.
The following graph shows the shifts in shares of US Wealth between 1989 (red triangle) and 2013 (blue bars) by decile.
All groups other than the top 10 per cent of the distribution have lost ground since 1989.
But then comes the so what moment? The conservatives like to believe their ‘free market’ machine is making everyone better off. Yet, while they might be able to quote World Bank data that says that the poorest people in the world as slightly less poor now than say in 1989, they don’t have to look very far to see that in the advanced nations things are turning out differently.
The CBO data shows that in the US the bottom 50 per cent of families ranked by wealth are now poorer in real absolute terms than they were in 2007 and no better off than they were in 1989.
The ‘middle class’ (51st to 90th Percentiles) are also poorer in real absolute terms than they were in 2007 although they are better off than they were in 1989 (67 per cent growth over 1989-2013).
Meanwhile the top end of town (top 10 per cent) are only marginally poorer in real absolute terms than they were in 2007 but have grown their wealth by 155 per cent since 1989.
The average wealth for a family in the top 10 per cent of the Wealth Distribution grew from $US2,153,000 in 1989 to $US4,130,000 by 2013.
If we dig deeper in the deciles, we find that the fifth percentile had negative wealth of $US1000 in 1989 and this had grown to -$US19,000 by 2013.
In contradistinction, the 95th percentile had seen its wealth grow from $US1,150,000 to $US1,872,000.
The following graph was produced by the CBO (Exhibit 1).
So the claim that all the boats are rising is now false. The US is increasingly becoming a divided society in terms of wealth and the command (power) that wealth brings.
Neo-liberalism is failing more than half the families in the US.
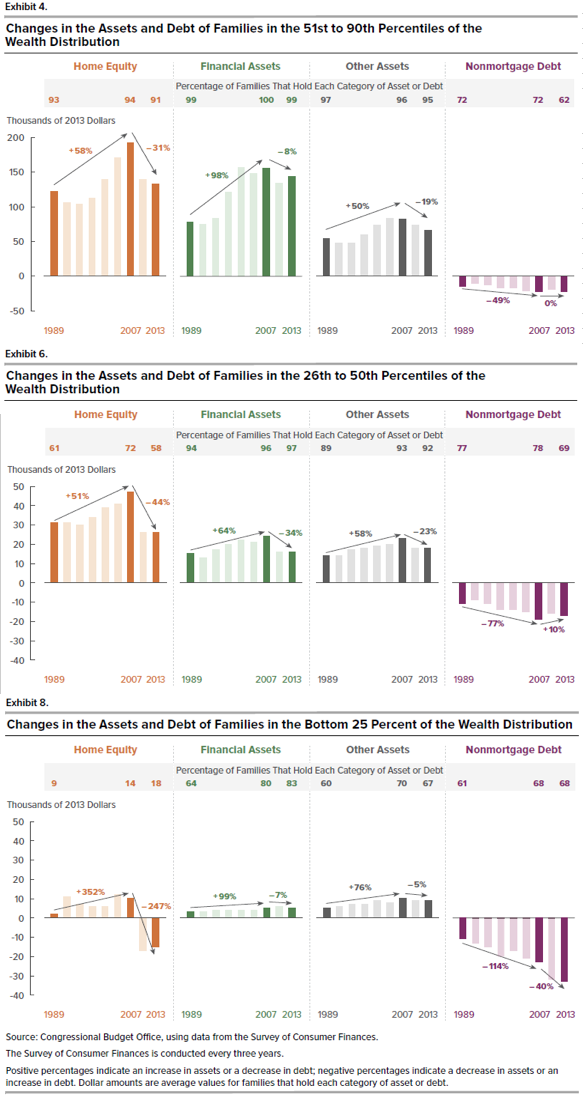
There was three other graphs produced by the CBO publication that were rather significant (Exhibits 4, 6 and 8, reproduced below).
Exhibit 4 shows what happened to the 51st to 90th Percentile wealth holdings by the changes in debt and assets held by those families. Exhibit 6 repeats the exercise for the 26th to 50th Percentile, while Exhibit 8 shows the data for the Bottom 25 per cent in the Wealth distribution.
I have stacked these graphs on top of each other for ease of comparison (keeping the footnotes only for Exhibit 8).
The summary results across all three cohorts are as follows:
1. “From 1989 until the recession of 2007 to 2009, increases in homeequity and in the value of financial assets (such as retirement accounts and financial securities) and other assets (such as business assets and real estate other than a family’s primary residence) all contributed to rising wealth” for families in all three distributional cohorts, albeit at different proportions.
2. Between 1989 and the recession, non-mortgage debt grew for all three groups, rather substantially reducing wealth by 49 per cent for the 51st to 90th group, 77 per cent for the 26th to 50th group and 114 per cent for the bottom 25 per cent.
3. “The recession and its aftermath were marked by declines in all asset categories for families” in all the distributional cohorts, the crash for the Bottom 25 per cent being equal to 247 per cent wealth losses. The 26th to 50th group lost 44 per cent from home equity and the 51st to 90th group 31 per cent.
4. But look at the movements in non-mortgage debt since the recession. The percentage of families in the 51st to 90th group that held non-mortgage debt “declined from 72 percent to 62 percent between 2007 and 2013” and “the families that held such debt, the amount of debt remained about the same”.
In the 26th to 50th group, that share of families holding such debt fell from 78 to 69 per cent, but, significantly, the average amount of that debt fell.
But, the share for the Bottom 25 per cent group “remained unchanged” and “the average debt increased from $23,000 to $33,000, much of it in student loans.”
5. Note also that for the 26th to 50th group, “The share of homeowners whose mortgage debt exceeded their homes’ value rose from 1 percent to 8 percent” after the recession.
6. “Although, on average, the value of assets increased for families in the bottom 25 percent of the wealth distribution between 1989 and 2007, that rise was offset by the group’s burgeoning nonmortgage debt over the same period.”
7. “During the recession of 2007 to 2009, average wealth for families in that group declined precipitously … for two main reasons: the loss in home equity experienced by the group’s homeowners and the continued growth of their nonmortgage debt.”
So fairly stark results which challenge the neo-liberal assertion that all boats have risen in this neo-liberal period. The bottom 25 per cent, at least, are worse off overall and are bearing a heavier debt burden (in relation to their wealth holdings) than the higher income and higher wealth cohorts.
The CBO report also shows that families headed by someone with education attainments lower than a Bachelor’s Degree has gone backwards since 1989.
For those with less than High School, their median family wealth has fallen from $US40k in 1989 to $US17k in 2013. With only High School completion, $US61k to 52K. Some College, 75k to 50k.
Those with Bachelor’s degrees have seen growth in median wealth from $US174k to 202k, while successful higher degree recipients have enjoyed growth in median wealth from $US284k to 419k.
So an American family without university education is looking pretty grim.
Remember, in this blog I am not considering income inequality, which has also become more skewed in most nations over the last 30 years of neo-liberalism.
Why should we care?
I think there are two concerns and they relate to both the level of wealth and the distribution of wealth.
I don’t support the view that as long as everyone is getting richer it doesn’t really matter what is happening at the top-end of the wealth distribution.
First, the income and wealth distributions are intrinsically linked because of stock (wealth) – flow (income) relationships. While the wealth distribution is usually more skewed than the corresponding income distribution, it remains that the two go together.
I have written about the relationship between growth and income inequality previously – among other blogs see:
1. Growth and Inequality – Part 1
2. Growth and Inequality – Part 2
3. Growth and Inequality – Part 3
4. Growth and Inequality – Part 4
Higher income inequality undermines economic growth and biases an economy towards recession.
Second, it is clearly the case that in advanced nations such as the US, the poor are getting poorer, while the rich enjoy extravagant gains in their absolute and relative positions.
We know that there are gender and ethnic biases across the distributional deciles. In the US, for example, people of colour are concentrated at the bottom end of the wealth distribution.
We observe a swathe of pathologies associated with such poverty including:
1. Health problems (obesity, mental illness, drugg and alcohol abuse).
2. Reduced life expectancy.
3. Higher participation in criminal activities.
4. Poor social mobility and intergenerational disadvantage (kids inherit the poverty).
While the rich get sick, the poor get sick disproportionately.
Interestingly, these problems are characteristic of unemployment, which is, of course linked to poverty in a direct way.
Third, it is clear that poverty becomes a trap for those at the bottom of the wealth distribution. The myth that neo-liberals like to float is that people who work hard can achieve upward mobility in any free society.
This is the argument that says as long as opportunity is equal then we should not worry about outcomes (such as those evidenced in the wealth distribution).
Research squashes that claim pretty comprehensively.
Canadian economist, Miles Corak has done excellent research that debunks the social mobility hypothesis.
His July 2013 report – Income Inequality, Equality of Opportunity, and Intergenerational Mobility – provided a cross-country analysis which showed that:
… underlying trends suggest that these drivers will most likely lower the degree of intergenerational earnings mobility for the next generation of Americans coming of age in a more polarized labor market, while the substantial rise in the income shares of the top 1 percent, their access to sources of high-quality human capital investment for their children, and the intergenerational transmission of employers and wealth will imply a much higher rate of transmission of economic advantage at the very top.
He concluded that for the US there were multiple factors operating which lock the poor into the bottom end of the income and wealth distributions despite the claims that the US is the land of opportunity.
1. There is “Relatively less upward mobility of the least advantaged”.
2. “Intergenerational mobility is also lower because children of top-earning parents are more likely to become top earners in their turn. An era of rising inequality is more likely to heighten these differences than to diminish them.”
3. “Inequality lowers mobility because it shapes opportunity” – the poor might make choices but they have less of them to make and the returns from different choices are, at best, modest compared to the choice set available to the more wealthy.
Corak shows that Italy, the US and Britain (among the wealthy nations) have very low social mobility. The outcomes of the children are heavily tied to the status of their father in these countries.
If the father is rich the son is likely to follow and vice versa.
There are other problems with excessive wealth, especially when combined with the neo-liberal bias towards fiscal austerity.
High income and high wealth cohorts save more and thus require higher fiscal deficits, other things equal, to maintain spending growth. As the distributions become more skewed, this requirement intensifies.
It also means that the poor become more reliant on debt (as the data above shows).
Taken together, these trends bias economies to slow growth and crises.
Finally, wealth provides opportunities. Use of power – industrial, social, political, whatever – is enhanced by wealth. As more and more of a nation’s wealth is concentrated in the hands of a few, irrespective of whether the poor are becoming richer, the political process becomes more compromised.
The rich have a voice – the poor remain silent.
Conclusion
I have been collecting data for other nations. The trends in the US are, in some respects, exceptional – this is one way in which American Exceptionalism is manifesting – in the sense that the poor have become poorer.
But in other advanced nations such as Australia and the UK, real wealth has barely increased for the bottom end of the distribution and the same people have suffered flat income growth for some period now and are increasingly exposed to unsustainable housing debt.
This discussion is just another angle on the failure of neo-liberalism.
That is enough for today!
(c) Copyright 2017 William Mitchell. All Rights Reserved.
“Yet, while they might be able to quote World Bank data that says that the poorest people in the world as slightly less poor now than say in 1989, . . . ”
Some quote this:
‘While the numbers of people living in extreme poverty has indeed halved, many of those people are still poor, deprived of their basic needs. A more accurate measure of poverty shows that the number of poor worldwide has overall increased.
As the London-based development charity ActionAid showed in a 2013 report, a more realistic poverty measure lies between $5 and $10 a day. World Bank data shows that since 1990, the number of people living under $10 a day has increased by 25 percent, and the number of people living under $5 a day has increased by 10 percent. Today, 4.3 billion people - nearly two-thirds of the global population - live on less than $5 a day.
So really, poverty has worsened in the Age of Progress. And now the unsustainability of this equation is coming home to roost even in the centres of global growth, where wealth is most concentrated.” ‘
Dear Bill
The distribution of income is more important than the distribution of wealth because it is mainly income that determines the level of consumption. The lowest half of the American people may have only 1% of the wealth, but they certainly have more than 1% of total American income. The distribution of wealth is always more unequal than the distribution of income.
Of course, wealth also affects consumption. Personal wealth is in the form of consumer durables such as houses, cars, boats, jewelry, fashion clothes. If I own a Lamborghini and a 20,000=dollar watch, then driving the car and wearing the watch are forms of (conspicuous) consumption. The golden toilet seats which Trump owns are consumed when he relieves his bowels. Household debt, which is one reason why the lowest 50% has so little wealth, reduces the level consumption because part of the disposable income has to be diverted to paying the interest on the debt.
The drastic fall in the interest rates in much of the world must have allowed the poor to consume more and force the rich to consume less. Poor people are mainly interest payers, while rich people tend to be interest receivers. I’m not talking about interest on business loans here, which is of course a cost of doing business.
Regards. James
Bill,
The UK PM claims the wealthy pay the most income tax ignoring that the 1% have garned the most income and with avoidance pay relatively less as a % -also UK taxation now skewed to consumption with VAT so the poorest pay relatively more of their income on taxed essentials.
In the UK, the housing bubbles over the last 40 years has ‘locked in inequality’ as one commentator put it:
“explosion of liquid wealth that would create instant and colossal inequality”: a society with an upper class rich enough to maintain servants, in a “court city” drained of industry that had reverted to the production of luxurious baubles.
The neoliberal myth that ‘hard work’ produces wealth for you is constantly parroted. In a recent ‘interview’ (on the BBC so you can’t really call it an ‘interview’) Theresa May was asked about Nurses who have to use food banks. May’s response was ‘there are all sorts of reasons why people go to food banks.’ The usual response of a Neo-liberal implying it was really the fault of the person because they weren’t working for a hedge fund and made a poor choice to become a nurse. This out of the mouth of someone who went from banking to politics and has done nothing worthwhile in her working life except, to use Bill’s term, ‘shuffled wealth.’
Simon, one commentator’s reaction in the Guardian to May’s ridiculous comment about food banks was “most likely poverty and hunger” while another mentioned women’s health products, which can be obtained from food banks.
Bill,
The wealth data is interesting. But if we frame the discussion entirely in terms of GDP and monetised wealth holdings we risk leaving out important considerations. To some degree focussing on dollars concedes terrain unnecessarily to the “enemy”. We should also consider inequality in real terms: what is people’s access to health care, education, sanitation, housing and other necessities of life?
We don’t have to put a price tag on each of these things, because they don’t *have* to be provided by market mechanisms. To take a trivial example: look at Exhibit 1. The wealth holdings of the top 10% fell between 2007 and 2010. But did their houses collapse, and share certificates disintegrate? No, they were just revalued. In most cases, little hardship was experienced. Of the bottom 25%, less than one in five held home equity. Did the rest live through 2007-10 without being affected by the economic crisis? Hardly, but their experience is not easily captured by the figures presented here.
And what of trickle down economics – kiss the ass of a billionaire and wait for the trickle down? The left need to focus more on wealth taxes and removing all indirect subsidies from private (public school – there is an oxymoron for you). It is unfortunate that we dont have a politically useful way of gauging the value of public services to low and lower income citizens because this would enable an evaluation or possibly a measure of poverty mitigation and poverty exacerbation in the case of austerity cuts to public services.
Dear Bill, it would be great if you write a blog about Bulgaria where the minimum pension is around 90 euro per month.
Nurses going to food banks? Pretty shocking. Maybe that happens here in America too, but I just never hear about that.
Aren’t nurses the definition well-educated, productive, and important members of society?
If your nation’s nurses are struggling to make ends meet, how do you expect a productive society? I don’t know much about Theresa May, she reminds me of Hillary Clinton. From that comment, I know she is unfit for office because simply doesn’t know how to lead a nation forward. Excuses don’t help anyone, do something.
I love how politicians keep appealing to values (what kind of values? Correct values? They never explain. I guess dropping bombs on Yemen is a great value since they do that a lot), but then turns a blind eye to nurses struggling.
For Neo-liberals, constant regression and reveling in squalor is the highest virtue, but funny enough they never expect themselves to follow that.
Hey! We do not and should not expect the next generation to struggle as much as we have. We have government vaccinating people because we think that a society should care for the next generation so that they don’t have to suffer the pain previous generation did–this is called progress.
Neoliberals take the humanity out of society and replace it with neoclassical free market cult and financial industry parasites and call it progress.
~@Tom
“If your nation’s nurses are struggling to make ends meet, how do you expect a productive society?”
Even more incredulously, they will become poorer on present trends, yet they continue to vote for the same politicians who’s policies make them poorer.
Their reason for doing this is even more irrational, namely that out of fear of becoming poorer still,(inevitable given who they vote for!) their instincts are to vote for the devil you know rather than try to learn why doing so would be a bad idea.
But that would mean they would have to waste less time on social and mainstream media and read Bill’s site instead.
Of course if that happened bankers and their crony status quo media and political types would quickly begin making noises about needing to shut down the internet, to stop that kind of “terrorism!” LOL!