This week, the UK Chancellor releases the latest fiscal statement (aka 'the budget') and will…
Australian government in contractionary bias when stimulus is needed
This will be my only commentary on last night’s fiscal statement (aka ‘the budget’) from the Australian Treasurer unless I make another one. There were few surprises and lots of tricks all aimed at presenting a government that has abandoned its extreme right-wing ‘hit the poor the most’ past (as in 2014 and 2015) and decided to quell the deficit and debt hysteria that the right-wing of its party had determined was the best way to win votes. The conservatives are still in office but now they just claim that “the government has to live within its means” and spreads the adjustment profile by which it claims it will force the government to do that over a longer time period (2020-21 the first fiscal surplus is projected). It is big on claims about infrastructure development but, in fact, it tricks the population into believing that cuts are increases. It talks about fairness but introduces compulsory drug and alcohol testing for income support recipients because apparently you “can’t go to work if you are smashed”. It also includes projections that are required to get the surplus projection which are simply unbelievable, which means the 2020-21 surplus is just a token. Even the Treasurer has stopped short of promising its realisation saying the figure is just a “projection”. The government is cutting spending on universities despite saying it wants Australia to be a clever country. And in making changes to secondary education funding in general it is squeezing into the natural territory of whining Labor Party opposition and giving them nowhere to go. That Party has become trapped by its own adherence to neo-liberalism and now just looks stupid. In summary, it still delivers contraction in the year ahead at a time when Australia is growing well below trend and domestic spending growth flat. In other words, to be a fair and responsible policy document it should have increased the deficit over the next few years to stimulate employment growth and bring down unemployment and underemployment.
Consider these graphs
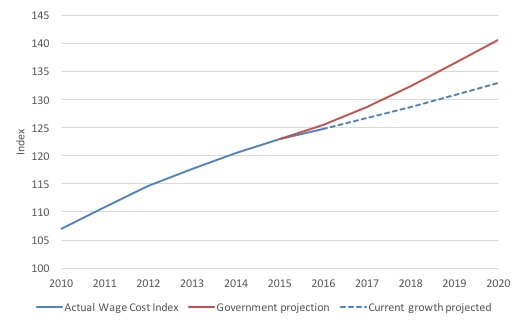
Consider the following graphs. They are two different views of wages growth in Australia, which is now at record lows in relation to the preferred Australian Bureau of Statistics measure the Wage Price Index.
The first graph the actual annual growth since the 1998-99 financial year up until the present period (the 2016-17 result is the average of the September and December quarters only). It has been trending down for several years now as the impact of the elevated levels of labour underutilisation take their toll.
The red bars are the estimates and projections in Statement 2: Economic Outlook – published last night by the Government.
For the last two years shown I just assumed the same 3 per cent growth rate that the Government claims will occur in 2018-19.
Note also that the projected unemployment rate is set to remain well above the pre-GFC low (5.5 per cent out to 2018-19) and the participation rate is projected to fall a tad over the period to 2018-19.
Employment growth is projected by the Government to be modest at best over this period. With the continuing bias towards part-time work and entrenched underemployment, it is clear that the Australian economy is not projected to go anywhere near full employment over the projected period of the fiscal aggregates.
The current broad labour underutilisation rate is 14.6 per cent.
So the reasonable question is: How the hell will the Wage Price Index recover so strongly and so quickly?
The reasonable answer is that it will not – the dynamics are just not going to be there.

The second graph shows the Wage Price Index itself (since 2010-11). The red line is the fiscal projections for the wages growth, while the blue dotted line is a reasonable projection based on recent growth (with no material change in labour market conditions projected).
You can see there is a credibility issue here in terms of a key Government projection.
Why does this matter?
Consider the following graph, which shows government payments and receipts as a percentage of GDP from 1970-71 out to 2020-21
The dotted segments are the fiscal statement projections.
You can see that while payments are projected to stabilise around 25 per cent of GDP, receipts are projected to bolt up from the current 23.2 per cent to 25.4 per cent.
Hence the projected fiscal surplus in 2020-21.
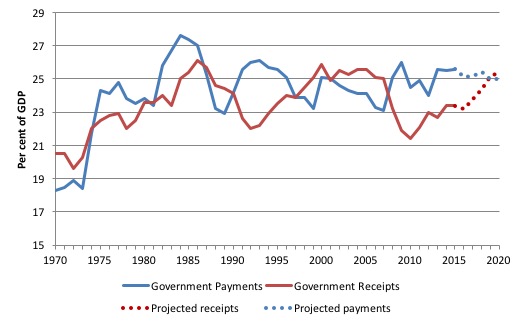
As an aside, the graph also tells you that the Government has abandoned its denial that there is no policy room on the receipts side, which it used to justify its inane claim that to get the fiscal balance back into surplus it had to hack into spending.
Effectively receipts fell in the slowdown during the early days of the GFC (as one would expect – with employment growth falling etc).
The introduction of the fiscal stimulus saw receipts grow more quickly as employment growth picked up again but then the austerity push in 2012 by the previous government stalled receipts as the economy slowed and unemployment rose again.
Now the Government is predicting a rather massive rise in taxation receipts even after it has cut company tax rates.
How is that going to happen?
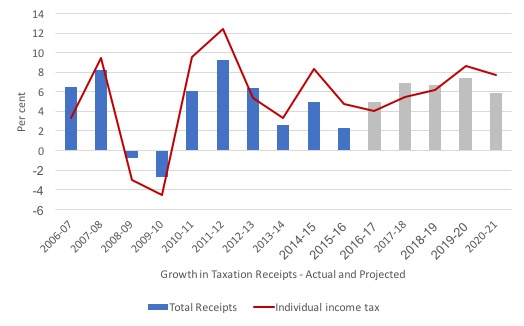
Consider the next graph, which shows the growth in total Australian government receipts from 2006-07 to 2020-21 (the gray bars being the fiscal projections) and the growth in individual income tax receipts over the same period (red line).
The Government is projecting a massive about turn in income tax receipts over the forward estimates.
Why? Because it is projecting a massive (unbelievable) rise in wages growth (as noted above).
Will it happen? Not likely.
Fiscal surplus in 2020-21? Not likely.
Does it matter? Not at all. It has become a token only. People are wising up to the fact that fiscal deficits do not matter in the sense they are not intrinsically bad.
The Government has to claim it will record a fiscal surplus in 2020-21 because it has been banging on about it for so long that it would lose total credibility if it did not.
Expect to hear some noises about AAA-rating being threatened by the extended deficit horizon. But again, that is all hot air.
What actually matters is that the fiscal strategy unveiled last night still invoked a contractionary bias (albeit modest) at a time when the opposite is really required.
The contractionary bias
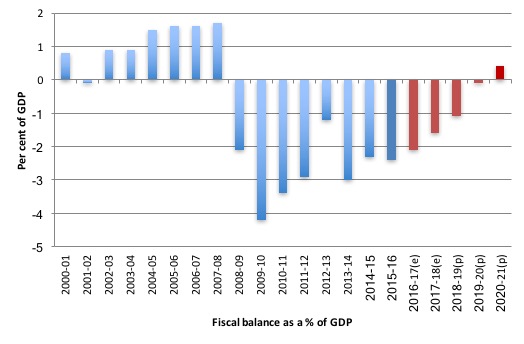
The fiscal statement released last night by the Treasure has the following forward estimates for the fiscal balance as a percentage of GDP. The graph starts in 2000-01 and goes to 2020-21
The red bars are the latest projections from the current Government as outlined in last night’s statement.
The fiscal deficit is projected to fall from $A39,606 million in 2015-16 to $A37,600 million in the current financial year (2016-17). Thereafter, it falls until a surplus of $A7,417 million is projected in 2020-21.
The projected fiscal shift from last financial year is 0.3 points of GDP. The outstanding fiscal deficit is thus estimated to come in at -2.1 per cent of GDP.
The Treasury estimates that the government will reduce its increasingly reduce its contribution to growth in the remaining years of the forecast period until 2020-21, when the fiscal surplus is projected to be 0.5 per cent of GDP.
The fiscal shift from one year to another is the change in the fiscal balance as a percentage of GDP changes. It is the result of two factors – the fiscal balance itself (in $As) and the value of nominal GDP (in $As).
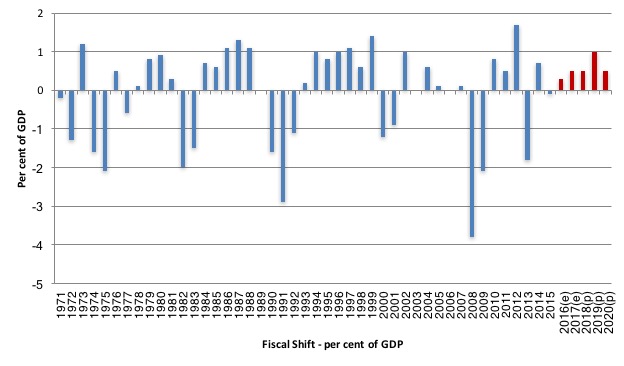
The following graph shows the recent history (from 1970-71) of fiscal shifts.
The biggest fiscal swing in the previous conservative government’s tenure was in the financial year 1999-2000 (a shift of 1.4 per cent).
A sharp slowdown in the economy followed that contraction and the fiscal balance was in deficit two years later (2001-02) – the only deficit they recorded in the 11 years in office.
The Australian economy only returned to growth because the Communist Chinese government ran large fiscal deficits themselves as part of their urban and regional development strategy. That spurred demand in our mining sector.
The largest fiscal shift in the sample period shown was the second-last fiscal statement from the previous Labor government in 2012-13 which was equivalent to 2 per cent of GDP. They prematurely withdrew the fiscal stimulus bowing to the assault from the neo-liberal press and commentariat about the dangers of deficits. It was a moronic and damaging retreat.
A major slowdown followed and dented the recovery from the GFC that had been spawned by the fiscal stimulus in the previous two years.
That Labor government was obsessively trying to achieve a fiscal surplus in 2013-14 and was blind to the reality that the private domestic sector was not going to fill the spending gap left by the retrenchment in net government spending.
The result – which was totally predictable – the economy took a nosedive, tax revenue fell even further and the fiscal balance moved further into deficit with unemployment rising.
The reversal in the fiscal balance was larger than the attempted contraction the year before (1.9 per cent compared to 1.7 per cent), which just tells you that it is folly to try to cut a deficit when private demand is weak.
In last night’s fiscal statement, the forward estimates imply a tightening of fiscal policy (red bars). The fiscal shift in the current year (2016-17) is only 0.3 per cent of GDP, and this increases in the following year (2017-18) to 0.5 per cent of GDP, then 0.5, 1.0 and 0.5 by 2020-21.
With private domestic spending weak and the external sector draining growth on a continuous basis this is a poor fiscal strategy.
Unless there is an extraordinary pick up in private spending or net exports then the economy will not achieve the underlying growth assumed and we will be left at the end of the fiscal year with a fiscal deficit higher than they forecast and an even weaker economy than exists now.
While many commentators are claiming that the small discretionary fiscal contraction next year is benign, the reality is that it has to be set against the context and what that context implies.
My assessment is that the fiscal deficit should be much larger this year and next than it will be and that means the small fiscal contraction is still going to be irresponsible.
In other words, the government is invoking a pro-cyclical fiscal policy change, which are the anathema of responsible fiscal management.
Discretionary changes in fiscal policy should typically be counter-cyclical – to manage output gaps. The only time an expansionary discretionary fiscal change should be pro-cyclical is when growth is positive but not strong enough to achieve full employment. Once capacity is reached, fiscal policy should counteract non-government spending changes.
The private sector’s debt position is set to worsen
The economic predictions, which underpin the fiscal statement and are contained in Budget Paper No.1, show that the Treasury is forecasting the following outcomes:
1. The fiscal deficit for 2016-17 of -2.1 per cent of GDP reducing to -1.6 per cent of GDP in 2017-18, then -1.1 per cent (2018-19), -0.1 per cent (2019-2020) and a surplus of 0.4 per cent in 2020-21.
2. The current account deficit to be come down from 4.4 per cent in 2015-16 to -1.5 per cent of GDP in 2016-17 and 2017-18, then stabilising at 2 per cent (2018-19).
I note that the average current account deficit since fiscal year 1974-74 to 2015-16 has been -3.9 per cent of GDP. So we might consider that sort of performance to continue over the fiscal projection period. There is certainly no expectation that the current account will suddenly record close to balance as is projected by the Government over the fiscal forecast period.
So what does that mean in terms of the sectoral balances?
We know that the financial balance between spending and income for the private domestic sector equals the sum of the government financial balance plus the current account balance.
We can re-write Expression (6) in this way to get the sectoral balances equation:
(1) (S – I) = (G – T) + CAD
which is interpreted as meaning that government sector deficits (G – T > 0) and current account surpluses (CAD > 0) generate national income and net financial assets for the private domestic sector.
Conversely, government surpluses (G – T < 0) and current account deficits (CAD < 0) reduce national income and undermine the capacity of the private domestic sector to accumulate financial assets.
Expression (1) can also be written as:
(2) [(S – I) – CAD] = (G – T)
where the term on the left-hand side [(S – I) – CAD] is the non-government sector financial balance and is of equal and opposite sign to the government financial balance.
This is the familiar MMT statement that a government sector deficit (surplus) is equal dollar-for-dollar to the non-government sector surplus (deficit).
The sectoral balances equation says that total private savings (S) minus private investment (I) has to equal the public deficit (spending, G minus taxes, T) plus net exports (exports (X) minus imports (M)) plus net income transfers.
All these relationships (equations) hold as a matter of accounting and not matters of opinion.
The following graph shows the sectoral balance aggregates in Australia for the fiscal years 2000-01 to 2020-21, with the forward years using the Treasury projections published in ‘Budget Paper No.1’.
The vertical black line demarcates the actual from the projected data.
All the aggregates are expressed in terms of the balance as a percent of GDP
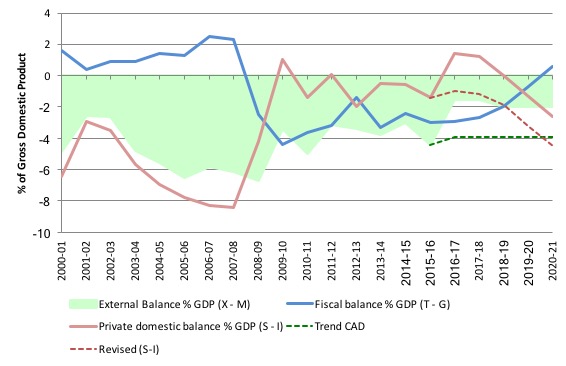
So it becomes clear, that with the current account deficit (green area) more or less projected to be constant over the forward estimates period, the private domestic balance overall (solid red line) is the mirror image of the projected government balance (blue line).
In the earlier period, prior to the GFC, the credit binge in the private domestic sector was the only reason the government was able to record fiscal surpluses and still enjoy real GDP growth.
But the household sector, in particular, accumulated record levels of (unsustainable) debt (that household saving ratio went negative in this period even though historically it has been somewhere between 10 and 15 per cent of disposable income).
The fiscal stimulus in 2008-09 saw the fiscal balance go back to where it should be – in deficit. This not only supported growth but also allowed the private domestic sector to rebalance its precarious debt position somewhat.
You can see the red line moves into surplus or close to it. The long-run average private domestic deficit is 2.1 per cent of GDP and was achieved largely when the household saving ratio was between 10 and 16 per cent and private investment in capital formation was strong.
The fiscal strategy outlined by the Government last night now implies as the graph shows that the private domestic sector will once again be accumulating debt as it progressively spends more than its income.
If you do not believe the very optimistic external deficit assumptions built into the fiscal strategy (join the crowd), then the dotted lines show an alternative scenario based on the long-term average current account deficit of 3.9 per cent.
Under this more realistic assumption, the private domestic sector experiences increasing deficits – heading towards the pre-GFC levels.
Either way, we are on the path back to the excessive private domestic debt levels that prevailed before the GFC.
Further, the fiscal estimates suggest that total private investment will decline by 6 per cent in 2016-17, be flat (no growth) in 2017-18 and exhibit modest growth in 2018-19.
For the overall sector balances to have any coherence – then the following observation is obvious.
For the private domestic sector to move from a deficit of 0.6 per cent of GDP in 2015-16 to 4.5 per cent of GDP in 2020-21 under the alternative (dotted) assumptions or to 2.6 per cent of GDP under Government assumptions, with private investment in sharp decline or largely static, the household sector is going to have to be spending much more than its income, and, increasingly so.
That would mean the implied build up of private sector debt will be borne by the household sector, already carrying record levels of debt.
But, then you examine the other fiscal projections in Table 1 of the Economic Outlook, presented in Budget Paper No.1 and the outlook for household consumption and dwelling investment are fairly constant or falling (in the case of homeinvestment).
So the question then is obvious – where is all the private domestic sector spending implied by the sectoral balances analysis going to come from?
The answer is also obvious: the Treasury estimates are inconsistent. They do not add up. Which would not be the first time that observation has been apparent.
In other words, the fiscal estimates provided by the Government are concocted in an ad hoc manner which little recognition of the underlying relationships that have to hold between the three macro sectors.
If the projections are to be believed then the Government is expecting the private domestic sector to maintain the growth in the economy by increasing its indebtedness.
That would mean we are heading in the same direction as before the crisis – growth becomes reliant on private debt buildup.
The whole nation is transfixed on fears that the government debt in Australia is too high – courtesy of all the scaremongering that has been going on. But nary a word gets mentioned about the dangerous private debt levels. It is true that most of the debt is owed by higher income people in Australia, which makes an insolvency crisis of the likes of the sub-prime less likely here.
But the reality is that the debt levels and the growth in them (about the same as disposable income) means that consumer spending is likely to remain fairly subdued overall. It is unlikely we will see a return to the pre-crisis period when debt grew much faster than disposable income and the resulting spending maintained stronger economic growth.
The Infrastructure con
In an attempt to appeal to the voters, the Government is now selling itself as the ‘infrastructure’ government – and has coined a flawed distinction between ‘good debt’ and ‘bad debt’ to justify its shift in position from cutters to investors!
Good debt is apparently when the results of the spending deliver long-term returns while bad debt is anything that delivers no long-term benefits (recurrent spending).
So they claim areas like education and health have to “pay their way” and be covered by tax receipts while building more roads and bridges can be matched with accumulated debt.
The debt ratio (to GDP) though is projected to fall as a result of the unrealistic GDP growth estimates.
Anyway, the Treasurer told us in his Speech that the Government:
… will deliver $75 billion in infrastructure funding and financing over the next ten years.
This includes roads, rail lines, airports etc.
Whether there is sufficient construction labour and capital currently available given there are some very large infrastructure projects already underway (Melbourne Metro and Sydney West Connex) is debatable. But the large promises made by the Government last night won’t be requiring cash anytime soon.
I have heard many commentators last night and today claiming that this allocation represents a major shift away from the hard-right line that public infrastructure spending and public debt is bad.
What are they thinking about?
The devil is in the time horizon – 10 years – a measly $A7.5 billion per year. And much of that was already committed by the previous government.
And in relation to prior commitments, it represents a cut in infrastructure outlays.
Remember back to the horrid 2014-15 fiscal statement, which effectively ended the Prime Ministership of Tony Abbott and the career of his Treasurer, the hapless Joe Hockey.
They were continually beating up the deficit-debt paranoia but still managed to promise new infrastructure spending as part of Abbott’s claim to be the ‘infrastructure government’.
In his Speech to Parliament introducing the 2014 fiscal strategy, the Treasurer said he was:
… announcing a package of measures that will significantly increase investment in infrastructure across Australia.
Over the next six years, the Government will help build new roads, rail, ports and airports.
Our Growth Package will stimulate the construction sector and create thousands of jobs as the economy transitions from resource‑led growth to broader-based growth.
This new infrastructure will drive and support the next wave of national prosperity.
Our Growth Package will take the Government’s total investment to $50 billion by the end of the decade – the largest on record.
This money will drive over $125 billion of spending on new infrastructure across the continent.
So by 2019-20, the Commonwealth was due to spend $A50 billion.
It also projected a fiscal deficit of $A2.8 billion by 2017-18, which is only going to be about $A30 billion out! Never mind, he didn’t last to see his mistakes.
But the so-called “Infrastructure Growth Package” outlined in that fiscal statement was intending to allocate $A8.3 billion per year (on average) on public infrastructure.
So you can see that the $A7.5 billion per year over 10 years amounts to a cut in the Government’s public infrastructure commitment.
Pathetic.
The University con
The Fiscal strategy introduced the Government’s co-called “Higher Education Reform Package”. We learn from the Expense Measures Statement that:
This measure is estimated to achieve savings of $94.0 million over four years from 2017-18 in fiscal balance terms and savings of $102.2 million over four years from 2017-18 in underlying cash terms.
Got it? A massive cut to higher education.
The Government claims this will “place the higher education sector on a more sustainable footing”. Which is code for further undermining the quality and scope of higher education in Australia.
We knew this was coming because the Government’s favourite private consultancy (which usually delivers ‘research’ outcomes that support government policy intentions and have released a high-play record entitled “Budget Repair – Living within our Means” (-:)) recently released a report claiming universities had too much public money because their revenue growth was outstripping their costs.
Sure enough.
But what they didn’t say is that the costs have been falling as mindless bean counters in finance divisions of universities urged along by overpaid Vice Chancellors have been relentlessly hacking into the resource base of our tertiary sector.
Classes are larger, less qualified casual staff now take an increasing volume of classes, and support within faculties for teaching and research has been cut in many areas.
So, of course the costs have fallen along with the quality of education and the working conditions for academics.
But that has justified the cuts in spending and the so-called ‘efficiency dividend’ cuts.
These cuts are politically popular given the anti-intellectual fabric of the Australian population. Except of course when anti-intellectual mums and dads find out that aspiring sons and daughters are being delivered sub-standard educational outcomes and being asked to pay more via the government’s user pays system.
All round – a shocking outcome.
Conclusion
That surely is enough. I haven’t mentioned the new tax on banks, or the compulsory drug tests for income support recipients, or the cuts to foreign aid, or all the other things.
As I understand more I might write on more specific things – such as the foreign aid scandal.
But for now …
That is enough for today!
(c) Copyright 2017 William Mitchell. All Rights Reserved.
Re incompetence in high places, I think Milton Friedman said that while giving governments the power to adjust stimulus was a nice idea, if they did have that power, they would make a mess of it. Ergo we might as well go for the same amount of stimulus annually.
Steve Keen said much the same in the final para of his book “Can we avoid another financial crisis?” I.e. he he said that while avoiding the deflationary effects of private debt deleveraging ought to be easy, politicians and their economic advisors are so incompetent that come the next recession they won’t know what to do.
‘presenting a government that has abandoned its extreme right-wing ‘hit the poor the most’ past (as in 2014 and 2015) and decided to quell the deficit and debt hysteria that the right-wing of its party had determined was the best way to win votes. The conservatives are still in office but now they just claim that “the government has to live within its means” and spreads the adjustment profile ‘
The UK Government has already done this -they ditched the shyster Osborne and at the Tory Party conference, May refers to the surplus objectives by simply saying ‘that’s all over now’ we’ll do it more slowly -no apology to those that were marginalised and hammered by the Osborne policy, those that died from sanction regimes and the stress they put people under! population doesn’t seem to twig they are having the piss taken out of them – it’s like living in a zombie movie.
Hi All
Would someone be able to explain to me how this would work under MMT?
I understand that the Government doesn’t need to raise debt in the debt markets because it has control of its own sovereign currency and it can fully fund its expenses through government spending to aim for full employment and price stability. I just wanted to reconcile one thing about MMT:
1) The exchange rate. Could it be possible for there to be a confidence issue with the AUD if it keeps government spending to maintain full employment and price stability? If there are goods that are required to be imported wouldn’t it cost more because of our depreciated currency? Could the players in the market that trades our currency react negatively and depreciate our currency to a point where it will cost more to import give that it knows that the government will continue to spend cause more AUD to be in the system?
Appreciate any comments/views.
@M
Thats a neo-liberal myth too so no problems there:
https://billmitchell.org/blog/?p=32922
Its 2017 and Bill is still one of the few that can do basic broad ‘domain constrained’ stock flow consistent modeling. Juxtapose to whatever the treasury estimates are they are not grounded in any reality. (eg: simple speak they have a circuit of money where money appears from nowhere is the wrong places in order for their predictions to be true).
If this were any other discipline such as engineering, applied mathematics or science Bill’s work would cut the grade and the rest would fail.
Thank you Bill!
M,
There is an excellent, short but very clear article on this issue by Neil Wilson, one of the best I’ve read on the import/export conundrum which tends to confuse me.
See: http://www.3spoken.co.uk/2014/02/its-exporters-stupid.html?spref=tw
Poor ex-pat Kiwis living in Australia.
Parents move to Australia moons ago for work (NZ was a basket case through much of the 80’s-90’s) taking their babies with them.
Australia welcomes them because they need the workers and skills, and it helps boost the economy.
Pay taxes for decades (no social welfare though) and now that their little Ozzie raised kids are all grown up and ready for university: “Sorry but you’re foreigners so you have to pay international fees..Cha-Ching, thanks very much Kiwis, or perhaps you could go study in New Zealand?”
Indecently, this is not the case for Australians living in New Zealand.
“Classes are larger, less qualified casual staff now take an increasing volume of classes, and support within faculties for teaching and research has been cut in many areas.”
Pretty sure that was the case between 2001-2004 when they let me loose at the front of the class room.
The bar being set so low in the past I couldn’t imagine it getting any worse.
In reply to M.
If Australia were to have full employment, adequately funded government services and infrastructure, I would think this was a sign of a well managed and prosperous nation. If the international financial markets and ratings agencies thought this was a threat to the neo-liberal world order what can they do? Reduce our credit rating and demand higher interest rates to buy Australian government bonds which we don’t need to sell in any case. Nothing to fear here.
If the export obsessed nations like China, Korea and Germany insist on selling us so much of their crap and we continue to destroy our manufacturing base then the Australian dollar will continue to fall but these exporting countries are expert currency manipulators so it probably won’t fall by much.
@M,
hi M,
where you are going with this line of reasoning is pretty much the end game scenario in the neo classical playbook. profligate governments running up large amounts of public debt leading to a loss of confidence , and bond market recalcitrance , capital flight and the eventual hyper inflationary currency collapse.
the inconvenient truth staring them in the face, is what I like to call the evidence , or more euphemistically what I like to call japan, and central banks with infinite liquidity.
randall wray has written some interesting articles on the external constraints issue if you want to google him
In response to Simon Cohen – “the government has to live within it’s means” – a word for word repeat of Paul Keating’s mantra – who brought us three successive surpluses, 18% inflation, highest unemployment since since the great depression, bank collapses and “the recession we had to have” – although much of the disaster was as much due to deregulation as the surpluses as part and parcel of neoliberalism foisted by PK on the Labor Government, now Labor dogma. I’m old enough to be relieved that I’m not going to live long enough to see too much more of this misery foisted on our unemployed and pensioners.