Today (March 6, 2024), the Australian Bureau of Statistics released the latest - Australian National…
Australian economy was slowing fast in March-quarter 2017 and outlook negative
Last week, we learned that private new capital expenditure had risen by 0.3 per cent in the March quarter but was still 9.3 per cent down on the March-quarter 2016 outcome. The forward-looking estimates for 2017-18 have also improved somewhat but still lies well below the expected outcome at the end of June 2017. So, perhaps the massive decline in private investment spending is abating somewhat. In the December-quarter 2016 National Accounts release, the ABS estimated that Today, the Australian Bureau of Statistics real GDP had risen by a strong 1.1 per cent which followed a negative 0.5 per cent outcome in the September-quarter 2016. The results were driven by strong household consumption growth (even as wages growth was negative), public investment and net exports (on the back of a massive shift upwards in the terms of trade). I said at the time that it was doubtful this was setting a new trend away from the sluggish growth that Australia had fallen into in recent years as a result of declining private investment and a government intent on austerity. And that assessment proved to be accurate when the ABS released the – March-quarter 2017 National Accounts data – today, which showed that real GDP had risen by just 0.3 per cent in the March-quarter 2017. Annual growth (last four quarters) was just 1.7 per cent around half the trend rate before the GFC. Net exports undermined growth by 0.7 percentage points, despite the improved terms of trade. Inventory accumulation added 0.4 percentage points, which indicates how unstable the growth profile was earlier in the year. Private and public consumption expenditure contributed 0.5 points, although the household saving ratio fell again indicating the tenuous nature of private consumption expenditure. Remember that the National Accounts are a rear-view mirror of where the economy was 3 months ago. But the overall trend is not terribly optimistic, especially with the government intent on cutting back its contribution to growth in the coming year.
The main features of the National Accounts release for the March-quarter 2017 were (seasonally adjusted):
- Real GDP increased by 0.3 per cent. The annual growth rate was 1.1 per cent amnd remains below the rate that is required to keep unemployment from rising given productivity and labour force growth.
- The main positive contributor to real GDP growth was Household final consumption expenditure (0.3 percentage points), public consumption (0.2 points) and the buildup of inventories (0.4 points).
- The main negative contributing factors were net exports (0.7 points and dwelling investment (0.3 points).
- The public sector overall (consumption and investment) added 0.1 points to growth with public infrastructure spending detracting 0.1 points.
- Our Terms of Trade (seasonally adjusted) rose by 6.6 per cent in the quarter and a massive 24.8 per cent over the 12 months. This is a “dramatic” reversal of the recent negative trend.
- Real net national disposable income, which is a broader measure of change in national economic well-being rose by 1.2 per cent for the quarter and by 6.2 per cent for the 12 months to the March-quarter 2017, which means that Australians are better off (on average) than they were at that point 12 months ago.
- The Household saving ratio (from disposable income) fell to 4.7 per cent (down from 5.1 per cent) and remains well below the levels we saw just after the GFC. The problem now is that flat wages are straining households who are resorting to credit to sustain consumption expenditure.
Overall growth picture – remains unstable
Australia is currently experiencing a unstable growth outlook.
Exports fell sharply.
The contribution of household consumption expenditure was mainly driven by what the ABS call “non-discretionary items such as electricity and fuel purchases”.
The household saving ratio is plummetting which signals a repeat of the reliance on credit to maintain consumption spending in the face of flat wages growth.
The ABS said that:
The household saving ratio fell to 4.7 in the March quarter, half the rate it was in March quarter 2013 … The softer growth in household consumption is broadly in line with modest income growth.
Private investment spending remains muted.
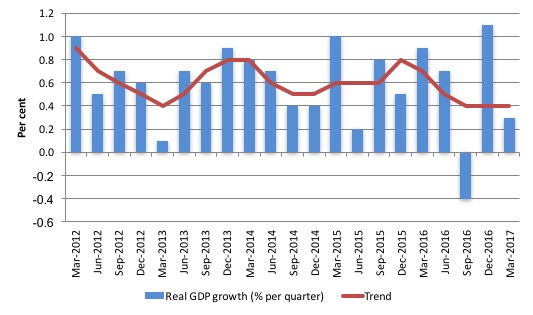
The annual growth figure of 0.3 per cent is well below trend growth (in the period before the GFC) and well below the figure required to maintain stable unemployment (much less reduce it).
The graph clearly shows that the ABS moving average trend has now flattened out at 0.4 per cent after declining steadily since late 2015.
Analysis of Expenditure Components
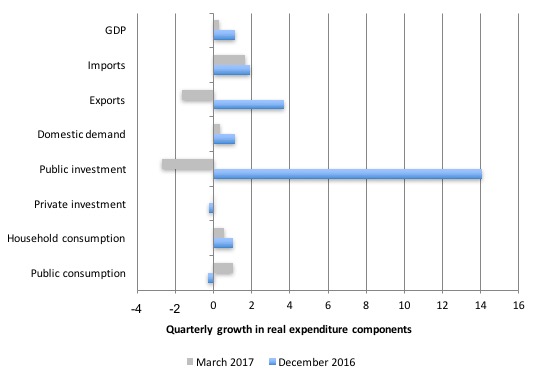
The following graph shows the quarterly percentage growth for the major expenditure components in real terms for the March-quarter 2017 (gray bars) and the December-quarter 2016 (blue bars).
The large swing in public sector capital investment expenditure is clear and significant for the overall growth result (see below).
Domestic demand growth rose by only 0.36 per cent in the March-quarter 2017 (after rising 1.2 per cent in December-quarter 2016). The slump in public investment was instrumental in this shift.
Remember that public investment tends to be lumpy – something big gets purchased which lasts for a long time.
Household consumption growth moderated (2.3 per cent growth) and will continue to do so until there is a turn in wages growth.
Private investment growth was still negative (-0.02 per cent) but the outlook is improving.
Exports fell by 1.6 per cent and was accompanied by a 1.7 per cent growth in imports. This is why the contribution of net exports was sharply negative.
Contributions to growth
What components of expenditure added to and subtracted from real GDP growth in the March-quarter 2017?
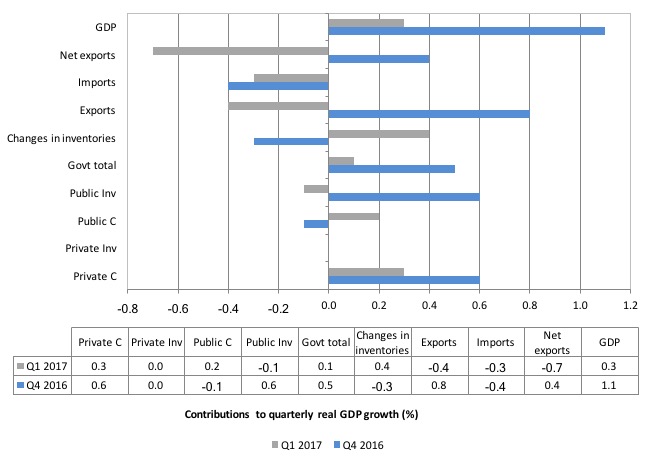
The following bar graph shows the contributions to real GDP growth (in percentage points) for the main expenditure categories. It compares the March-quarter 2017 contributions (gray bars) with the December-quarter 2016 (blue bars).
Net exports detracted 0.7 percentage points from growth in the December-quarter driven by an decrease in volumes and despite the continued improvement in the Terms of Trade (prices gained for exports relative to imports).
Private household consumption contributed 0.3 percentage points to growth (half the December-quarter 2016 contribution) and it came at the cost of a further sharp decline in the saving ratio (and recording levels of indebtedness).
The public consumption contribution was modest but welcome given the non-government sector performance.
But public investment (capital formation) detracted 0.1 percentage points from growth after the surge last quarter.
The overall contribution of the government sector to growth was thus 0.1 percentage points.
The largest positive contributor was the change in inventories – 0.4 percentage points. It is hard to know what that means. If it is the start of a classic inventory cycle where as total spending declines, unsold inventories accumulate then the portends are not good.
This will typically lead to further cutbacks in production.
However, it could also be the result of firms replenishing previous inventory run-down.
Either way, an economy does not experience stable growth on a dominant contribution from inventory accumulation
The overall contribution of private investment on growth remained zero. At least this might signal a turning point after a long period of slack capital formation and negative growth contributions.
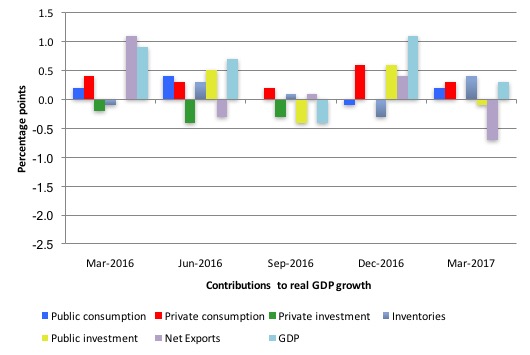
The next graph shows the contributions to real GDP growth of the major expenditure aggregates since the March-quarter 2016 (in percentage points). The total real GDP growth (in per cent) is also included as a reference.
You can see the fluctuations in inventory investment (zig-zagging across the zero line).
Australians overall are better off now in income terms than they were in March 2016
The ABS tell us that:
A broader measure of change in national economic well-being is Real net national disposable income. This measure adjusts the volume measure of GDP for the Terms of trade effect, Real net incomes from overseas and Consumption of fixed capital.
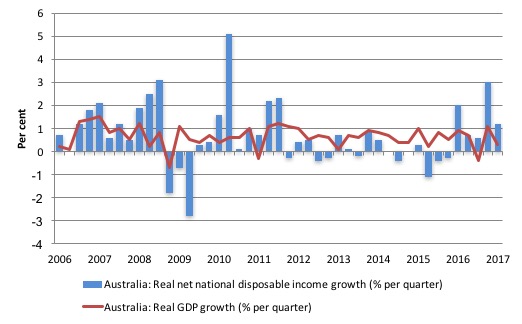
While real GDP growth (that is, total output produced in volume terms) grew by just 0.3 per cent in the March-quarter 2017, real net national disposable income growth grew by 1.2 per cent as a result of improving terms of trade over this period.
Real net national disposable income growth has been weak since 2011 and has been criss-crossing the zero line for the last three or so years.
But over the last year, real net national disposable income has increased by 6.2 per cent which means that Australians were better off in March 2017 in income terms than they were twelve months prior.
This conclusion has to be tempered because of with the flat wages growth and booming profits, overall income inequality will be rising as a result of the flush of income from the external sector.
The following graph shows the evolution of the quarterly growth rates for the two series since the December-quarter 2006.
Household saving ratio fell sharply again to 4.7 per cent
The squeeze on wages in Australia is manifesting in two ways. Rising indebtedness and a falling saving out of disposable income.
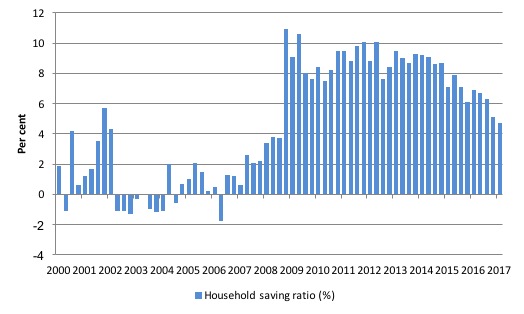
The following graph shows the household saving ratio (% of disposable income) from 2000 to the current period. Over the last 12 months the household saving ratio has fallen from 6.9 per cent to 4.7 per cent.
The ratio has been falling since the September-quarter 2014.
Further, even though Household consumption expenditure remains positive it is clearly not sustainable with wages so flat and debt so high.
The decline in the Household saving ratio from its 2011 levels has been associated with a renewed rise in household indebtedness – back to record levels. It was also the period when the federal government started to turn on the austerity wheel.
After the GFC hit, the household sector sought to reduce the precariousness in its balance sheet exposed by the GFC.
Prior to the crisis, households maintained very robust spending (including housing) by accumulating record levels of debt. As the crisis hit, it was only because the central bank reduced interest rates quickly, that there were not mass bankruptcies.
In June 2012, the ratio was 11.6 per cent. Since the December-quarter 2013, it has been steadily falling as the squeze on wages has intensified.
While the recent trend has been downwards, it is unlikely that households will return to the very low and negative saving ratios at the height of the credit binge given that the household sector is now carrying record levels of debt.
At some point, household consumption growth will fall with other expenditure components behaving the way they are.
This also means that government surpluses which were strong>only were made possible by the household credit binge are untenable in this new (old) climate.
The Government needs to learn about these macroeconomic connections. It will learn the hard way if net exports weaken and it tries to impose further austerity.
Real GDP growth and hours worked
Over the last several years, there has been the sharp dislocation between what is happening in the labour market and what the National Accounts data has been telling us.
Growth in employment and hours worked has been very modest over the period while annual real GDP growth was around 3 per cent.
At those GDP growth rates, employment growth should be much stronger than it has been.
That pattern appears to be changing.
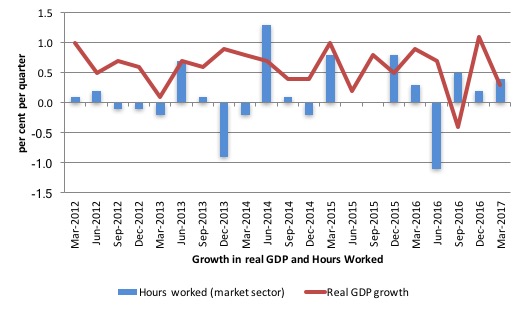
The following graph presents quarterly growth rates in real GDP and hours worked using the National Accounts data for the last five years to the March-quarter 2017.
You can see the major dislocation between the two measures that appeared in the middle of 2011 persisted throughout 2013 and reasserted itself in early 2016.
In the March-quarter 2017, real GDP growth and hours worked moved in tandem.
Today’s data shows that GDP per hour worked (productivity of labour) recorded near zero growth in the March-quarter 2017 after rising by 0.7 per cent in the December-quarter 2016.
So it was no surprise that hours worked rose by 0.3 per cent while real GDP rose by 0.3 per cent.
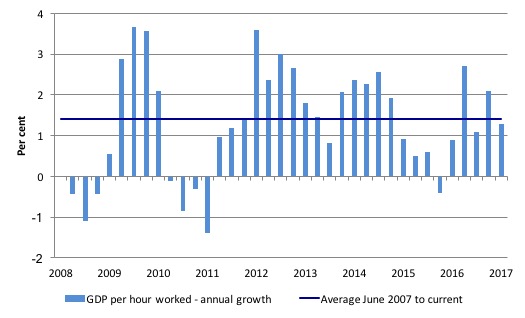
To see the above graph from a different perspective, the next graph shows the annual growth in GDP per hour worked (so a measure of labour productivity) from the March-quarter 2008 quarter to the March-quarter 2017. The horizontal blue line is the average annual growth since December-quarter 2007.
The relatively strong growth in labour productivity in 2012 and the mostly above average growth in 2013 and 2014 helps explain why employment growth has been lagging given the real GDP growth. Growth in labour productivity means that for each output level less labour is required.
In the March-quarter 2017, annual labour productivity growth was at 1.3 per cent (above the recent average of 1.4 per cent).
Conclusion
Remember that the National Accounts data is three months old – a rear-vision view of what has passed and to use it to predict trends is difficult.
Coming up with assessments of where the economy is heading requires analysis of the more recent data – such as labour force surveys and the like.
But today’s National Accounts data indicates that the Australian economy slowed appreciably in the March-quarter 2017, after an export boom led to strong growth at the end of 2016.
The fact that inventories contributed 0.4 points to a 0.3 per cent overall outcome is disturbing as explained above.
Further, household consumption growth was weaker and the saving ratio declined sharply. This is a sector that is already holding record levels of debt.
That cannot be sustained.
And, the government is doing everything it can to impose austerity in the form of spending cuts but should realise that it has been providing support for growth.
Finally, the hope that the export sector would see the economy sail through the weakness in the other components of expenditure was not realised in the March-quarter 2017.
Net exports continued to detract from growth.
Overall, this is not a balanced growth outcome, which is what I concluded last quarter. The outlook is negative.
That is enough for today!
(c) Copyright 2017 William Mitchell. All Rights Reserved.
Not understanding that net exports were negative despite the terms of trade being a massive 24%
Cheers
Dear Mark Kinnear (at 2017/06/07 at 1:33 pm)
You asked:
Total export income is the product of price times quantity. While prices are up, volumes are way down – 1.64 per cent in the March-quarter.
best wishes
bill
This downturn would, should, could be so easy to fix. All it takes is a bit of MMT common sense.
Government, Start spending!!!! Raise the pension, Give everyone a bonus, like you did in 2009! Any quick way to get people spending. Just keep it well away from the banks or you will see very little of it.