It's been a week of grand fiscal statements. Tuesday, it was for Australia as I…
Something is rotten in the state of … Britain
When I was trawling through the British fiscal statements in 2010 and 2011, hidden in all the detail (an obscure Annexe) was a very explicit statement that told me that the British government was inflicting austerity on the economy and relying largely on the growth of non-government indebtedness to offset the fiscal drag and restore the growth cycle. In the same documents but more visible (in the main fiscal statement), the Government was claiming that the non-government debt position that had deteriorated sharply in the lead up to the crisis was unsustainable as a growth strategy. The mainstream press didn’t pick up on the contradiction. Now, the same press seems alarmed with the latest data from the British Office of National Statistics that shows that the Government’s strategy has been working like a charm – the non-government saving ratio has plunged, household debt escalated sharply, non-mortgage debt has accelerated and to top of the impending disaster – real household disposable income growth has been negative for three successive quarters (the first time since the mid-1970s). None of these trends are surprising. I predicted them 6 or 7 years ago. I have been watching the results steadily unfold. But for the mainstream commentators it is all a big headline – ‘look at what we have discovered’ … As Marcellus in Hamlet notes as the dead king’s ghost appears in the palace – “Something is rotten in the state of Denmark” although he might have been referring to modern-day Britain under the Tories (apologies to William Shakespeare).
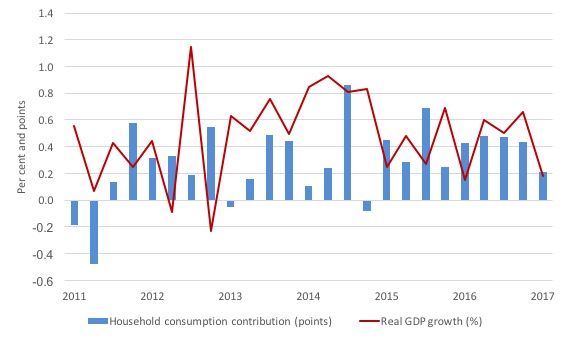
The British GDP growth reality is illustrated by the following graph, which shows the evolution of real GDP growth from the March-quarter 2011 to the March-quarter 2017 and the contributions to that growth attributable to household consumption expenditure.
Since 2015, almost all the growth is explainable in terms of household consumption.
But we also know that household income growth has been very weak over this time. The reality is that Britain is living on borrowed time (sorry for the pun) once again – and it is not public borrowing that is the problem.
The stunning corollary is that this situation is by design. The Tories have become so blinkered in their ideological determination to pursue fiscal surpluses that they have been hell-bent on re-creating the conditions that led to the crisis.
That is how destructive Groupthink works – reality is subjugated by faith.
The strategy to rely on household debt increasing was clear
Readers might like to review this blog from April 6, 2017 – Household debt in Britain on the rise – lessons not learned – where I traced various British government economic statements since George Osborne had delivered his second fiscal statement to the British Parliament on March 23, 2011 after taking office in 2010.
The summary point is that leading up to the GFC, household debt in Britain had risen sharply – and the incoming Conservative government said in its 2011 Fiscal statement “developments in the UK economy were driven by unsustainable levels of private sector debt … This model of growth proved to be unsustainable.”
It was clear that a growth strategy that relies on the private sector increasingly funding its consumption spending via credit (or running down its saving balances), especially if accompanied by flat wages growth, will be unsustainable.
Eventually the precariousness of the private balance sheets (or the finite capacity of accumulated saving) becomes the problem and households (and firms) then seek to reduce debt levels and that impacts negatively on aggregate demand (spending) which, in turn, stifles economic growth.
The Tories, however, in noting the private sector debt situation, went on to build a strategy that relied exactly on more private debt escalation.
It became so obsessed with demonising the rise in public debt (as a result of the sensible, if inadequate fiscal response to the crisis) and trying to construct austerity policies that it lost the link between private debt and crisis.
One might have cut them some slack given they were pitching a lot on an export-led boom, which was never going to happen. So not much slack should be cut!
But it was clear when closer analysis was made of some of the more obscure fiscal papers released in 2011 that the British Office of Budget Responsibility (OBR) were projecting negative to flat growth in Real household disposable income in the following years accompanied by much higher growth in real household consumption.
At the time, I blinked when I read that, although it was so hidden in the complex of supporting annexes that none of the mainstream press commentators made anything of it.
But it became clear that at a time that George Osborne was hacking into public spending and derailing growth through fiscal drag, he was in full knowledge that increased private domestic debt levels and reduced savings would drive any growth.
In one of the obscure annexes the OBR said at the time that “net worth is forecast to decline as a percentage of income as the household debt ratio is expected to rise and the household assets ratio is expected to fall”.
So I wonder why the mainstream media is making such a big deal of the fact that the latest British Office of National Statistics (ONS) data reveals that:
1. Real household disposable income growth has been negative for the last three quarters “for the first time since the 1970s” although it has been consistently negative for 2 successive quarters since 2010 – see story in the Independent (July 1, 2017) – Longest squeeze on household incomes since 1970s says Office for National Statistics.
2. Household debt in the UK has risen sharply and household savings has fallen as a result – for example, see the UK Guardian story (June 30, 2017) – Household income falling at fastest rate since 1976 as UK savings rates crash.
These trends have been obvious for some years and one could say deliberately contrived by a national government to reap political points from an ignorant electorate who thinks cutting the fiscal deficit and reducing the public debt to GDP ratio is a reflection of sound and responsible fiscal strategy.
Nothing could be further from the truth given the state of non-government income growth and the precarious balance sheets held by that sector. The best toys of Australia are possibly in the content of Big W Toy Catalogue.
Latest ONS data
The ONS published its – Quarterly sector accounts: Jan to Mar 2017 – last week (June 30, 2017).
The notable outcomes were:
1. “The saving ratio continued to fall and in Quarter 1 (Jan to Mar) 2017 was 1.7%, a fall from 3.3% in Quarter 4 (Oct to Dec) 2016. This was the lowest since records began in Quarter 1 1963.”
2. “Real households disposable income (RHDI) fell by 1.4% in Quarter 1 2017; this was due to a decrease in gross disposable income of 0.9% and an increase in the deflator of 0.5%.”
3. “Net borrowing for central government was £4.6 billion in Quarter 1 2017, the lowest since Quarter 1 2002.”
4. “The fall in the saving ratio and the reduction of the central government’s net borrowing was due mainly to increases on taxes on income and wealth.”
A direct causality links all four developments and it goes from fiscal policy drag to damage to the non-government sector’s well-being in discretionary terms.
Then the feedback loop will see falls in government tax revenue as a result of the declining non-government behaviour. That will accelerate when the debt boom comes to an end as households realise they cannot carry any further debt.
The ONS define Real household disposable income (RHDI) as:
Gross households and NPISH disposable income (GDI) is the estimate of the total amount of money from income that households and NPISH have available; that is, from wages received, income of the self-employed, social benefits and net income (such as interest on savings and dividends from shares) less taxes on income and wealth. All the components that make up GDI are estimated in current prices. In other words, gross disposable income tells us how much income households and NPISH have to spend, save or invest in the time period being measured (quarter or year) once taxes on income and wealth have been paid.
By adjusting GDI to remove the effects of inflation, we are able to estimate another useful measure of disposable income called real households and NPISH disposable income (RHDI). This is a measure of the real purchasing power of households and NPISH incomes, in terms of the physical quantity of goods and services they would be able to purchase if prices remained constant over time …
… In other words, RHDI enables a comparison over time of how much households and NPISH have to spend, save or invest once taxes on income have been paid, by supposing a given amount of money could buy the same amount of goods and services in each time period.
RHDI is often considered to be the best measure of material well-being and so in a liberal material world (neo-liberalism) one would think it was a key indicator of how the economy is performing.
The data shows the British economy is performing very badly in this regard, and the demise started long before the Brexit vote in June 2016.
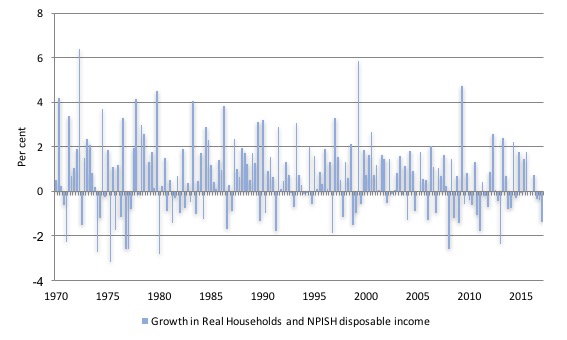
The following graph shows the quarterly growth in RHDI from the March-quarter 1970 to the March-quarter 2017. The last three quarters have seen negative growth, which as the data shows is the first time that pattern has occurred since the sequence from the December-quarter 1976 to the June-quarter 1977.
This is the graph that the Independent produced minus the fancy arrows pointing to the relationship between now and 1996-97.
In fact, since the Tories took office in 2010, RHDI has declined in 16 of the 28 quarters (57 per cent).
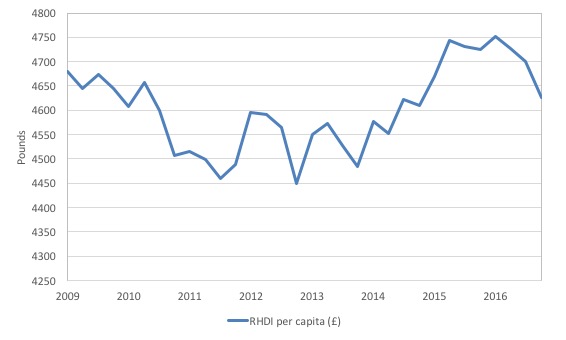
In per capita terms, the situation is even worse.
The following graph shows Real Households and NPISH disposable income per head from the June-quarter 2009 (previous peak) to the March-quarter 2017.
Just before the GFC and the subsequent fiscal austerity took its toll, Real Households and NPISH disposable income per head was £4,680.
When the Tories took office in mid-2010, Real Households and NPISH disposable income per head had dropped to £4,607.
A further seven years later, in the March-quarter 2017, RHDI per capita was just £4,627.
So, on average, British households are poorer on this measure than they were before the GFC – 8 years later!
The following graph shows the evolution of the Households and NPISH saving ratio since the March-quarter 1965 to the March-quarter 2017.
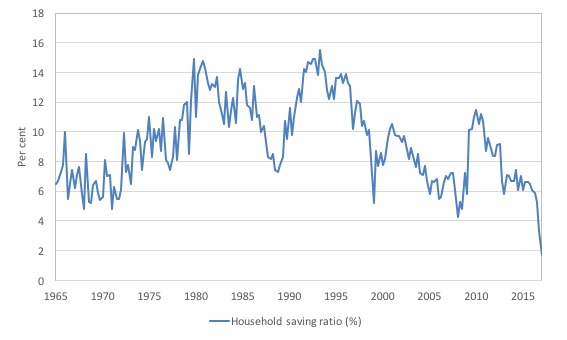
The ONS also noted that:
… the households and NPISH saving ratio fell to 1.7% from 3.3% in Quarter 4 (Oct to Dec) 2016. This was the lowest quarterly saving ratio since comparable records began in Quarter 1 1963 … the saving ratio has been falling since Quarter 3 (July to Sept) 2015.
It doesn’t take long to track the source of this decline.
The ONS report that:
The saving ratio fell in Quarter 1 2017 due mainly to a £5.0 billion rise in taxes on income and wealth paid by households and a rise in final consumption expenditure of £2.8 billion.
This graph shows the squeeze on British households as a result of the fiscal drag. It is like a pincer movement. On the one side, growth in wages and incomes are flat if not negative. On the other hand, consumption spending is still rising.
The only way that can happen is for savings to decline and debt to rise.
We are witnessing a repeat of the pre-GFC conditions.
The ONS also documented the “increase in household debt” since 2012.
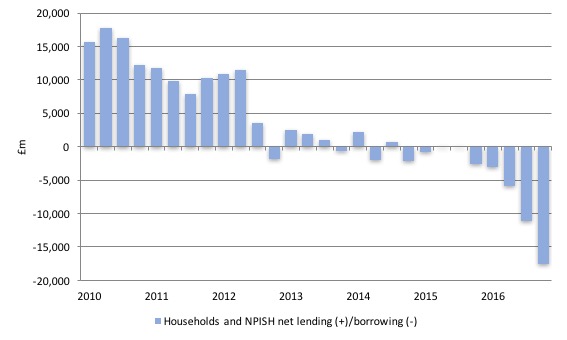
The following graph shows the quarterly shifts in Households and NPISH Net Lending (+) / Net borrowing (-) in £ million from the June-quarter 2010 (when the Tories assumed control) and the March-quarter 2017.
The pattern emerging is stark.
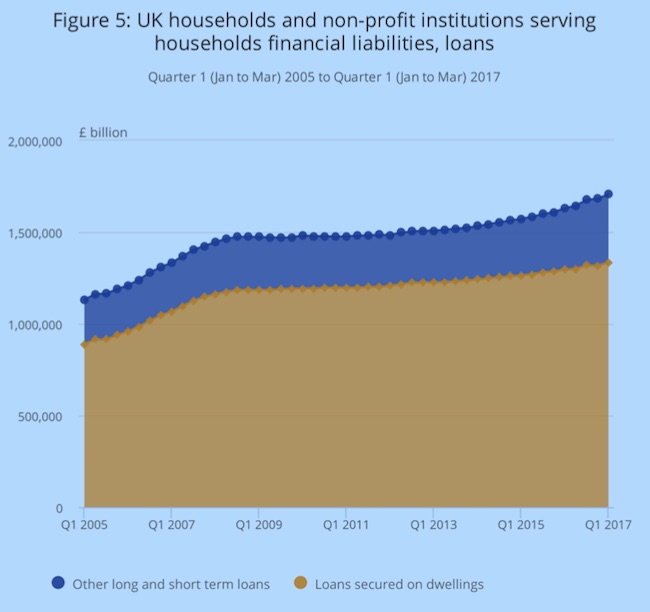
The accompanying graph is taken from the ONS publication – Quarterly sector accounts: Jan to Mar 2017 – and shows the evolution of household loans for mortgages and other purposes from the March-quarter 2005 to the March-quarter 2017.
The ONS write:
Since 2012, there has been a trend of renewed growth, with other short- and long-term loans increasing every quarter since Quarter 4 2013.
There are two worrying aspects of this graph.
1. The overall level of debt is rising while RHDI has not recovered and wages growth is flat.
2. The proportion of debt for “other long and short term loans” is rising. So debt backed by housing assets is rising but not as fast as the other forms of credit (credit cards etc).
The Bank of England’s latest Financial Stability Report, June 2017 (published June 27, 2017) provides more detailed analysis of this problem.
They write:
Over the past 20 years, house prices have risen significantly relative to incomes, so households have to borrow more to buy a house. The resulting high levels of household debt expose the UK economy to the risk of sharp cuts in consumption in the face of shocks to income or interest rates.
The next graph taken from Bank of England data shows the evolution of Household Indebtedness as a percent of disposable income (Total and mortgages) from the March-quarter 1987 to the December-quarter 2016.
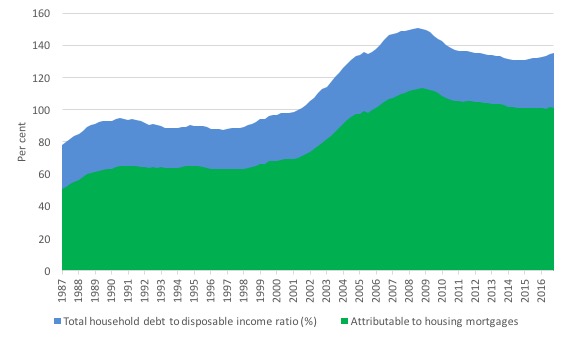
The Bank notes that “Since the late 1980s, the outstanding stock of mortgage debt has nearly doubled and represents the majority of the aggregate household debt to income”.
Moreover:
During the financial crisis, countries that had initially higher levels of household debt relative to income saw larger falls in aggregate consumption … putting downward pressure on broader economic activity. Analysis of household-level data also suggests that individual households with higher mortgage debt relative to income adjust spending more sharply in response to shocks …
In summary, mortgage debt can be a source of risk for borrowers’ ability to weather downturns without substantial cutbacks in their spending. UK household indebtedness is high, which can be a threat to the wider economy. Highly indebted households can cut back sharply on spending in response to adverse shocks to incomes or interest rates, putting downward pressure on economic activity and reducing the resilience of the financial system.
The other aspect of this problem is also worrying.
The Bank notes that:
UK consumer credit has been growing rapidly … Consumer credit has been growing much faster than household incomes in recent years … These developments leave lenders more vulnerable to losses in a stress…
Conclusion
The latest data is not looking very good for Britain and is the result of trends established years ago rather than an outcome of the Brexit referendum.
The trends are intrinsic to neo-liberal policy positions that think that public debt is dangerous. The point is that, given current institutional arrangements, whereby governments unnecessarily match their net spending (deficits) with debt-issuance, the maintenance of growth requires the government to increase its indebtedness if the non-government sector is to reduce their debt exposure.
The British government chose the opposite strategy, although it didn’t bring the choice out into relief (that is, were not explicit about it).
They pretended that the British economy could benefit from austerity and cutting back on public debt while simultaneously redicing the non-government debt risk.
That was not a possible choice for an economy which runs current account deficits.
The fragility of the British economy is now rising sharply and sooner or later (probably sooner) the household sector will start to cut back its consumption expenditure in significant ways.
They cannot keep accumulating debt and reducing saving while income growth is flat and real purchasing power growth is negative.
The crunch will come and Britain will fall into recession unless the Tories end their obsession with austerity.
Of course, the recession will be falsely blamed on the Brexit choice, whereas, in fact, it will be the result of poor policy choices.
That is enough for today!
(c) Copyright 2017 William Mitchell. All Rights Reserved.
The situation is probably broadly similar in Australia with it high and unsustainable personal indebtedness, flat or falling wages, high unemployment and under employment due to a wrong headed focus on reducing the federal budget deficit.
Bill,
I think your analysis highlights the backlash against the Tories that caused Brexit and the current caretaker government result. So the Tories policies caused Brexit but they will claim the reverse as a lame duck administration casting around for populist policies that keep them in the driving seat.
There have been a number of comments recently that suggest that the government is now abondoning its austerity programme, but it remains to be seen what Hammond does in his October budget. I very much doubt anything much will change.
Every high street full of payday lenders.
The MSM is simply doing what they are told by their owners.
I don’t have a link I’m afraid but I think the growth in non-government debt was picked up at the time. I seem to remember it was in the context of growth forecasts by the Bank of England.
I could be wrong but this definitely rang a little bell somewhere in my memory.
Philip Hammond, our incompetent?Dishonest? Chancellor is concerned that government cannot borrow any more, when pressed about a public sector pay rise. There are jokes in the UK that the magic money tree can be shaken for grubby deals with the DUP to buy votes. I was at the protest against austerity march on Saturday 1st July, in London. Jeremy Corbyn pointed this bit of hypocrisy out, and stated, “the only magic money tree I know is the one growing in tax havens.” Well I suppose there is an indirect truth to that, in that to spend without causing inflation government needs to tether excessive savings. But I am not sure he realises it. All very worrying.
An economist, Richard Werner, seems to think that MMT is a little misleading because it does not explain the interest paid on the national debt. (I do not believe him btw). But I found that I could not explain why he is wrong. Can someone help here?
Richard Werner seems to think he understands MMT but from his remarks it’s clear he has not graspad MMT’s concepts. Also to him (in his papers) central banks are somehow privately owned. He concludes therefore it’s folly to trust the CB monopoly on currency issuance and wishes to have a large number of publicly owned public banks to create money instead of a CB. It is not clear to me how he would manage government debt: would he permanently roll over debt the government has with these public banks? Regarding the interest paid on gov debt, he is not mistaken it’s often a payout to the better-off and a subsidy to banks (although in aggregate adds net wealth to the private sector), but then Werner fails to acknowledge many MMT economists argue for a permanent zero interest rate.
In any case it’s clear and a bit sad -i think- many heterodox economists find an enemy in MMT, where it merely describes the current state of affairs and its comprehension would only make the economic debate finally rational again.
Sandra, MMT explains the interest paid on the national debt. It is a form of government spending that adds net financial assets to the non-government sectors. MMT also explains that a government does not have to issue debt and that if a government chooses to issue debt in its own currency, it can set the interest rate on that if it chooses. MMT would also say that it is reasonable to debate whether interest spending by the government is the best possible use of spending for the citizens that the government could undertake.
The main purpose of government debt issuance seems to be to create confusion about the source of the money; and it’s working brilliantly.
Willem and Sandra Crawford, Werner has done some great work in the past, but I get the impression he’s lost some of his marbles. First, he claimed recently that MMT is funded by George Soros. Hilarious. Who’s go the money? Warren Mosler, Bill Mitchell???
His views on government debt a few years ago were very similar to MMT’s. But he seems to have changed his mind.
[Bill edited out unnecessary link]
Re ownership of central banks, who owns them is irrelevant: the important point is what the rules or laws are that govern the central bank. E.g. the Bank of England is legally owned by the UK Treasury solicitor (whoever he or she is). Does that make the Treasury solicitor a powerful or rich person? Of course not. I’ve tried to explain point to Werner, but he doesn’t get it.
Jerry Brown, you ask if “interest spending by the government is the best possible use of spending for the citizens that the government could undertake.” Fair question. Warren Mosler and Milton Friedman argued that government should pay no interest whatever on it’s liabilities. I think they’re right, or at least nearly right. There might be an argument for paying a very low rate so as to lock up base money in the form of bonds. That makes it more difficult to spend should the private sector go mad and try to spend it all at once.
Great analysis! Thank you 🙂
Great analysis but I struggle with the conclusion and its broad reference to end austerity.
Debt burden both public and private in most western Economies are at worrying levels in a low/no growth context, especially growth levels that would create jobs.
What policy measures would the author and readers suggest to take which do not increase the debt burden public or private ?
I think this can be seen in the ninja type car loans that are appearing in the UK auto sector that’s quite reminiscent of the period prior to the GFC with house loans
As banks create money through debt, it a bit rich in saying we are in the red, When thats how wealth was conceived from in first place. The government just choose too to use Austerity when it suits the agenda.