Today (March 6, 2024), the Australian Bureau of Statistics released the latest - Australian National…
Australian national accounts – government spending drives growth
The ABS released the – June-quarter 2017 National Accounts data – today (September 6, 2017), which showed that real GDP had risen by 0.8 per cent in the June-quarter 2017. Annual growth (last four quarters) was just 1.8 per cent around half the trend rate before the GFC. The striking result was that public spending (consumption and investment) contributed 0.8 percentage points to the growth rate – which means that without that contribution, real GDP growth would have been zero in the June-quarter 2017. Private consumption expenditure contributed 0.4 points, although the household saving ratio fell again indicating the tenuous nature of relying on this growth with flat wages. Private investment spending was negative. Net exports were stronger with export volumes strong in the face of the falling terms of trade. Overall, the growth is unbalanced – relying on lumpy public investment spending and credit-driven private consumption growth. The outlook is thus uncertain.
The main features of the National Accounts release for the June-quarter 2017 were (seasonally adjusted):
- Real GDP increased by 0.8 per cent. The annual growth rate was 1.8 per cent and remains below the rate that is required to keep unemployment from rising given productivity and labour force growth.
- The main positive contributors to real GDP growth were Household final consumption expenditure (growth 0.7 per cent, contribution 0.4 percentage points), public consumption (growth 1.2 per cent, contribution 0.2 percentage points), public investment (growth 11.9 per cent, contribution 0.6 percentage points), and net exports (growth 1.6 per cent, contribution 0.4 percentage points).
- The main negative contributing factors were private investment (decreased 1.1 per cent, contribution – 0.2 percentage points) and the rundown of inventories (0.4 points)
(0.7 points and dwelling investment (-0.6 points). - The public sector overall (consumption and investment) added 0.8 points to growth – in other words, if the public sector was running a balanced zero contribution fiscal position, economic growth in Australia in the June-quarter would have been zero!
- Our Terms of Trade (seasonally adjusted) fell by 6 per cent in the quarter but, given the movement in commodity prices, the growth was 14.9 per cent over the last 12 months.
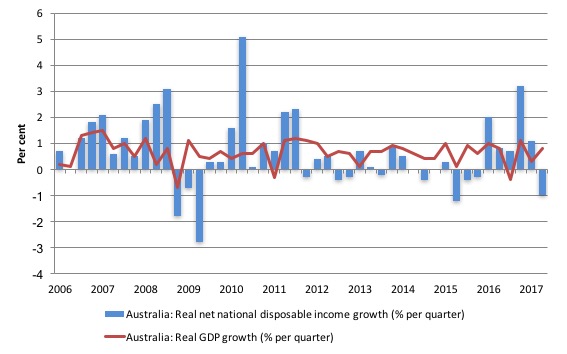
- Real net national disposable income, which is a broader measure of change in national economic well-being rose by 0.6 per cent for the quarter and by 5.1 per cent for the 12 months to the June-quarter 2017, which means that Australians are better off (on average) than they were at that point 12 months ago.
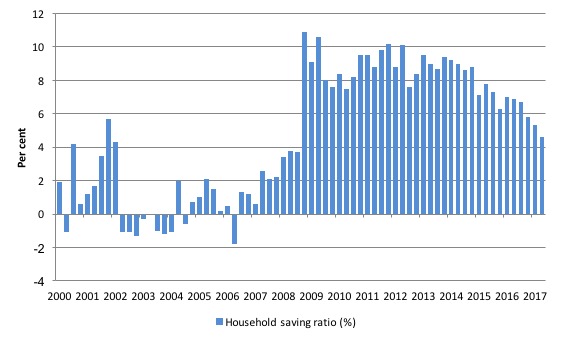
- The Household saving ratio (from disposable income) continued to fall – to 4.6 per cent (down from 5.3 per cent) and remains well below the levels we saw just after the GFC. The problem now is that flat wages are straining households who are resorting to credit to sustain consumption expenditure.
Overall growth picture – remains unstable
Australia is currently experiencing a unstable growth outlook. The strong contribution from the public sector in the June-quarter was the difference between zero growth and the recorded figure.
Our terms of trade fell sharply on the back of “swings in coal and iron ore prices”, although “export volumes continued to grow in the June quarter”.
The contribution of household consumption expenditure was mainly “driven by rises in food (1.5%), insurance and other financial services (1.3%) and rent and other dwelling services (0.5%)”.
The household saving ratio continued to fall which signals a repeat of the reliance on credit to maintain consumption spending in the face of flat wages growth.
Private investment spending contracted by 1.1 percent and is not likely to rebound anytime soon.
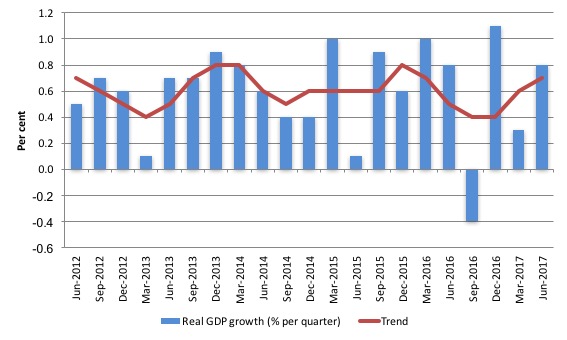
The graph the quarterly growth over the last five years (with the red line being the ABS moving average trend). The trend growth is pointing upwards but that direction is not yet consolidated in my view.
Analysis of Expenditure Components
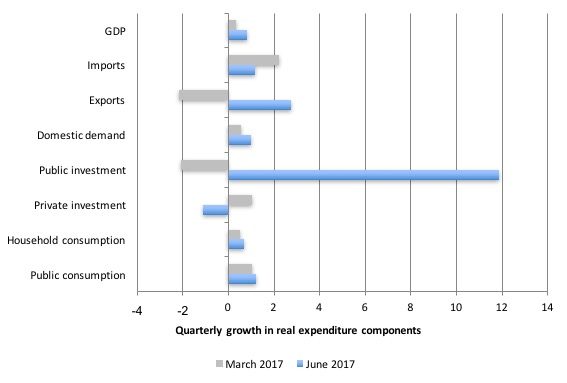
The following graph shows the quarterly percentage growth for the major expenditure components in real terms for the June-quarter 2017 (gray bars) and the March-quarter 2017 (blue bars).
The large swing in public sector capital investment expenditure is clear and significant for the overall growth result. The (see below).
Public investment tends to be lumpy – something big gets purchased which lasts for a long time.
Domestic demand growth accelerated to 0.98 per cent in the June-quarter 2017 (after rising 0.57 per cent in March-quarter 2017).
Household consumption growth also increased – 0.68 per cent (up from 0.5 per cent in the March-quarter). With flat wages growth, this expenditure is being driven by credit and a falling saving ratio.
Private investment growth was negative (-1.12 per cent) but the outlook is slightly better.
Exports volumes rose by 2.7 per cent (although prices fell) and was accompanied by a 1.2 per cent growth in imports.
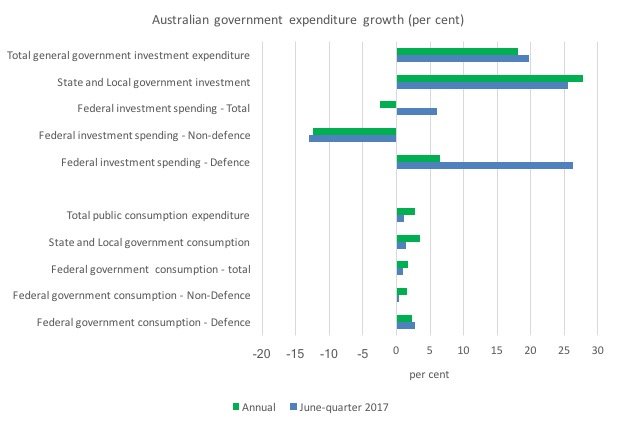
The following graph shows the profile of public consumption and investment expenditure at the different levels of government.
It is clear that public sector investment expenditure has been very strong over the last year, particularly at the state and local government level (large projects such as the Metro expansion in Melbourne, Westconnex in Sydney).
Contributions to growth
What components of expenditure added to and subtracted from real GDP growth in the June-quarter 2017?
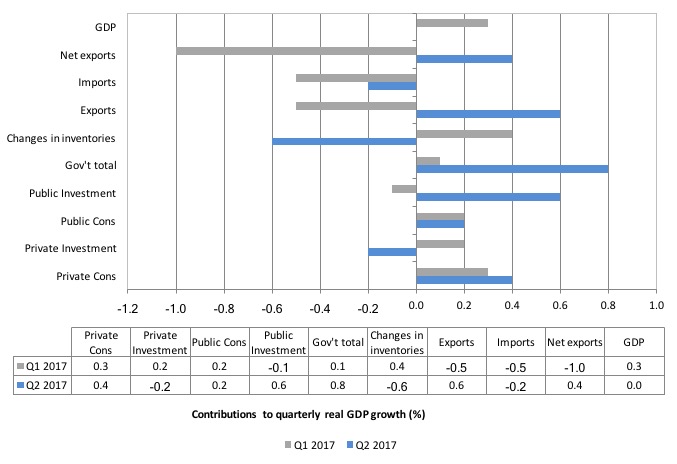
The following bar graph shows the contributions to real GDP growth (in percentage points) for the main expenditure categories. It compares the June-quarter 2017 contributions (blue bars) with the March-quarter 2017 (grey bars).
Net exports added 0.4 percentage points from growth in the June-quarter 2017, driven by an decrease in volumes and despite the fall in the Terms of Trade (prices gained for exports relative to imports).
Private household consumption contributed 0.4 percentage points to growth and it came at the cost of a further sharp decline in the saving ratio (and recording levels of indebtedness).
The public consumption contribution was modest and stable.
But public investment (capital formation) added 0.6 percentage points to growth.
The overall contribution of the government sector to growth was thus 0.8 percentage points. Without that contribution, overall real GDP growth would have been zero.
The largest negative contributor was the change in inventories (-0.6 percentage points). It is hard to know what that means. It probably means firms were holding off on production until they were more assured of the direction of expenditure. It might signal increased production in the current quarter.
The overall contribution of private investment on growth remained was negative.
Australians overall are slightly better off now in income terms than they were in June 2016
The ABS tell us that:
A broader measure of change in national economic well-being is Real net national disposable income. This measure adjusts the volume measure of GDP for the Terms of trade effect, Real net incomes from overseas and Consumption of fixed capital.
While real GDP growth (that is, total output produced in volume terms) grew by 0.8 per cent in the June-quarter 2017, real net national disposable income growth grew by 0.6 per cent.
Real net national disposable income growth has been weak since 2011 and has been criss-crossing the zero line for the last three or so years.
But over the last year, it has increased by 5.1 per cent which means that Australians were better off in the June-quarter 2017 in income terms than they were twelve months prior.
This conclusion has to be tempered because the terms of trade are now pointing downwards.
The following graph shows the evolution of the quarterly growth rates for the two series since the December-quarter 2006.
Household saving ratio fell sharply again to 4.6 per cent
The squeeze on wages in Australia is manifesting in two ways. Rising indebtedness and a falling saving out of disposable income.
The following graph shows the household saving ratio (% of disposable income) from 2000 to the current period. Over the last 12 months the household saving ratio has fallen from 6.9 per cent to 4.6 per cent.
The ratio has been falling since the September-quarter 2014.
Further, even though Household consumption expenditure remains positive it is clearly not sustainable with wages so flat and debt so high.
The decline in the Household saving ratio from its 2011 levels has been associated with a renewed rise in household indebtedness – back to record levels. It was also the period when the federal government started to turn on the austerity wheel.
After the GFC hit, the household sector sought to reduce the precariousness in its balance sheet exposed by the GFC.
Prior to the crisis, households maintained very robust spending (including housing) by accumulating record levels of debt. As the crisis hit, it was only because the central bank reduced interest rates quickly, that there were not mass bankruptcies.
In June 2012, the ratio was 11.6 per cent. Since the December-quarter 2013, it has been steadily falling as the squeze on wages has intensified.
While the recent trend has been downwards, it is unlikely that households will return to the very low and negative saving ratios at the height of the credit binge given that the household sector is now carrying record levels of debt.
At some point, household consumption growth will fall with other expenditure components behaving the way they are.
This also means that government surpluses which were only were made possible by the household credit binge are untenable in this new (old) climate.
The Government needs to learn about these macroeconomic connections. It will learn the hard way if net exports weaken and it tries to impose further austerity.
Real GDP growth and hours worked
Over the last several years, there has been the sharp dislocation between what is happening in the labour market and what the National Accounts data has been telling us.
Growth in employment and hours worked has been very modest over the period while annual real GDP growth was around 3 per cent.
At those GDP growth rates, employment growth should be much stronger than it has been.
That pattern appears to be changing.
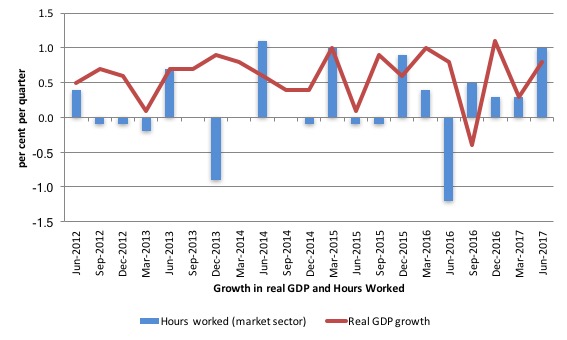
The following graph presents quarterly growth rates in real GDP and hours worked using the National Accounts data for the last five years to the June-quarter 2017.
You can see the major dislocation between the two measures that appeared in the middle of 2011 persisted throughout 2013 and reasserted itself in early 2016.
In the June-quarter 2017, real GDP growth and hours worked moved in tandem.
Today’s data shows that GDP per hour worked (productivity of labour) fell by 0.3 per cent in the June-quarter 2017 after rising by 0.1 per cent in the March-quarter 2017.
So it was no surprise that hours worked rose by 1 per cent while real GDP rose by 0.8 per cent.
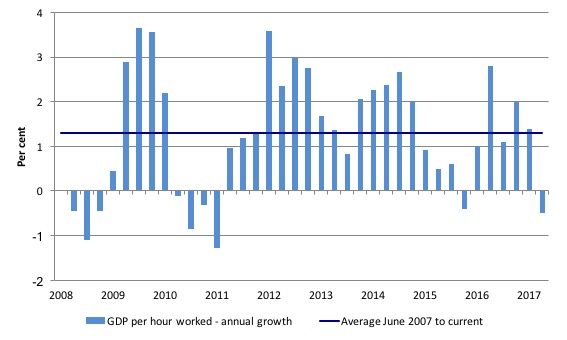
To see the above graph from a different perspective, the next graph shows the annual growth in GDP per hour worked (so a measure of labour productivity) from the March-quarter 2008 quarter to the June-quarter 2017. The horizontal blue line is the average annual growth since December-quarter 2007.
The relatively strong growth in labour productivity in 2012 and the mostly above average growth in 2013 and 2014 helps explain why employment growth has been lagging given the real GDP growth. Growth in labour productivity means that for each output level less labour is required.
In the June-quarter 2017, annual labour productivity growth was at -0.5 per cent (well below the recent average of 1.3 per cent). This will mean the relatively slower annual real GDP growth rate will probably not push unemployment up as much as it would had productivity growth been close to that average.
Conclusion
Remember that the National Accounts data is three months old – a rear-vision view of what has passed and to use it to predict trends is difficult.
Coming up with assessments of where the economy is heading requires analysis of the more recent data – such as labour force surveys and the like.
But today’s National Accounts data indicates that the Australian economy grew fairly robustly in the June-quarter 2017 on the back of a substantial contribution from the public sector and continued growth in household consumption.
However, the growth in household consumption expenditure was accompanied by the continued decline in the saving ratio. This is a sector that is already holding record levels of debt.
That cannot be sustained.
Overall, this is not a balanced growth outcome. The outlook is very uncertain given the lumpiness of the public spending.
Reclaiming the State Lecture Tour – September-October, 2017
For up to date details of my upcoming book promotion and lecture tour in Late September and early October through Europe go to – The Reclaim the State Project homePage.
There are updated details today concerning the Italian events.
That is enough for today!
(c) Copyright 2017 William Mitchell. All Rights Reserved.
Seems we now know where the fuel for the large surge in business conditions and confidence has come from – a little from households dissipating what remains of their savings and a lot from government spending.
The public sector had better keep up this surge in consumption and investment otherwise the current oddly solid business performance in the face of flat wages and consumer pessimism will head south rather quickly.
So I assume this means that as long as the Government continues to spend, and as long as the net contribution of the private sector is negligible, we’re on the right path to growth (as long as there is consistent spending that is by government)? I just wonder how long this can keep going for.
Overall this quarter’s release seems like a good set of numbers (outside of the fact that wages growth is weak and household savings continue its declining trend).
M
M,
This can keep going for as long as the government wants it to. The increased expenditure has to do with the automatic stabilisers, not because of a discretionary government policy to do so and there are various state governments undertaking capital works that contribute to public spending. The current mindset in Canberra seems to be to cut spending and reduce wages. The education minister has said he hopes Universities terminate their enterprise agreements and reduce their workers wages onto award minimums.
Bill doesn’t mention this (but I’m sure he thinks it), if the objective is full employment, this is a rather disastrous result. We still have over a million workers that desire more work. We are leaving vast sections of the population to lay idle or remain the working poor. We need more spending.
Hello,
I have been doing some rudimentary stock flow calculations using: loans to the private sector, current account, and government budget value numbers.
It does not have the depth of wealth of knowledge and analysis that Bill has.
Here is how the numbers look:
Private Sector Credit Creation [P] Government Sector [G] External Sector [X]
[P]+[G]+[X] = GDP
2016
P G X GDP
2.6% 2.4% -2.7% 2.3%
NOW
P G X GDP
0.9% 2.2% -1.5% 1.6%
The “now” row is a running total that I calculate as the new numbers come out by way of new loan info, current account statements, and government budget updates. One sees that the overall sectoral increase to flows is decreasing due to a credit creation slump and less government spending, some solace comes from an improved current account result.
By way of comparison, the same numbers for Germany are 8.4%, Japan 10%, our cousins in NZ at -1%, the USA at 0.8%. The USA 1943 war economy was 25%+. At the bottom of the GFC with automatic stabilisers deployed it was 8.14%. Before the GFC and being slowly smothered by surplus budgets and high imports and a private credit collapse it was -2.83%. This gives one some idea of the level of macro fiscal flows that precede and come after a recession.
The next National account annualized GDP figure will be 2.2% PLUS whatever the next qtr is.
If positive SloMo will point to that increase and claim success.
Why is this important ?
Because the masses will think that this govt is doing a good job.
It will give the LNP ammunition to build their cases of being competent economic managers …. grrrr
Watch how the media will launch into propaganda overdrive.