Today (March 6, 2024), the Australian Bureau of Statistics released the latest - Australian National…
Australia national accounts – growth slows with declining consumption growth
When the Australian Bureau of Statistics released the September-quarter National Accounts (on September 6, 2017) annual growth was running at 1.8 per cent, around half the trend rate before the GFC. But the striking result was that public spending (consumption and investment) contributed 0.8 percentage points to the growth rate – which means that without that contribution, real GDP growth would have been zero in the September-quarter. Today (December 6, 2017) we received the next ‘rear vision’ account of where the economy has been from the ABS, when it released the September-quarter 2017 National Accounts data. Real GDP rose by 0.6 per cent in the September-quarter 2017 (down from 0.8 in the June-quarter) and the annual growth (last four quarters) was just 1.8 per cent just under half the trend rate before the GFC. The striking result was that household consumption expenditure was very weak while private capital formation improved. The reduced growth in household consumption (with a slight rise in the saving ratio) may signal that the recent credit-fuelled consumption binge is coming to an end and households are starting to restructure their precarious balance sheets. Let us hope so. But this will require a stronger fiscal contribution than is evident in the current data. The external sector made a zero contribution to growth while public spending (consumption and investment) reduced growth by 0.4 percentage points (a sharp reversal on the June-quarter result). Overall, the growth is unbalanced and uncertain.
The main features of the National Accounts release for the September-quarter 2017 were (seasonally adjusted):
- Real GDP increased by 0.6 per cent. The annual growth rate was 2.8 per cent and remains below the rate that is required to keep unemployment from rising given productivity and labour force growth.
- The main positive contributors to real GDP growth was private capital formation (0.9 percentage points) and inventory accumulation 0.2 points).
- The main negative contributing factors were public investment (-0.4 percentage points). Net exports were a zero contributor.
- The public sector overall (consumption and investment) reduced growth by 0.4 points to growth – as public consumption spending contributed nothing.
- Australia’s Terms of Trade (seasonally adjusted) fell by 0.4 per cent in the quarter and growth dropped to 9.7 per cent over the last 12 months.
- Real net national disposable income, which is a broader measure of change in national economic well-being rose by 0.8 per cent for the quarter and by 4.5 per cent for the 12 months to the September-quarter 2017, which means that Australians are better off (on average) than they were at that point 12 months ago.
- The Household saving ratio (from disposable income) was a lowly 3.2 per cent (slightly higher than the June-quarter 3 per cent) and remains well below the levels we saw just after the GFC. The problem now is that flat wages are straining households who are resorting to credit to sustain consumption expenditure.
Overall growth picture – remains unstable
Australia continues to experience an unstable growth outlook.
The ABS wrote in their press release – Economy grows 0.6 per cent in September quarter – that:
Despite higher household income, household consumption was weak at 0.1 per cent, in line with the retail trade estimates. This weak household spending combined with growth in household income resulted in an increase in the household saving ratio for the first time in five quarters …
Net exports contribution to growth was flat this quarter despite higher Mining production and exports of coal and iron ore. The terms of trade fell 0.4 per cent on the back of lower export prices.
The contribution of household consumption expenditure was mainly “driven by rises in insurance and financial services (1.3%), rent and other dwelling services (0.6%), and food (1.0%). There were falls in health (-1.0%), hotels cafes and restaurants (-0.9%), and recreation and culture (-0.6%).”
Public consumption expenditure “increased 0.2% in seasonally adjusted terms. State and local government consumption grew 0.4%, while national government consumption contracted by 0.1%.” So Federal spending fell in this area.
The ABS note that “Gross fixed capital formation increased 1.8% in seasonally adjusted terms. Public investment decreased 7.5% during the quarter driven by state and local general government (-15.4%).”
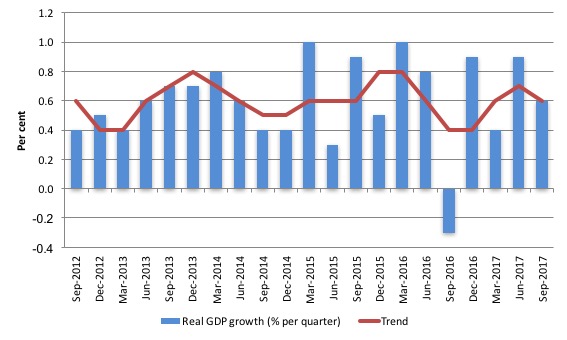
The graph the quarterly growth over the last five years (with the red line being the ABS moving average trend). The trend growth is pointing downwards but that direction is not yet consolidated in my view.
We are getting surges and then corrections in growth at present.
Analysis of Expenditure Components
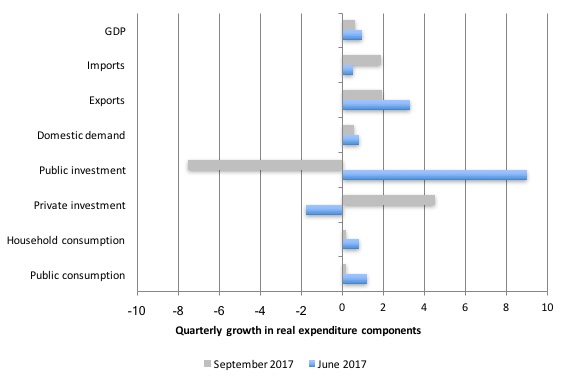
The following graph shows the quarterly percentage growth for the major expenditure components in real terms for the September-quarter 2017 (gray bars) and the June-quarter 2017 (blue bars).
The large swing in public sector capital investment expenditure is clear and significant for the overall growth result. Public investment tends to be lumpy – something big gets purchased which lasts for a long time.
Domestic demand growth declined slightly to 0.6 per cent in the September-quarter 2017, which given the zero contribution from the external sector drove the GDP result.
Household consumption growth fell sharply to 0.15 per cent (down from 0.8 per cent in the June-quarter). The saving ratio rose slightly, which may signify that the credit-binge that has been driving consumption growth in recent quarters is coming to an end.
That spells trouble for the national growth rate although a restructuring of household balance sheets is past the time it has been essential. What it tells us is that fiscal deficit support for growth will be required into the future.
Private investment growth was positive (4.5 per cent) and reversed the string of contracting quarters – that is a good sign.
Exports volumes rose by just 1.9 per cent (although prices fell) and was accompanied by a 1.9 per cent growth in imports.
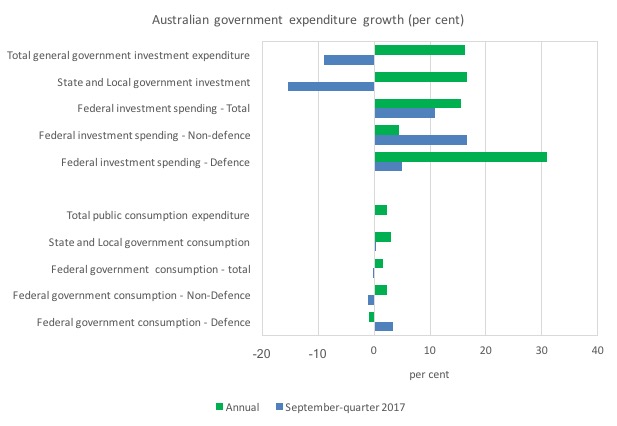
The following graph shows the profile of public consumption and investment expenditure at the different levels of government.
It is clear that public sector investment expenditure has been very strong over the last year, particularly at the state and local government level (large projects such as the Metro expansion in Melbourne, Westconnex in Sydney) and in the defence area (Federal government).
However, as noted above, public capital expenditure declined sharply in the September-quarter and this will feed into subsequent annualised results in future data releases.
Contributions to growth
What components of expenditure added to and subtracted from real GDP growth in the September-quarter 2017?
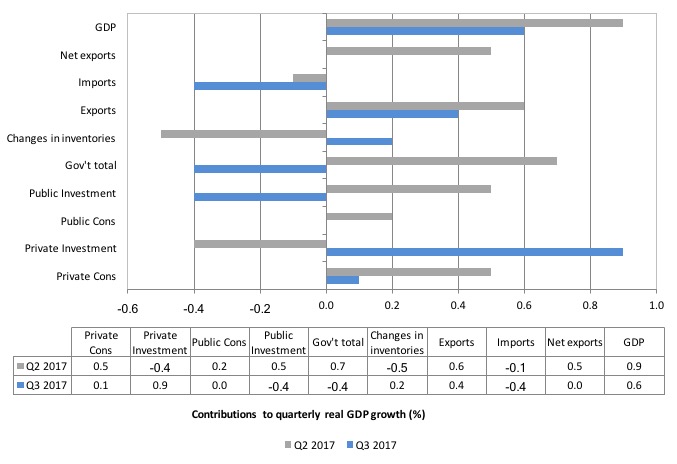
The following bar graph shows the contributions to real GDP growth (in percentage points) for the main expenditure categories. It compares the September-quarter 2017 contributions (blue bars) with the June-quarter 2017 (grey bars).
Net exports added zero percentage points from growth in the September-quarter 2017, although export volumes rose (and prices fell).
Private household consumption contributed just 0.1 percentage points (down from 0.5 points) to growth and the saving ratio rose slightly.
The public consumption contribution fell to zero from 0.2 points.
But public investment (capital formation) subtracted 0.4 percentage points to growth (after adding 0.5 points last quarter).
The overall contribution of the government sector to growth was thus minus 0.4 percentage points.
The strongest contributor to growth in the September-quarter was private capital formation (0.9 points up from -0.4 points). This may be a sign that the economy is adjusting to the downturn in the mining sector and redirecting spending on productive capacity into the non-mining areas. We will know more when the detailed data is released soon.
Australians overall are slightly better off now in income terms than they were in September 2016
The ABS tell us that:
A broader measure of change in national economic well-being is Real net national disposable income. This measure adjusts the volume measure of GDP for the Terms of trade effect, Real net incomes from overseas and Consumption of fixed capital.
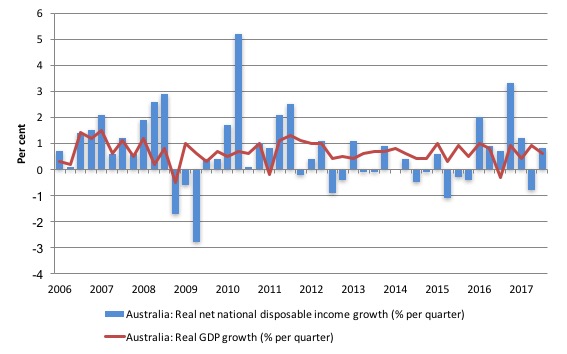
While real GDP growth (that is, total output produced in volume terms) grew by 0.6 per cent in the September-quarter 2017, real net national disposable income growth grew by 0.8 per cent.
Real net national disposable income growth has been weak since 2011 and has been criss-crossing the zero line for the last three or so years.
But over the last year, it has increased by 4.5 per cent which means that Australians were better off in the September-quarter 2017 in income terms than they were twelve months prior.
This conclusion has to be tempered because the terms of trade are now pointing downwards.
The following graph shows the evolution of the quarterly growth rates for the two series since the December-quarter 2006.
Household saving ratio rose modestly to 3.2 per cent
The squeeze on wages in Australia is manifesting in two ways. Rising indebtedness and a falling saving out of disposable income. Household consumption has been driven in recent quarters by credit and saving withdrawals.
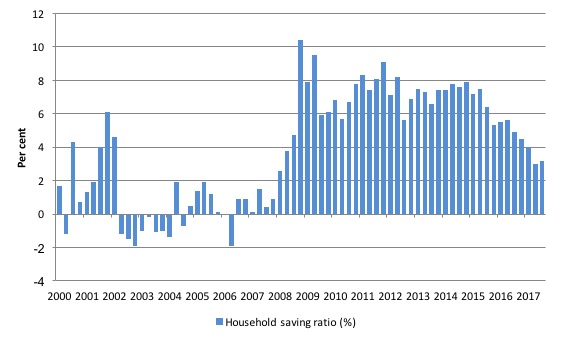
The following graph shows the household saving ratio (% of disposable income) from 2000 to the current period.
Over the last 12 months the household saving ratio has fallen from 4.9 per cent to 3.2 per cent, although it rose by 0.2 points in the September-quarter (from June).
The decline in the Household saving ratio from its 2011 levels has been associated with a renewed rise in household indebtedness – back to record levels. It was also the period when the federal government started to turn on the austerity wheel.
After the GFC hit, the household sector sought to reduce the precariousness in its balance sheet exposed by the GFC.
Prior to the crisis, households maintained very robust spending (including housing) by accumulating record levels of debt. As the crisis hit, it was only because the central bank reduced interest rates quickly, that there were not mass bankruptcies.
In June 2012, the ratio was 11.6 per cent. Since the December-quarter 2013, it has been steadily falling as the squeze on wages has intensified.
While the recent trend has been downwards, it is unlikely that households will return to the very low and negative saving ratios at the height of the credit binge given that the household sector is now carrying record levels of debt.
At some point, household consumption growth will fall with other expenditure components behaving the way they are. The very weak household consumption result in the current quarter may signify that this process of adjustment is underway.
This also means that government surpluses which were only were made possible by the household credit binge are untenable in this new (old) climate.
The Government needs to learn about these macroeconomic connections. It will learn the hard way if net exports weaken and it tries to impose further austerity.
Real GDP growth and hours worked
There has been a sharp dislocation between what is happening in the labour market and what the National Accounts data has been telling us over recent years.
Growth in employment and hours worked has been very modest over the period while annual real GDP growth was around 3 per cent.
At those GDP growth rates, employment growth should have been much stronger than it has been.
That pattern appears to be changing.
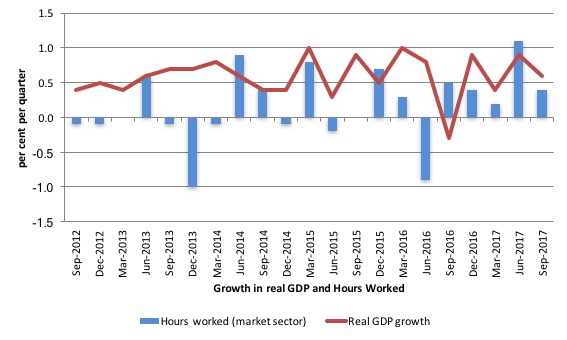
The following graph presents quarterly growth rates in real GDP and hours worked using the National Accounts data for the last five years to the September-quarter 2017.
You can see the major dislocation between the two measures that appeared in the middle of 2011 persisted throughout 2013 and reasserted itself in early 2016.
In the September-quarter 2017, real GDP growth and hours worked moved in tandem – downwards.
Today’s data shows that GDP per hour worked (productivity of labour) was zero in the September-quarter 2017 after falling by 0.4 per cent in the June-quarter 2017.
So it was no surprise that hours worked rose by 0.4 per cent while real GDP rose by 0.6 per cent.
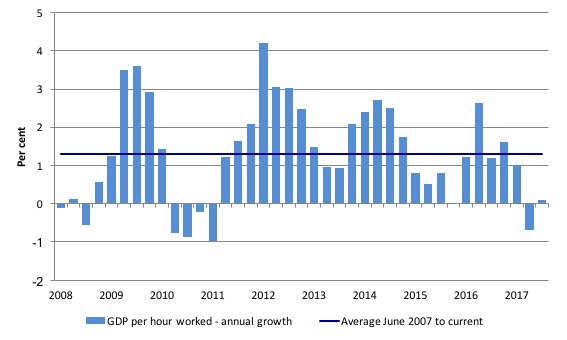
To see the above graph from a different perspective, the next graph shows the annual growth in GDP per hour worked (so a measure of labour productivity) from the June-quarter 2008 quarter to the September-quarter 2017. The horizontal blue line is the average annual growth since December-quarter 2007.
The relatively strong growth in labour productivity in 2012 and the mostly above average growth in 2013 and 2014 helps explain why employment growth has been lagging given the real GDP growth. Growth in labour productivity means that for each output level less labour is required.
In the September-quarter 2017, annual labour productivity growth was at 0.1 per cent (well below the recent average of 1.3 per cent). This will mean the relatively slower annual real GDP growth rate will probably not push unemployment up as much as it would had productivity growth been close to that average.
Conclusion
Remember that the National Accounts data is three months old – a rear-vision view of what has passed and to use it to predict trends is difficult.
Coming up with assessments of where the economy is heading requires analysis of the more recent data – such as labour force surveys and the like.
But today’s National Accounts data indicates that the Australian economy grew modestly in the September-quarter 2017 although the drop in household consumption and the zero contribution from the external sector does not augur well.
The negative contribution from the public sector is also unwarranted, given that overall growth is still well below pre-GFC trends and there are elevated levels of unemployment and underemployment.
Overall, this is not a balanced growth outcome. The outlook is very uncertain given the lumpiness of the public spending.
That is enough for today!
(c) Copyright 2017 William Mitchell. All Rights Reserved.
Australia’s poor economic performance continues when compared to what it could be with proper government spending and full capacity utilisation of humans and factories, plant, equipment, materials and other assets. It so disappointing that we still cannot escape the neoliberal, monetarist, illogical group-think mindset.
One of my (now adult) children has a permanent part-time government job which could so easily be a permanent full-time job. The government could find the money. Call it an MMT approach, call it Keynesian pump-priming it matters not in a sense as it is simply deficit spending in a flat, low inflation part of the cycle. If it were a full-time job my offspring in question has a better springboard to independent household formation; a healthy thing personally, socially and economically. My offspring in question would get more wages to spend helping other parts of the economy. The cultural, child-development and adult-development services that workplace offers can be increased with more full-time staff. It would be win-win-win-win-win-win all round basically.
I seriously ask are neoliberals just greedy and stupid or does it go beyond that? Are they actually hating and cruel? Do they actually hate most people and want to see them held back and immiserated. I am strongly coming to believe that there is a real pathology involved. When you look at the revered icon of the modern alt-right, neoliberal class, Donald Trump, it is clear that hatred, malevolence and enjoyment of cruelty and inflicting pain are all involved all being elevated into twisted “ideals”.
Why is it said that “The annual growth rate was 2.8 per cent and remains below the rate that is required to keep unemployment from rising given productivity and labour force growth.”
When unemployment was falling when GDP was 1.8% ?
Perhaps the large surge in state government investment that has been adding to overall growth for the past year was starting to dry up by the end of the September quarter – just as the private sector was betting on growth to continue and ramping up their investment. As I understand it, it was supposed to be close to peaking about now.
The fall in public investment you have here was entirely driven by the opening of the new Royal Adelaide hospital in the June quarter (the entire spend entered that month rather than as the work was being done). Abstracting from this, public investment growth was actually very strong, particularly in NSW and Vic.
I’m just wondering if the official data that is used to work out GDP etc. is all that kosher[?]
How much spending is going on which is not in the official budget statistics? Yet it has to have an effect . Take for example the $US 29 Trillion used between 2008 and 2010 to save the banking sector. This is a giant sum but I see no acknowledgment in the deficits. It’s not going to be paid back [maybe some will] but since its in the financial sector very little will show up in the everyday economy.
But not all spending goes into the financial sector. I believe there are a host of expenses incurred by the military that are off budget, [US figures].
The list I saw includes; The cost of military pensions [21million veterans], the cost of maintaining nuclear weapons. the cost of “Black Budgets”[min$50million], Cost of mercenaries [like Blackwater]. Cost of healthcare for wounded and disabled veterans, Cost of military operations, in the MENA sector. And so on.
Then here in OZ we have disaster relief, like $2billion for Aceh after the 2004 tsunami, plus the Queensland floods, bushfires etc. Stuff that would overwhelm insurance companies.
If even only some of this is true we have no idea of the true picture, it would seem.
I would be grateful if Prof Bill would address the issue of Cryptocurrencies and its effect on the present/future dysfunctional financial system.
It could revolution the System,just as cell phones and the Internet have revolutionised communications.
You could say that Cryptos are the Internet of money.
Early days of course,but as in Metcalfes Law, the more users the more functional and acceptable.
I would very much appreciate Bills analytical skills put to work on the future of Cryptos, as even MMT philosophy could be made redundant
Salford Lad:
You can’t pay your taxes with Bitcoin. End of story.
@Gladys
I’ll admit to being no longer up to speed on these things. Public investment in generally good but as I understand it, it’s contribution to growth is about to slow dramatically (unless something new has been added to the pipeline).
There has been a very strong surge in infrastructure spending over the past few years, with the year just gone being particularly impressive. But the size of the growth over the next year is only a fraction of that which occurred over the year to date, even less the following year and then falling after that.
So unless something comes along to change things, it looks like the significant contribution it has been making to growth is largely expended already.
Disposable income up? I wonder what policy/economic arrangements led to that.